The goal of this blog is to create a list of super facts. Important facts that are true with very high certainty and yet surprising, misunderstood, or disputed by many. This blog aims to be challenging, educational, and fun, without it being clickbait. I determine veracity using evidence, data from reputable sources and longstanding scientific consensus. Prepare to be challenged (I am). Intentionally seek the truth not confirmation of your belief.
Super fact 35: Natural disasters kill a lot less people now compared to 100 years ago. That is despite a larger population and despite the fact that climate change has increased the frequency and intensity of many types of natural disasters.
This is a super fact because surveys, such as this questionnaire from Gap Minder, show that the vast majority of the public (90%) believe that deaths from natural disasters have increased or stayed the same. Gap Minder is a Swedish highly respected non-profit founded by Hans Rosling that promotes increased use and understanding of statistics. Our World in Data (OWID), a renowned scientific online publication focusing on large global problems largely took its inspiration for Gap Minder and Hans Rosling.
The reason for the fewer deaths from natural disasters is not that there are fewer natural disasters, on the contrary, it is because we are now much better at predicting, handling and recovering from natural disasters. Our warnings systems, rescue systems and healthcare have improved significantly.
The graphics in this article from BBC show that the frequency of natural disasters has increased, and that the cost of natural disasters has increased, and yet the number of deaths has decreased.
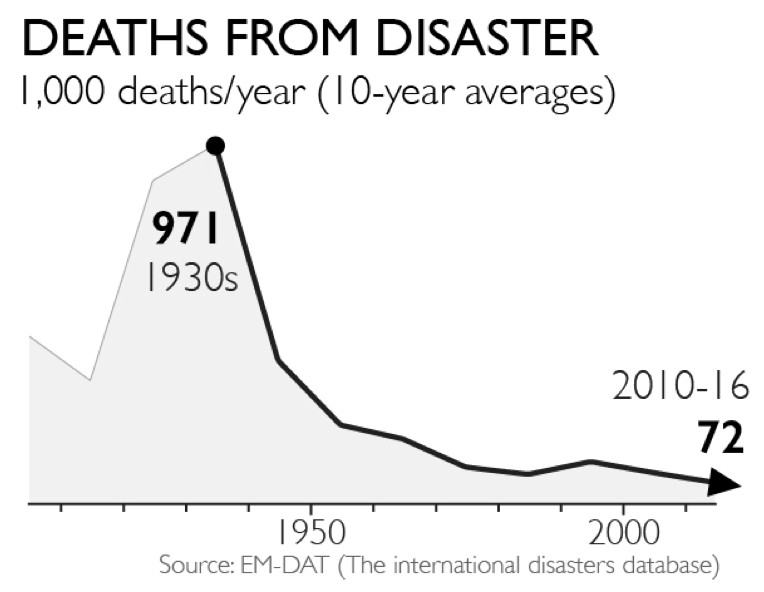
The graph below comes from the Gap Minder article. It shows the annual deaths from natural disasters in ten-year intervals starting with 1930. In the 1930’s there were 971 thousand deaths per year from natural disasters and during the period 2010 to 2016 there were 72 thousand deaths per year from natural disasters, an improvement by more than 13 times.
However, it should be noted that there was a huge flood in China 1931 causing an estimated 3 million deaths, and it skews the numbers for the 1930’s interval.
Originally, I set the headline for this super fact to be “10 Times more people died from natural disasters a hundred years ago” but I changed it to “Natural Disasters Kill Less People Now Than 100 Years Ago” because I realized that the 1930’s peak is an outlier because of the 1931 flood. I don’t want my headlines to be click bait.
This graph from the Gap Minder article shows the annual deaths from natural disasters in ten-year intervals starting with 1930. The trend is down.
This does not mean that we should not worry about the increase in frequency and intensity of natural disasters from climate change. First of all, there are no warning systems and healthcare available for Koalas and Elephants, secondly cost matters, and thirdly there is no guarantee that we can keep improving our ability of predicting, handling and recovering from natural disasters enough to match the accelerating risks for natural disasters.
What People Believe Regarding Disaster Deaths
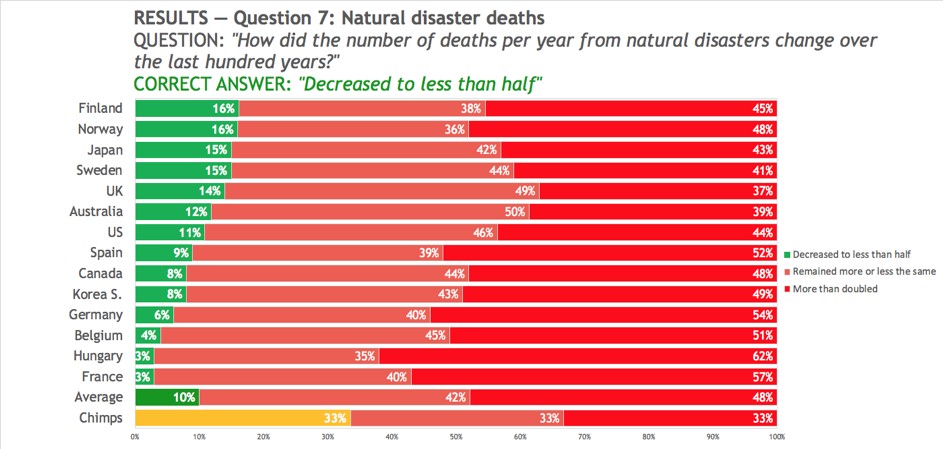
The Gap Minder article above report on a question survey conducted by Gap Minder. They asked large groups of people in 14 countries the following multiple-choice question “How did the number of deaths per year from natural disasters change over the last hundred years?” The choices were:
A. More than doubled
B. Remained more or less the same
C. Decreased to less than half
Most people answered A, a lot
of people answered B, but only 10% got the correct answer C, decreased to less than half. In other words, if chimpanzees had answered this question by randomly picking an answer, they would have done better than people. This is why I consider this a super fact. Below is a graphics taken from the Gap Minder article that shows how people in different countries responded.
The histogram graphics above show the answers to the question “How did the number of deaths per year from natural disasters change over the last hundred years?” The correct answer “decreased to less than half” (in green) was rarely picked. The graphics is taken from the Gap Minder article mentioned.
EF3 Tornado in Dallas
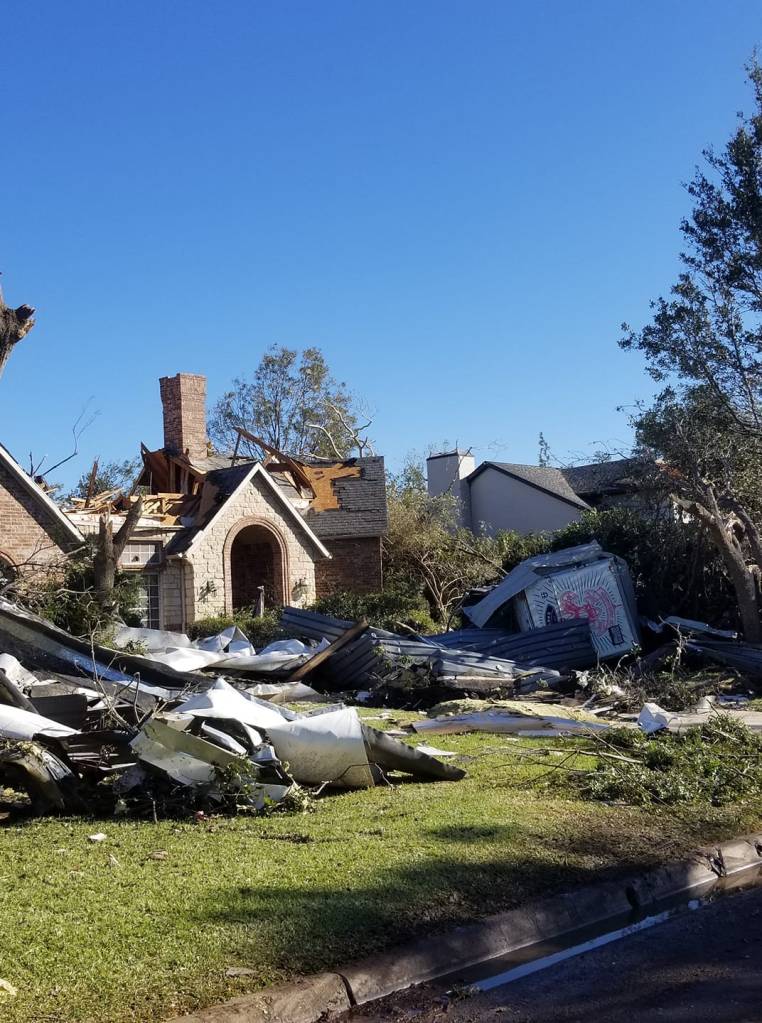
In October 2019 an EF3 tornado ripped through our neighborhood. It left a 2-3 miles long trail of destruction. Roofs were lifted off houses, cars and buses were flown around, hundreds of houses were destroyed, bricks were flying around in the wind, trees were uprooted, and tree branches were flying around, and pieces of concrete crashed into buildings and hit steel fences so forcefully that it bent even quarter inch thick steel fences.
Unlike many of our neighbor’s houses, our house stood, but our chimney was smashed by a piece of concrete coming off a neighbor’s house, we had to replace our roof, our garage door, the wiring in the attic, our fence and my grill flew around in the yard. The amazing thing was that no one in the neighborhood died.
Why did no one die? Was it maybe because no one was outside walking the dog, or driving around, because everyone had received the alarm on their mobile phone about the approaching tornado and was therefore sheltering inside in a safe place? Imagine the same thing happening in the 1930’s.
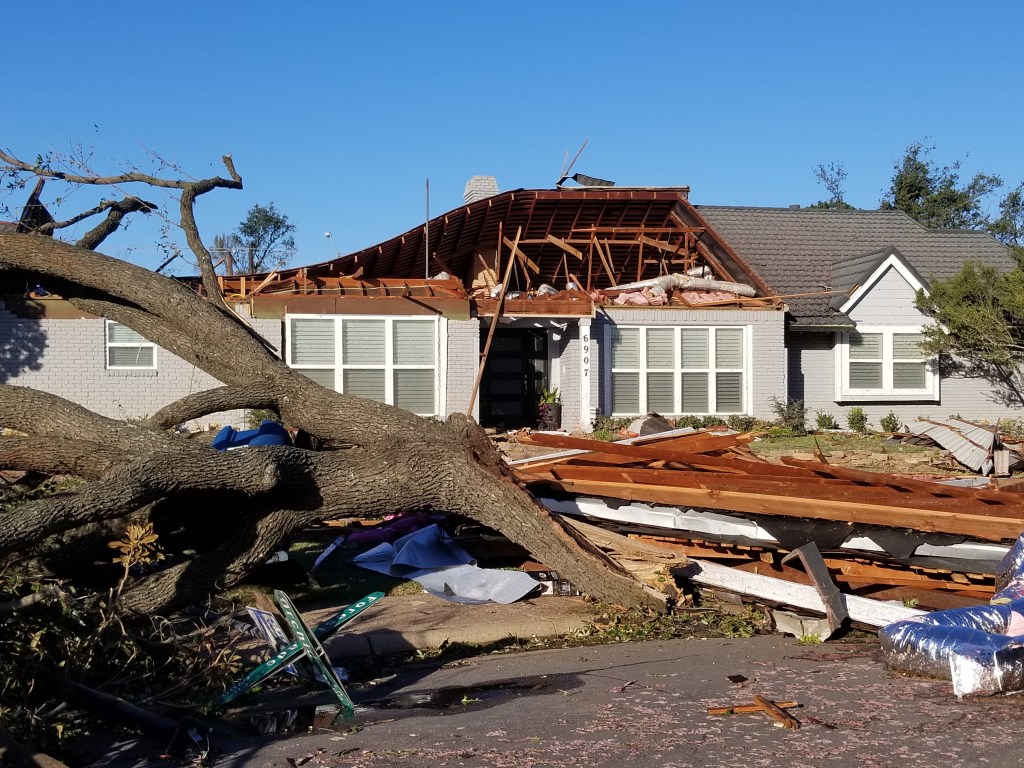
Below are a few photos from that day and here are two links with more photos, link-1 , link-2. On the five-year anniversary of this event NBC news interviewed me about this event. To see the interview click here . My interview is at one minute and ten seconds.
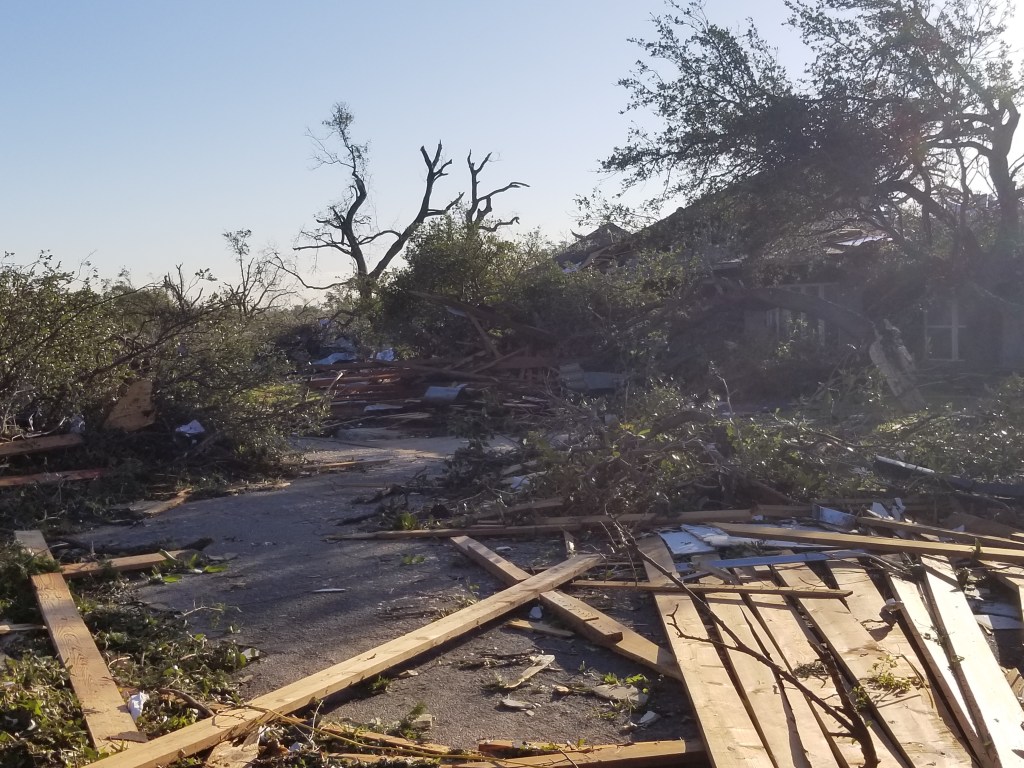
NBC used this photo. A neighbor’s house the morning of October 21st, 2019. Again, click on the image, or here, to see the interview. My interview is at one minute and ten seconds.Another neighbor’s house. This house was about 100 yards from our house. It took a direct hit from the tornado.Another house in our neighborhood.
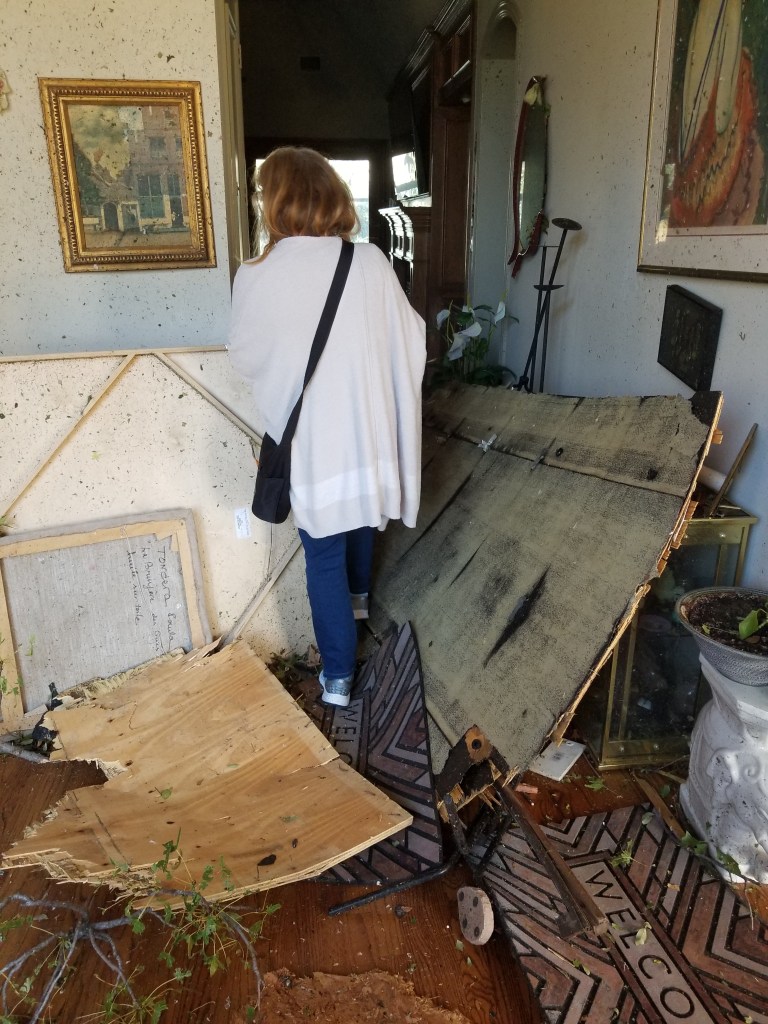
My wife Claudia asked me to go check on her parents. I drove about 50-100 yards when a neighbor’s roof lying across the road stopped me. I turned around but this time I was stopped by a large pile of trees lying across the street. So, I started walking, but this time I was stopped by a group of firemen telling me that it was too dangerous to be outside. They told me to go back home, and I did. The next day we were able to visit her parents and below is what we saw.
Inside my wife Claudia’s parents’ house. This was the morning after. In the photo we are walking into their house to check on them (that’s my wife).
Super fact 33: Actions such as eating locally, buying organic produce, using paper straws, and recycling can be good for the environment but can also be worse for the environment and these actions often have a much smaller positive impact than alternative rarely considered actions. What are popular actions for the environment is often different from what is effective.
I consider this a super fact because the beliefs regarding what is good for the environment and what is bad for the environment and what has a significant impact and what has not, are often based on popular trends and culture rather than knowledge. We need to educate ourselves. Following trends is not the answer to good stewardship of the planet.
This content was generated by an Artificial Intelligence (AI) system. Asset id: 2531547331
Is Locally Grown Food Really Better for the Environment?
As I explained in this post eating locally is not necessarily ecological. Agricultural products that are grown off season or in non-native environments are often grown in greenhouses, which require a lot of energy and generate significantly more emissions than shipping the produce across oceans would. This is especially true for crops like tomatoes, cucumbers, mangoes and bananas, that require warmer climates to be grown in open fields.
From pexels.com by Julia Nagy.
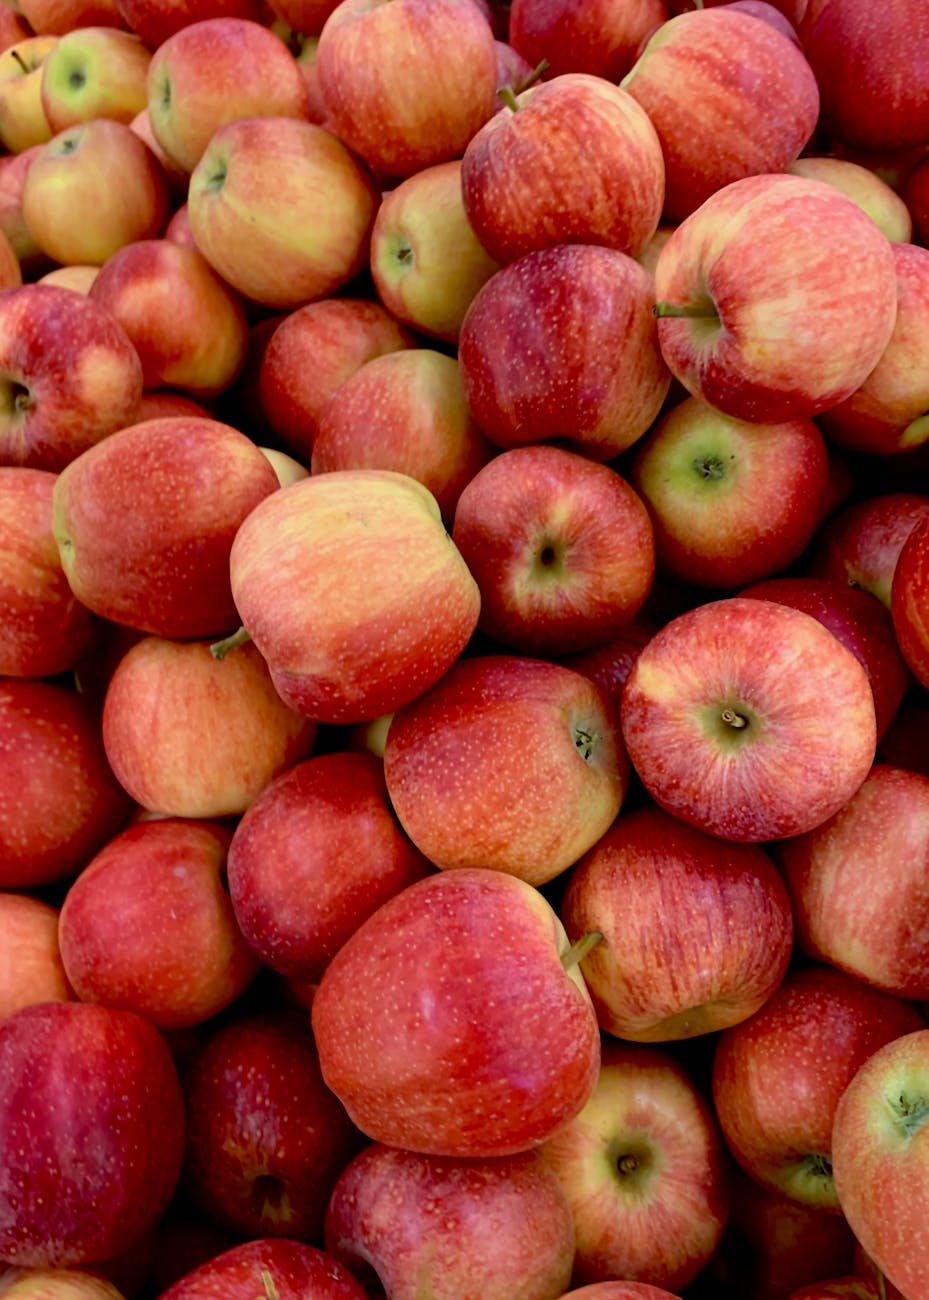
In some cases, the crop requires significant water resources or chemical inputs to thrive and may not be suitable for warmer climates, for example, apples. Some crops, like avocados or almonds require a lot of water but despite that they are grown in dry places like California (80% of California’s freshwater is used for agriculture). From an environmental perspective it would be better to grow these crops in a suitable environment and then transport them.
Is Eating Organic Really Good for the Environment?
As explained in this post eating organic is not necessarily ecological. Despite strong public perception of organic agriculture producing better environmental outcomes, conventional agriculture often performs better on environmental measures including land use, greenhouse gas emissions, and pollution of water bodies. There are, however, some contexts where organic agriculture may be better for the environment.
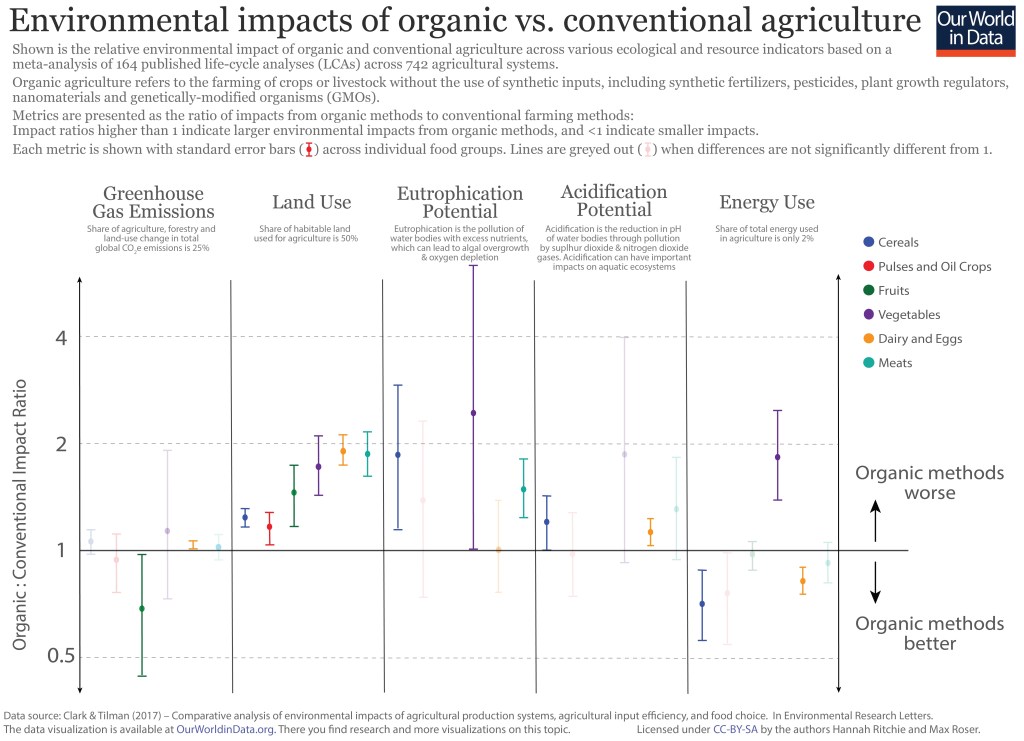
The graph below gives an overview of the environmental impact of various types of crops grown organically and conventionally. As you can see organic crop often require double as much land compared to conventionally grown crops. It is complicated.
Shown is the relative environmental impact of organic and conventional agriculture across various ecological and resource indicators based on a meta-analysis of 164 published life-cycle analyses (LCAs) across 742 agricultural systems. Roughly, lower in the graph means organic is better and higher up in the graph means conventional farming is better. Data source: Clark & Tilman (2017) – Comparative analysis of environmental impacts of agricultural production systems, agricultural input efficiency, and food choice. In Environmental Research Letters. The data visualization is available at OurWorldinData.org<<Link-10>>. There you can find research and more visualizations on this topic. Licensed under CC BY-SA by the authors Hannah Ritchie and Max Roser.
What really matters though is the type of food you eat, not whether it is organic or not. For example, beef (from beef herd) causes emissions 188 times larger than nuts do for the same amount of protein provided. Another thing to note is that if you eat 300 steaks per year you will have a 100 times larger environmental impact from your meat eating compared to someone who eats 3 steaks per year. You don’t have to become a vegetarian to have a smaller environmental impact but quantity matters.
Is Recycling Important?
The common perception that recycling is one of the best things you can do for the environment is not correct. Its impact is often not very large and if not done properly it can be counterproductive. If you throw a greasy pizza box in the recycling, you can ruin the entire batch.
Surveys across 21,000 adults in 30 countries showed that the two actions among twelve that people believed saved the most greenhouse gases were recycling (59%) and upgrading lightbulbs (36%). As it turns out, those two saved the least greenhouse gases among the twelve options. The option saving the most greenhouse gases among the 12 was giving up an SUV, which saved 18 times as much greenhouse gases as recycling. 17% of respondents picked that one.
According to Our World in Data (and the book Not the End of the World page 114<<Link-6>>), which is based on this research, giving up an average SUV for a sedan would save 3.6 metric ton, or 22.5% of the carbon emissions for the average American. Switching to a plant-based diet would save 2.2 metric ton per person, or 13.8%. Recycling comes in at a savings of 0.2 metric tons according to the same data. EPAs estimates are slightly higher but still low in comparison.
Plastic straws versus paper straws
Producing a plastic straw requires 39 kilojoules of energy and produces 1.5 grams of carbon dioxide emissions. However, producing a paper straw requires 96 kilojoules of energy and produces 4.1 grams of carbon dioxide emissions. So, plastic straws are better for the environment from that perspective. However, this could be compared to a typical passenger vehicle, which emits about 4.6 metric tons of CO2 per year according to EPA. That corresponds to more than 3 million plastic straws and more than one million paper straws.
According to the same article the average passenger vehicle emits about 400 grams of CO2 per mile. So, driving just one mile corresponds to hundreds of plastic straws and paper straws.
One advantage of paper straws is that they are easier to recycle, at least under ideal circumstances. Unfortunately, they often get soggy, and recycling plants don’t want that so they often throw them out. Another advantage is that paper straws decompose and don’t end up in our ocean.
However, not only are straws very small items, most of the plastic pollution in the ocean does not come from north America(1%) or Europe (1%). Paper straws versus plastic straws seem like a complex riddle but it may not be an important one. Whether you drive more or drive less is probably a lot more important.
Plastic bags versus paper bags
As with plastic straws versus paper straws plastic bags versus paper bags is a complicated question. From an environmental perspective they both have advantages and disadvantages. Plastic bags are less carbon intensive to produce, are easier to reuse several times, and the production of plastic bags require on average four times less energy than the production of paper bags.
On the other hand, paper bags are decomposable and easier to recycle. However, the chemicals and fertilizers used in producing paper bags create additional harm to the environment. It is a complicated question.
Plastic Ocean pollution. Whale Shark filter feeds in polluted ocean, ingesting plastic. Asset id: 1120768061 by Rich Carey
Having a Significant and Positive Impact on the Environment
Some of the allegedly sustainable practices and actions mentioned above are counter productive and others have a very small effect, for example, carbon emissions savings that are a few grams. According to the “Our World Data” and the book “Not the End of the World” page 114, a compilation of data research, some actions that you can take that will significantly reduce carbon emissions are (savings in metric tons per year, for flight it is per trip):
Giving up an SUV 3.6 tons
Go car free (average car) 2.4 tons
Switch to plant-based diet 2.2 tons
Avoid transatlantic flights 1.6 tons
Buy green energy 1.5 tons
Switch to electric car (from average sedan) 1.2 tons
Switch from electric car to none 1.2 tons
Avoid medium flight 0.6 tons (1,700 miles each way going and returning)
Laundry in cold water 0.25 tons
Hand-dry clothing 0.2 tons
Recycle 0.2 tons
Upgrade light bulbs 0.1 tons
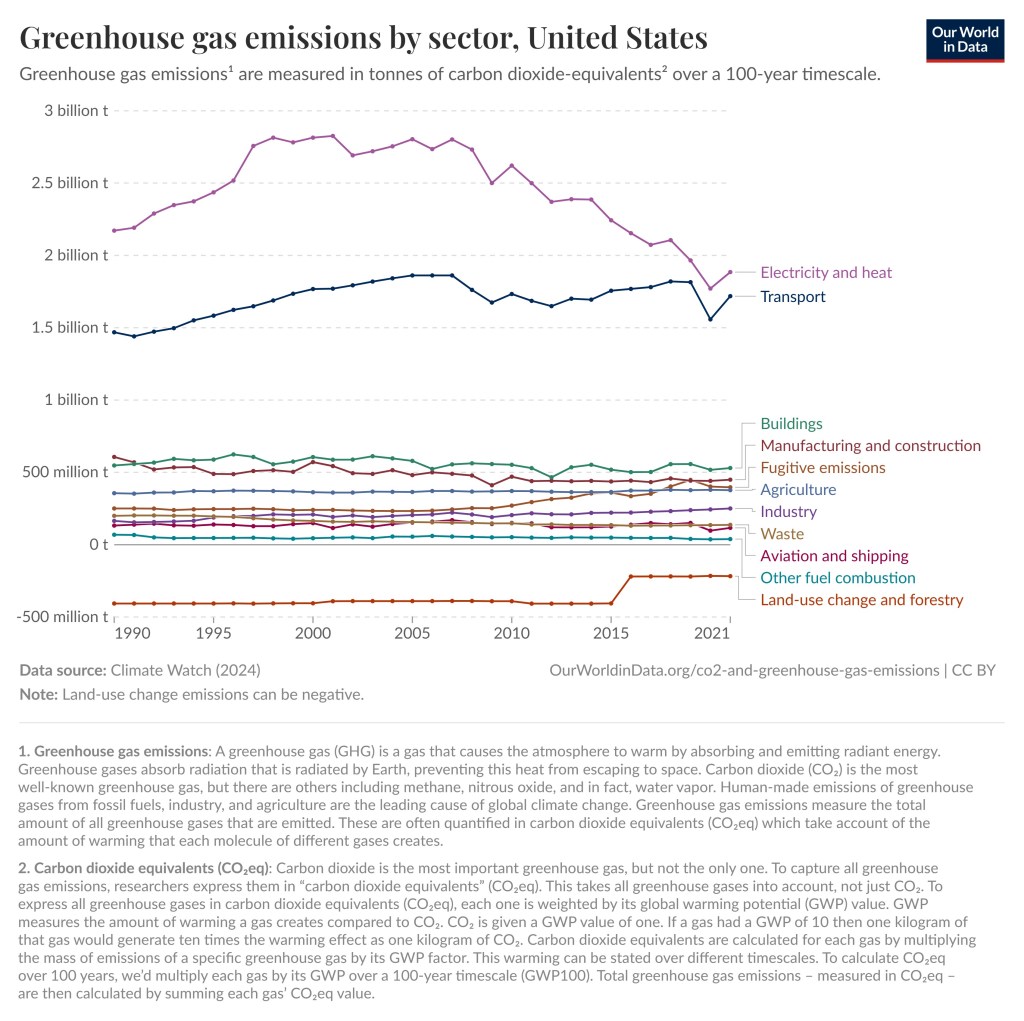
As you can see in the graphs below, the largest contributor of greenhouse gas emissions in the World and in the United States is electricity and heat. Unfortunately, the composition of the electric grid is something we as consumers have very little control over. We can save energy, get solar panels for our roof, or buy our electricity from green energy companies, but we cannot easily change the composition of the grid. Energy companies and politicians must do that.
However, we can make our voices heard by calling and writing to our representatives. This might be the single most impactful action that you as an individual can take. Your congressman, senator, or state legislator will probably not read your letter. They have hundreds of thousands or millions of constituents and get lots of letters every day. What is likely to happen is that a staff member will skim the letter and note the concern in a database.
Just make sure that your letter is politely written so it does not go in the wastebasket. Also make sure that you are a constituent. Writing to Ted Cruz when you live in Florida is not going to have an impact. They are interested in finding out what the concerns of their constituents are and according to staff members and other information I have come across, this really has an impact.
Data source : Climate Watch (2024). Note : Land use emissions can be negative. OurWorldinData.org/co2-and-greenhouse-gas-emissions| CC BYData source : Climate Watch (2024). Note : Land use emissions can be negative. OurWorldinData.org/co2-and-greenhouse-gas-emissions| CC BY
Conclusion
The survey mentioned above showed that among the twelve environmental actions an individual could take, the one with the second to smallest positive impact was the one that the majority thought had the biggest positive impact, despite it having a relatively tiny impact. The actions that could really make a huge difference were hardly considered.
We, the public, are very bad at determining what is good or bad for the environment and what has a significant and positive impact or not, even though the data is out there and we easily can look it up. Maybe the biggest positive impact one could have on the environment is to look up the facts and get better educated.
Super fact 30: Eating locally is often promoted as an environmentally friendly choice, but that is not always the case.
Whether the food you eat is sustainable and environmentally friendly or not depends on a lot of factors including agricultural methods, whether greenhouse farming or monocropping was used, and whether the crop is natural to its environment. In addition, inefficient local transportation can result in higher emissions than faraway transport by ships and trains. If a crop is grown locally in greenhouses, the extra energy that is needed, and the resulting extra carbon emissions are often much larger than the emissions from the transport.
I consider this a super fact because it is often assumed that buying locally is the best choice for the environment. After all, transporting something across the world causes a lot of emissions, right? It turns out not to be that simple.
Articles on Transportation of Food in my French Book
The first time this issue was brought to my attention was in my French class. I am learning French, just as a hobby. There was an article in our French book on the transportation of food around the world “Notre planète ne tourne pas rond!”.
We read that cashews were grown in the Ivory Coast in Africa and then sent for peeling and cleaning in Brazil and then sent to France to be sold. The cashews travelled 10,000 kilometers or 6.250 miles. We read about cod that was caught in Norway then sent to China to be cut into filets and then sent to France to be sold. That cod travelled 15,000 kilometers. We all thought it was crazy, and very bad for the environment, so much unnecessary emissions from transportation. But we all learned a few new French words.
Then at our next class, we turned the page “Consommer local, vraiment bon pour la planète?” / “Consuming locally, really good for the planet?”. Wait what? The next article confused us since it stated that in many cases eating locally was bad for the environment, not good for the environment. Transporting the food around the globe might be good for the environment.
Incidentally, at the time I was reading “Not the End of the World, How we can be the first generation to build a sustainable planet” by Hannah Richie, the research director for “Our World in Data”. “Our World in Data” is a highly regarded free and open-source website that collects and analysis vetted statistics on a large range of topics. In that book she stated that the data showed that tomatoes imported to Sweden from Spain caused less carbon emission than tomatoes grown locally in Sweden.
The Problem with Locally Grown Tomatoes
This article from University of Southern Denmark claim that importing tomatoes from warm countries are better for the environment than buying locally. The reason being that when tomatoes are grown in an open field, the production emits an average of 80 kg CO2 per ton, but if the tomatoes are grown in a greenhouse, they emit up to 700 kg CO2 per ton. In northern countries it is common to grow tomatoes in greenhouses, especially when they are out of season. The long transport of the tomatoes causes much less emissions than that.
This scientific article analyses the issue a bit deeper and concludes that “that the distance travelled by the tomatoes is not the most important environmental burden”. Whether the tomatoes were grown in greenhouses or not matters a lot, but there are many other factors. In short, it is complicated.
This study of local vs. imported tomato production in Canada concludes that locally grown tomatoes grown in greenhouses on average cause 1,070 grams of carbon emissions per kilo of tomatoes grown and tomatoes grown open field in Mexico cause 775 grams of carbon emissions per kilo of tomatoes, despite the 3,800-kilometer journey from Mexico to Ontario, Canada. The reason for the higher emissions for locally grown tomatoes is again that greenhouses use a lot of energy.
Naturally, this would change if you grew the tomatoes in season without using greenhouses. The article also notes that carbon emissions are not the only issue for sustainability. Water usage is another important factor.
The Problem with Locally Grown Vegetables and Fruits
Tomatoes are just one example. The same hold true for cucumbers, lettuce and salad greens, potatoes, bell peppers, hot peppers, green beans and other bean varieties, berries, pineapples, bananas, mangoes, other tropical fruits. In addition, some of these crops can deplete the soil and require large amounts of water, which can be bad if they are being cultivated in areas where water resources are already scarce such as growing avocados in California. In general, growing vegetables and fruits in their natural environment tends to be the most sustainable.
The problem with apples tends to be the opposite, geography wise. In warmer areas, they might require significant water resources or chemical inputs to thrive. Apples from cooler climates need less water and fewer chemicals, reducing their ecological impact.
I should point out that growing locally sometimes being worse for the environment than importing does not mean that importing produce is better for the environment. It just means that it is complicated and that you need to make that determination on a case-by-case basis. The environment is also not the only concern. Another consideration is the protection of local farmers and the local economy.
My opinion is, instead of worrying a lot about local versus imported produce, it is better to focus on things that we know cause a lot of emissions. A dirty grid, coal power stations, a non-hybrid SUV with an internal combustion engine, unnecessary business trips, eating a lot of red meat, basically start with the low hanging fruit.
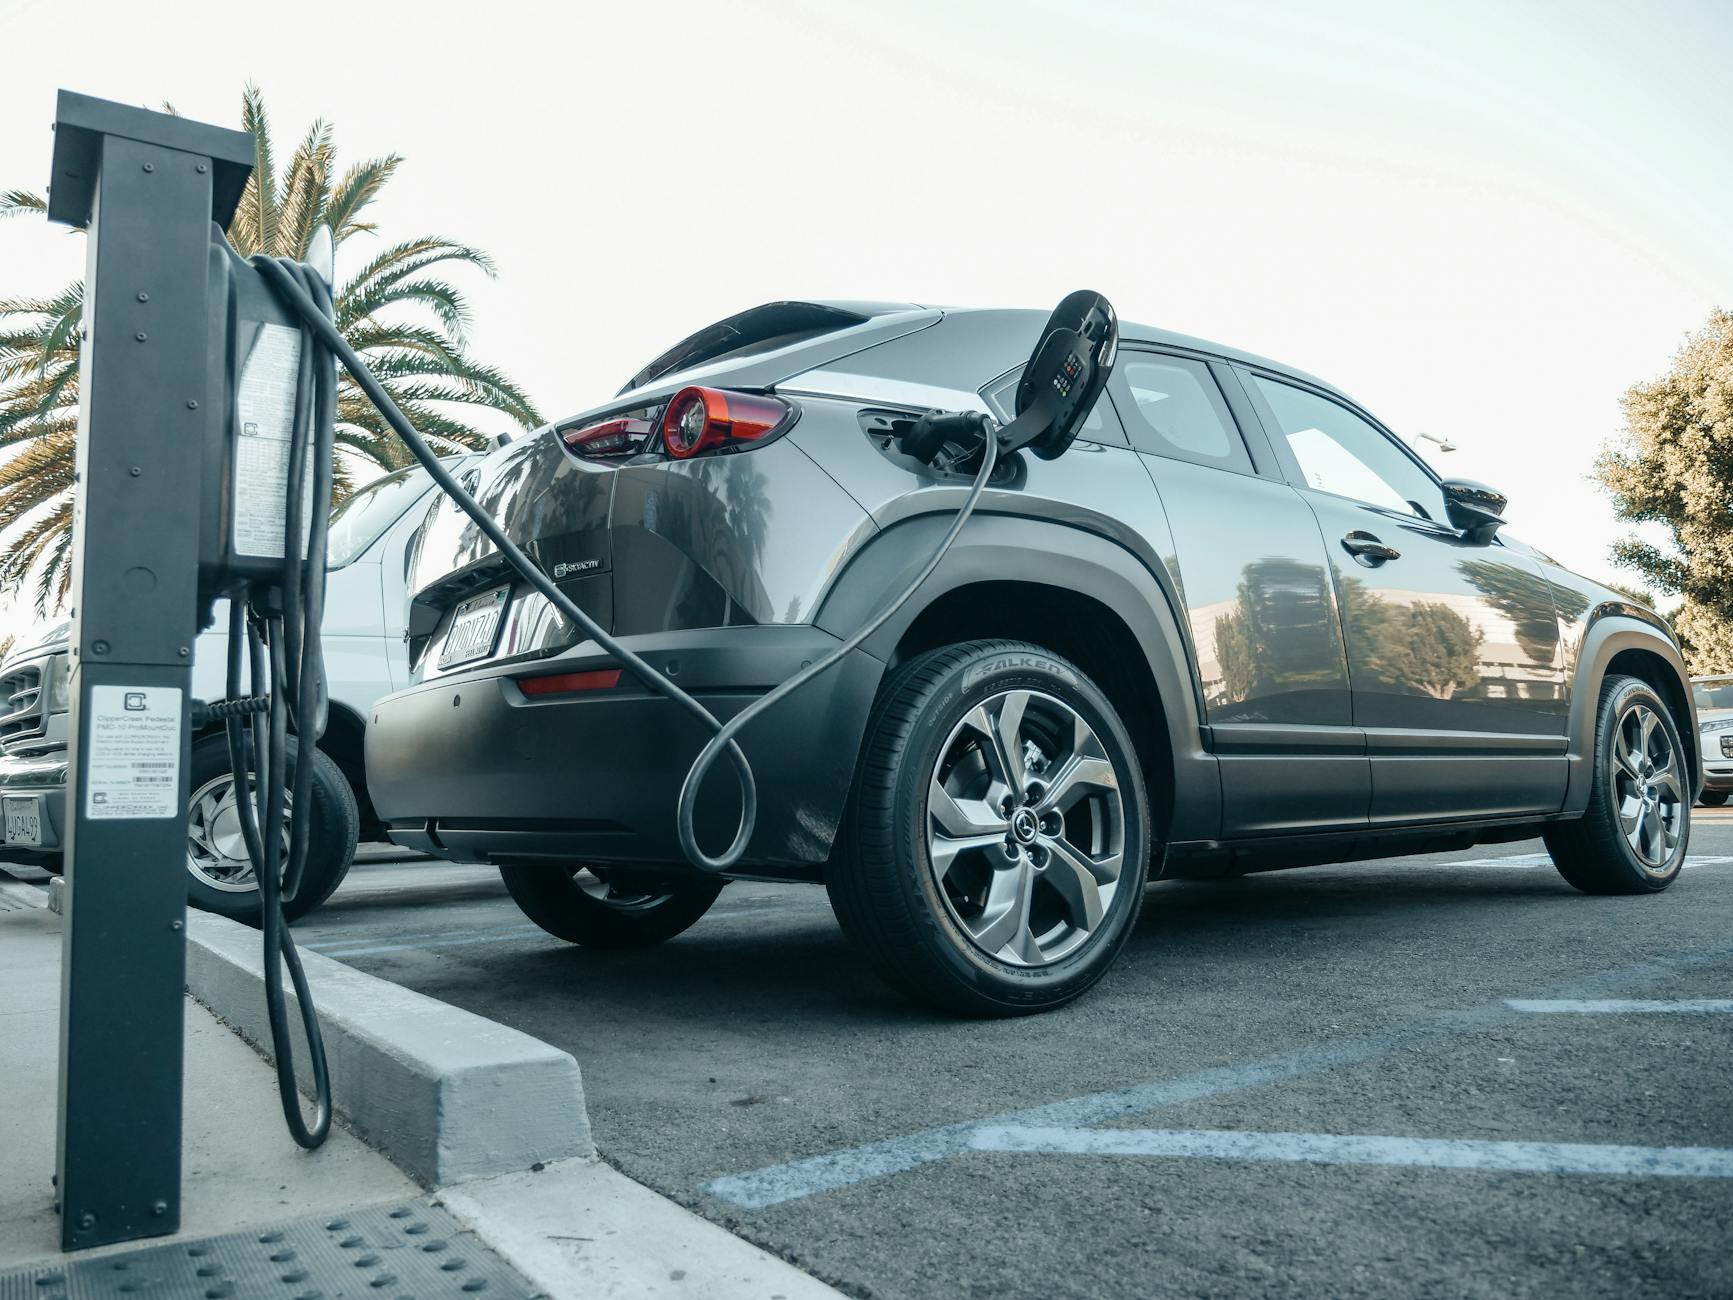
Super fact 29: EV Cars emit less pollution than Internal Combustion Engine Cars, even considering manufacturing, disposal and EV Cars being charged by dirty grids.
EV Cars emitting less carbon pollution is a Super Fact
At least here in Texas it is quite common to hear people say that EV cars do not reduce emissions. After all EV cars use electricity from the dirty grid. It is also frequently implied that environmentalists and people who care about fossil fuel emissions do not understand that the electricity for EV cars typically comes from the dirty grid. However, the environmentalists I know do know that. In fact, they typically know more and have sometimes done the math. This is why I consider it a super fact. We know that it is true that EV Cars emit less carbon pollution. This is a fact that matters, it is not trivia, and yet this fact is frequently disputed, argued over, or surprising to people.
EV Cars are more efficient than Internal Combustion Engines
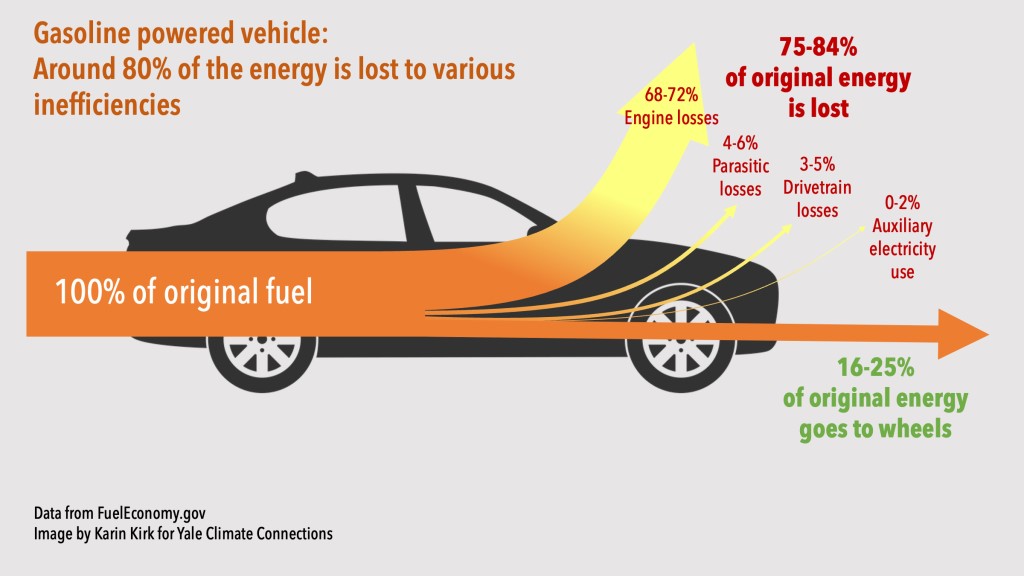
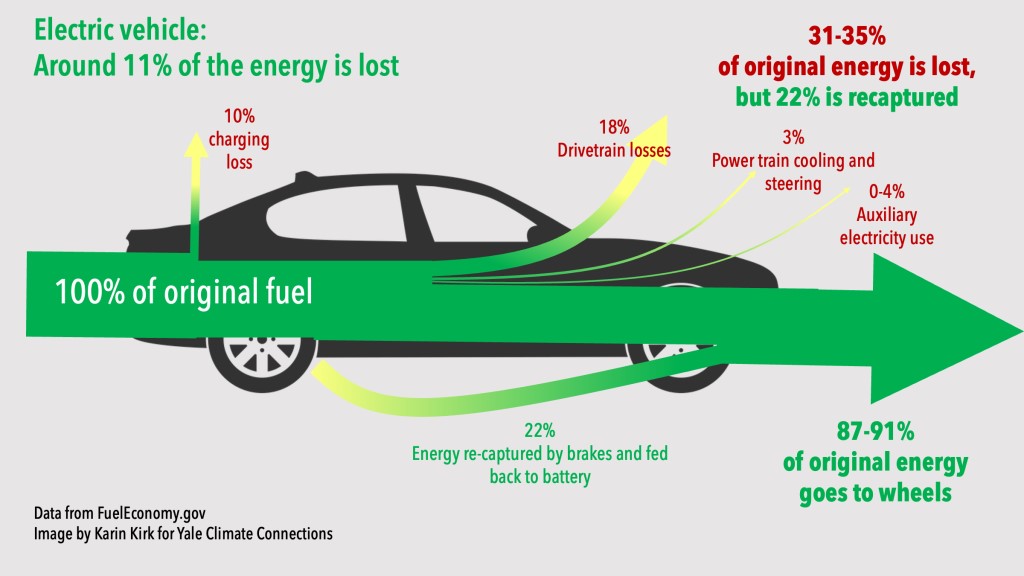
For starters, EV cars are much more efficient than Internal Combustion Engine cars, or ICE, and even a coal-fired power plant is less wasteful than a car engine. The net result is that the emissions caused by EVs via the electrical grid are significantly less per mile. The miles per gallon equivalent (MPGe) for electric vehicles (EVs) varies by state/grid and depends on the model of the car but in general it is much better than for an ICE . Replacing gasoline-powered cars with EVs saves energy, regardless of the energy source used to recharge the EVs. For an ICE 16-25% of the original energy goes to the wheels whereas for an EV 87-91% of the original energy goes to the wheels.
16-25% of original energy goes to the wheels. Data from FuelEconomy.gov, Image by Karin Kirk for Yale Connections.87-91% of original energy goes to the wheels. Data from FuelEconomy.gov, Image by Karin Kirk for Yale Connections.
The Manufacture and Disposal of EV Cars
It takes more energy to manufacture an EV battery for an EV car than it does to produce a combustion engine. So, the production of an electric vehicle does emit more carbon than a petrol car. However, the lower emissions resulting from driving an EV means that an electric car quickly pays back that debt, so to speak. It is typically paid back within two years, according to Hannah Richie, the research director at Our World in Data. The statistics show that switching from an average ICE to an equally sized EV will save 1.2 tons of carbon emissions per person and year. That is a lot considering that the average carbon footprint per year is 4 tons worldwide and 14.4 tons per year for an American.
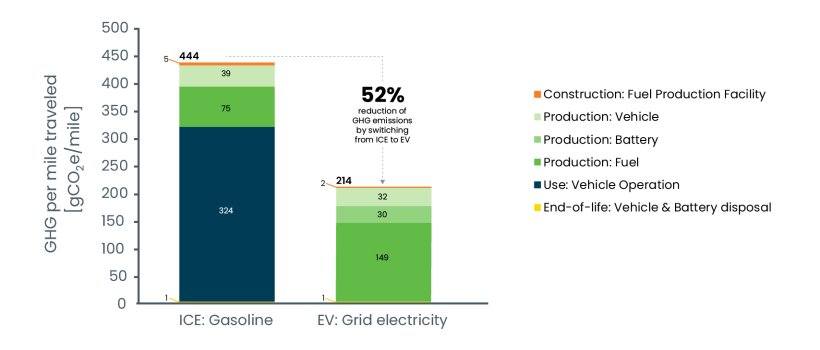
So, are electric vehicles definitely better for the climate than gas-powered cars? This article from MIT answers the question in the affirmative. The graph below includes construction of facilities, manufacturing of vehicle and battery, production of fuel, vehicle operation as well as disposal. It is taken from this government website and this article also answers the question above in the affirmative. This is an article from the Department of Energy is stating the same thing.
Lifecycle greenhouse gas emissions comparison of average gasoline car and average EV.
Hannah Richie at Our World in Data also states that other environmental damages related to EVs such as mining for minerals are less than the damage from mining and extraction for fossil fuel cars, and she claims that the price of lithium-ion batteries has fallen by 98% over the last three decades. It should be noted that EVs are becoming increasingly common. According to Our World in Data in 2022, 88% of all cars sold in Norway were EVs and 54% of all cars in Sweden were EVs.
There are other EV myths that you may want to have debunked, such as Electric vehicle batteries are unreliable and need to be replaced every few years. In 2011 battery failures were common, 7.5%, but in 2023 battery failures were 0.1%. See this article for details and other myth debunking. A related post is my post on electrification.
I should add that there are some drawbacks with EVs such as the easy with which you can charge them, depending on your location. This post is not a promotion of EVs, and I do not drive an EV for various reasons. This post, like most posts in this blog, is about correcting misinformation and getting the facts correct.
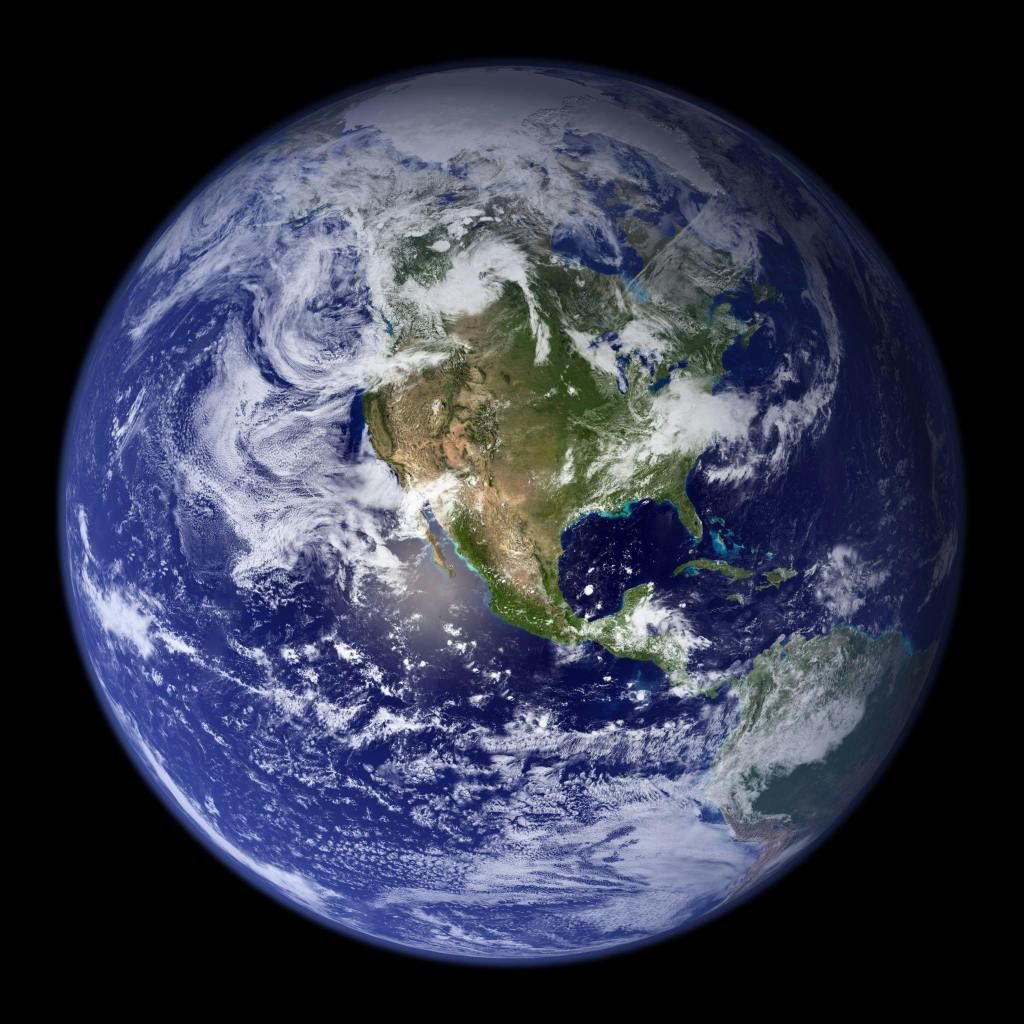
Super fact 28: That Earth is round, or spherical (or closely spherical) had been known for at least a couple of thousand years by the time Columbus set sail. Columbus did not set sail to prove that earth was round, and he knew it was round.
The ancient Greeks, particularly philosophers like Pythagoras and Aristotle knew that earth was round from observing how ships disappeared over the horizon hull first, while their masts were still visible. They noticed the earth’s round shadow cast on the moon during lunar eclipses.
If earth was flat, earth’s shadow would not appear round, especially not all the time. They also noticed that different constellations were visible depending on the location (on earth). So, noticing that earth was round was a simple and obvious observation that easily could be made thousands of years ago.
Earth is a sphere, or closely spherical. Photo by Pixabay on Pexels.com.
Columbus thought that the earth’s circumference was smaller than what Eratosthenes calculation had shown because he relied on maps created by Ptolemy instead of the calculations made by Eratosthenes. When he landed in the New World it seemed like Columbus had been vindicated but that did not last long. Essentially, Columbus sailed west and discovered America because he miscalculated the earth’s circumference.
Columbus thought earth was smaller. He did not know about the Pacific Ocean. Earth Pacific Ocean view Stock Illustration ID: 1617553012 by Matis75
It should be noted that even though the earth is very close to being a sphere, it is more correctly an ellipsoid because it is slightly bulging at the equator due to centrifugal forces. You sometimes hear people say that Copernicus or Galileo proposed that earth was round. This is of course false.
Copernicus’s theory of the solar system, the heliocentric model, proposed that the Sun is at the center of the solar system and the Earth, along with other planets, revolve around it. This was not a well-known fact at the time, unlike the fact that the earth is round. Galileo defended Copernicus theory. The famous alleged quote “And yet it moves” / “E pur si muove” is said to have originated from his argument with the church (however, this is not certain).
So, we know that people knew that earth was round thousands of years before Columbus, and thousands of years before the renaissance, and we know that Columbus did not sail west to prove that earth was round, and he certainly did not prove it. Yet I’ve heard this claim quite often, which is why I consider that earth being round being well known long before Columbus a super fact. Too few people believe earth to be flat like a pancake for me to consider earth being round a super fact.
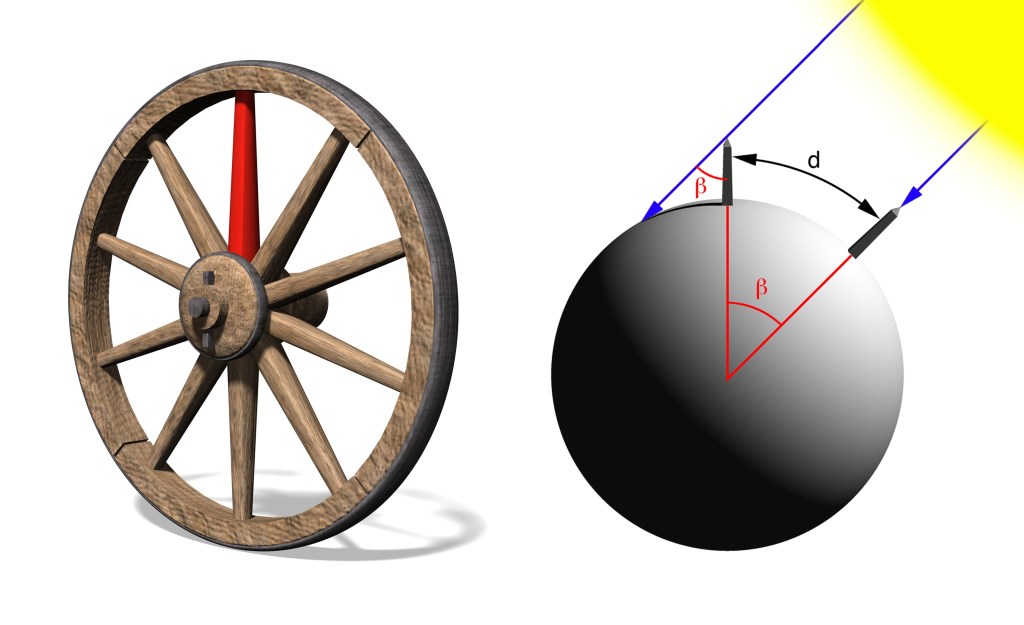
Eratosthenes Calculates the Circumference of Earth
Around 500 BC (2,500 years ago) most Greeks believed that the Earth was round, but they did not know how big it was. The Greek philosopher and mathematician Eratosthenes devised a clever method of estimating its circumference and he got very close. He had heard from travelers about a well in Syene (now Aswan) that at noon on the summer solstice, about June 21 every year, the sun illuminated the entire bottom of a well, without casting any shadows, indicating that the sun was directly overhead. He had also heard that perfectly vertical poles had no shadows at this time.
The reason for this was that Syene/Aswan is located very close to the tropic of Cancer (23.5 degrees versus 24 degrees, or about 60 miles).
In Alexandria, north of Syene, the sun was not directly overhead on the summer solstice. Eratosthenes measured the angle of a shadow cast by a stick at noon on the summer solstice in Alexandria and found it to be 7.2 degrees. Using the distance from Alexandria to Syene and this angle Eratosthenes calculated earth’s circumference to be between 40,250 to 45,900 kilometers. Earth’s circumference is 40,075 kilometers.
Illustration of the measurement of the Earth circumference by Eratosthenes. On June 21st there is no shadow in Syene/Aswan but there is one in Alexandria. Asset id: 2319651251 by Javier Jaime
Resurgence in Flat Earth Beliefs
While very few people believed the Earth was flat 50 years ago, there has been a recent rise in Flat Earth conspiracy theories, largely fueled by online misinformation. Now a day 2% of Americans aged 18-24 years old firmly believe it is flat. That is despite the fact that it is easy to directly observe earth’s round shape. That is a small minority but why would anyone believe such a thing today.
For example, on a flat Earth, a Sun that shines in all directions would illuminate the entire surface at the same time, and all places would experience sunrise and sunset at the horizon at about the same time. With a spherical Earth, half the planet is in daylight at any given time and the other half experiences nighttime. Well just give someone overseas a phone call and you’ll see what the case is. In addition, different places have different amounts of daylight at the same time, which wouldn’t happen with a flat earth.
You can observe the round shape from an airplane. If you stand on a hill by the coast, you can see ships disappearing over the horizon hull first, and you can see earth’s round shadow cast on the moon during lunar eclipses. If you travel far, you can see the constellations and the stars being in different positions in the sky. The southern and northern hemisphere have completely different constellations.
Never mind Eratosthenes, gravity, the Coriolis force, other celestial bodies being round, eyewitness accounts by astronauts, ring-laser gyroscopes, and Foucault pendulums. The moon shows the same face to everyone on earth, which would not be possible if earth was flat. Also never mind NASA photos and the fact that no one has found the earth’s edge.
Below is a youTube video showing an animation composed of actual satellite photos by NASA. Earth is obviously round in this video.
In this video the near side of the moon is dark and what you see is the far side. The far side looks a little bit different from the near side of the moon. It is a new moon and the people on earth don’t see the moon. The sun is behind us and lights up both earth and the far side of the moon (this side people on earth do not see). Also, since there is daylight, the camera does not capture faint objects such as stars.