What is Climate Capitalism

The goal of this blog is to create a list of what I call super facts. Super facts are important and true facts that nevertheless are surprising to a lot of people, mind-blowing, or misunderstood or disputed among non-experts. They are special facts that we all can learn something important from.

However, I also make posts that are not super facts but feature other interesting information, such as this book review and book recommendation. The book is:

Climate Capitalism: Winning the Race to Zero Emissions and Solving the Crisis of Our Age by Akshat Rathi

I should say that I am part of a book club and we recently read two books “This Changes Everything: Capitalism vs. The Climate by Naomi Klein” as well as “Climate Capitalism: Winning the Race to Zero Emissions and Solving the Crisis of Our Age by Akshat Rathi”. They were supposed to be contrasts.

Naomi Klein’s book was anti-capitalism and Akshat Rathi’s book was pro-capitalism, or rather pro-climate-capitalism, meaning a type of capitalism that takes into consideration that polluting the atmosphere for everyone should not be without any type of cost to the polluter. I liked Akshat Rathi’s book, but I had a hard time with Naomi Klein’s book because I found it to be very ideological, filled with strong opinions I could not agree with, a lot of misinformation, and it was very pessimistic and negative. I gave it two stars and wrote a detailed review on Amazon as to why. However, I am not publishing that review here. You can read my Amazon review for Naomi Klein’s book This Changes Everything by clicking here.

The book I am reviewing here is Climate Capitalism: Winning the Race to Zero Emissions and Solving the Crisis of Our Age by Akshat Rathi.

Below I am listing the four versions of this book. I bought the hardback version.

  • Hardback –  Publisher : Greystone Books (March 12, 2024), ISBN-10 : 1778401856, ISBN-13 : 978-1778401855, 272 pages, item weight : 1.05 pounds, dimensions : 6 x 0.9 x 9 inches. It costs $13.84 on US Amazon. Click here to order it from Amazon.com.
  • Paperback –  Publisher : John Murray (June 20, 2024), ISBN-10 : 1529329949, ISBN-13 : 978-1529329940, 272 pages, item weight : 6.8 ounces, dimensions : 5.04 x 1.1 x 7.72 inches. It costs $ 12.69 on US Amazon. Click here to order it from Amazon.com.
  • Kindle –  Publisher : Greystone Books (March 12, 2024), ASIN : B0CHH9KQ23, 253 pages, it costs $13.15 on US Amazon. Click here to order it from Amazon.com.
  • Audiobook – Publisher : Tantor Media (April 16, 2024), ASIN : B0CZYVNYDC, Listening length : 7 hours and 50 minutes. $0.00 with membership. Click here to order it from Amazon.com.
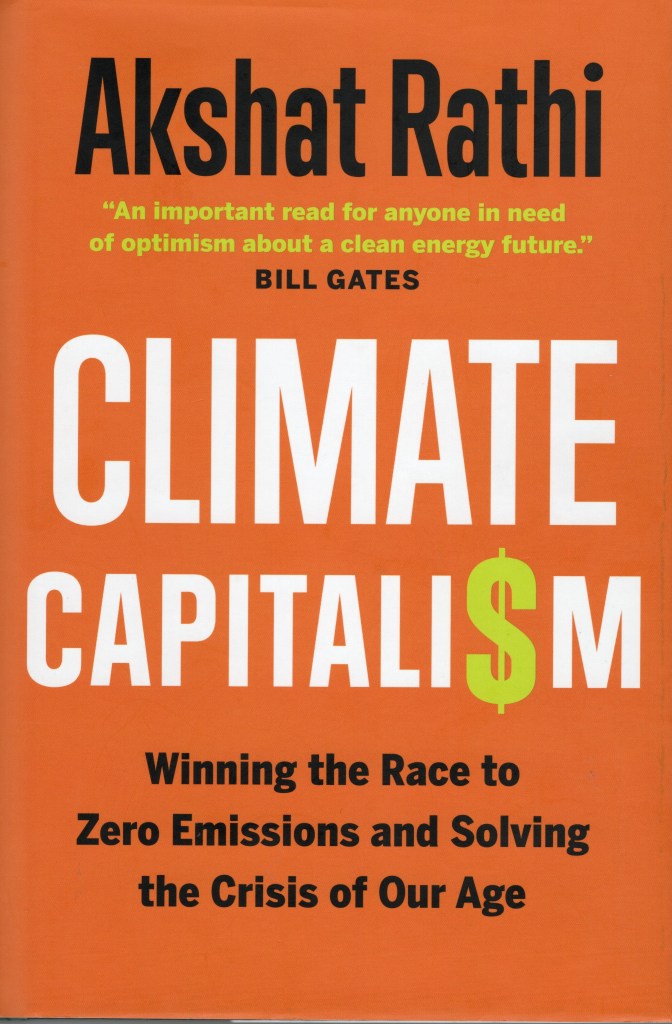
The front cover of Climate Capitalism: Winning the Race to Zero Emissions and Solving the Crisis of Our Age by Akshat Rathi
The front cover of Climate Capitalism: Winning the Race to Zero Emissions and Solving the Crisis of Our Age by Akshat Rathi. Click on the image to go to the Amazon page for the hardback version of the book.

Amazon’s Description of the Book

“An important read for anyone in need of optimism about our ability to build a clean energy future.”—BILL GATES

“Illuminating, incisive, and deeply reported.”—DAVID WALLACE-WELLS, New York Times-bestselling author of The Uninhabitable Earth

Our age will be defined by the climate emergency. Contrary to the doomist narrative that’s taken hold about the climate emergency, the world has already begun deploying the solutions needed to deal with it. On a journey across five continents, Climate Capitalism tracks the unlikely heroes driving the fight against climate change. From the Chinese bureaucrat who did more to make electric cars a reality than Elon Musk, to the Danish students who helped to build the world’s longest-operating wind turbine, or the American oil executive building the technology that can reverse climate damages, we meet the people working to scale technologies that are finally able to bend the emissions curve.

Through stories that bring people, policy and technology together, Akshat Rathi reveals how the green economy is not only possible, but profitable. This inspiring blend of business, science, and history provides the framework for ensuring that future generations can live in prosperity and that the wheels of progress don’t falter.

This is my five star review for the book Climate Capitalism

Climate Capitalism

Blaming capitalism for climate change is simplistic. Capitalism and the “free market” work within a framework of laws. If there were no laws and everyone could just steal and kill each other, you would have miserable anarchy not a free market. However, the market could be framed by different kinds of laws and regulation. In other words, it can come in different flavors.

The book talks about “economic externalities”. A negative externality is when economic activity harms society. An example is pollution and climate change. Is the free market really “free” or “functional” if people are harmed by the economic activity of others? However, you can correct climate change related market failures, for example, by putting a price on carbon. Innovation and technological developments have been crucial in taking us in the right direction toward solving the climate change problem, and so have markets of scale, competition in the market, good policy and the right type of regulated capitalism. This book argues for what the author calls climate capitalism.

The book features a lot of enlightening and inspirational stories about innovators and business leaders who have accomplished amazing feats that are bringing us closer to solving the climate crisis. Wan Gang, a Chinese inventor, business leader, and official who got the Chinese Electric Vehicle revolution going, like Elon Musk did in the West. Sinha, the Indian entrepreneur and the success of solar power. Birol, the Turkish politicians fighting for clean energy and thereby addressing the two biggest challenges of the century: climate change and access to energy for all.

He tells us about Bill Gates efforts to use business and philanthropy to address climate change. He discusses the promise (and disappointments) of carbon capture and storage. The amazing success of a Danish fossil fuel company evolving into a renewable energy company. He tells us about Capitalists buying and selling shares in a smart way to direct the actions of companies, and he explains why plain divestment strategies does not do much to hurt companies fundamental business. There is also a chapter on campaigners and activists. The author states that democracy can be the biggest way to rein in the excesses of capitalism.

He also tells us about fossil fuel companies that behaved very badly. The oil industry knew about the link between fossil fuel burning and global warming as far back as 1959 but chose to hide it and spread misinformation about climate change. In 1989 the fossil fuel industry formed the Global Climate Coalition, GCC, only a few months after the UN had established the Intergovernmental Panel on Climate Change (IPCC).

The five leading oil companies in the GCC, ExxonMobil, BP, Chevron, Shell, and ConocoPhillips publicly spent at least 3.6 billion dollars on advertising and 2 billion dollars on government lobbying (in reality a lot more). Even though all oil companies have since accepted the overwhelming science of climate change and the role fossil fuels play in it, many haven’t quite accepted the changes that will be needed to truly tackle the problem. And the misinformation they spread still lives on.

In summary, the book contains a lot of interesting information that is both frustrating and hopeful. A lot of things have gone wrong, and a lot of things are going wrong, but we are beginning to turn things around. The recent astonishing worldwide success of renewable energy and EVs and the fact that a lot of countries, especially developed countries, have succeeded in significantly lowering their emissions while growing their economies, is a sign of that. The book is also captivating and easy to read, and it is well organized. Akshat Rathi is clearly a great author. I highly recommend this interesting, optimistic and fun read.
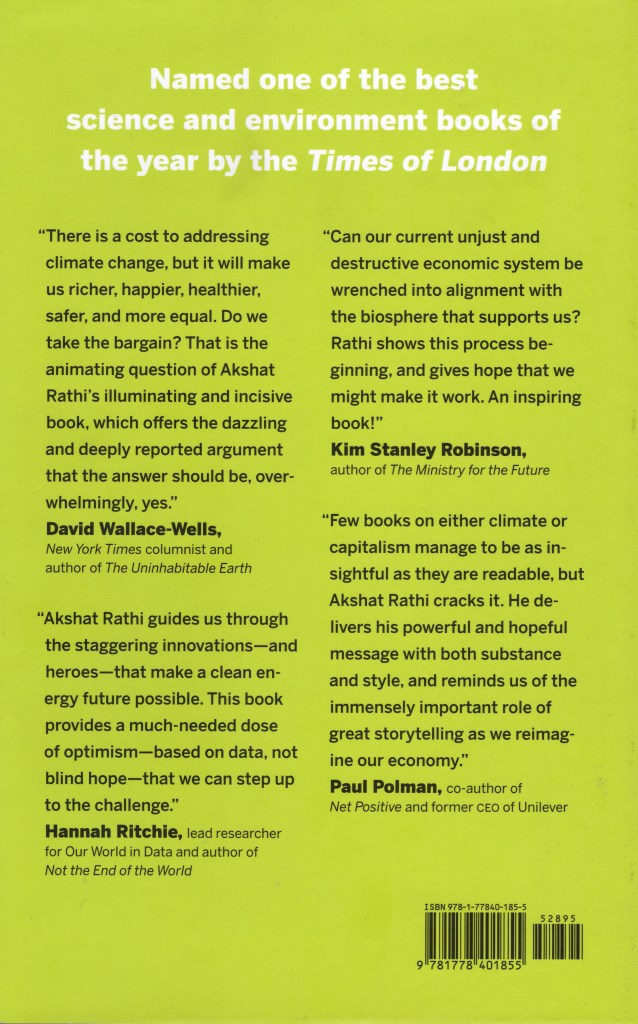
Praise For Climate Capitalism: Winning the Race to Zero Emissions and Solving the Crisis of Our Age by Akshat Rathi
The back cover of Climate Capitalism: Winning the Race to Zero Emissions and Solving the Crisis of Our Age by Akshat Rathi. Click on the image to go to the Amazon page for the paperback version of the book.


To see the Super Facts click here

Super Rich

Superfact 120: The amount of wealth owned by the billionaires is roughly double as much as the poorest half of the world’s population. The amount of wealth owned by the 12 richest billionaires is more than the wealth of the poorest 50% of the world’s population. The richest 1% of the global population owns approximately 38% to 45% of the world’s total wealth.

Esther’s writing prompt: July 15th : Rich

Click here or here  to join in.

A one hundred US Dollar bill sailing through a cloudy sky. | Super Rich
US 100 dollar bills falling through the air Shutterstock Asset id: 2555911235 by Caito

There are at the moment of this writing 3,428 dollar billionaires in the world worth 20.1 trillion dollars together. For comparison the poorest 50% of the world’s population holds between $9 trillion to $12 trillion dollars of wealth (about half). According to this report the amount of wealth owned by the poorest half of the world is less than the amount owned by just the 12 richest billionaires. By the time you read this the numbers have probably changed (likely upwards). You can also read more in Wikipedia.

I am specifying that it is in dollars and not let’s say in the Iranian Rial. With respect to the Iranian Rial, I am also a billionaire, and you are probably too (if you own a phone or computer). One dollar can buy roughly 1,300,000 to 1,600,000 IRR. You just need $700 to be a billionaire in the Iranian Rial.

This is a bar graph showing the number of billionaires and combined wealth starting in 2013 and ending in 2026.
World’s billionaires. Number and total wealth by year. Trillions of dollars. The graph comes from here. <<Link-6>> Katharina Buchholz. Cropped and edited by User:Timeshifter using freeware IrfanView., Public domain, via Wikimedia Commons.

I should say that initially I was just going to list interesting statistics about the super-rich. However, I found myself surprised by the statistics, and I am sure I am not the only one. Therefore, I picked a couple of facts I decided super facts.

The ten richest billionaires in the World

The numbers below are from Forbes Magazine. To see a list of all billionaires in the world, click here. To see a list with numbers that are updated minute by minute, click here.

  • Elon Musk – 839 billion dollars – source Tesla, SpaceX
  • Larry Page – 257 billion dollars – source Google
  • Sergey Brin – 237 billion dollars – source Google
  • Jeff Bezos – 224 billion dollars – source Amazon
  • Mark Zuckerberg – 222 billion dollars – source Facebook
  • Larry Ellison – 190 billion dollars – source Oracle
  • Bernard Arnault & family – 171 billion dollars – source LVMH
  • Jensen Huang – 154 billion dollars – semiconductors
  • Warren Buffet – 149 billion dollars – source Berkshire Hathaway
  • Amancio Ortega – 148 billion dollars – source Zara

Wealth share of the richest 1%

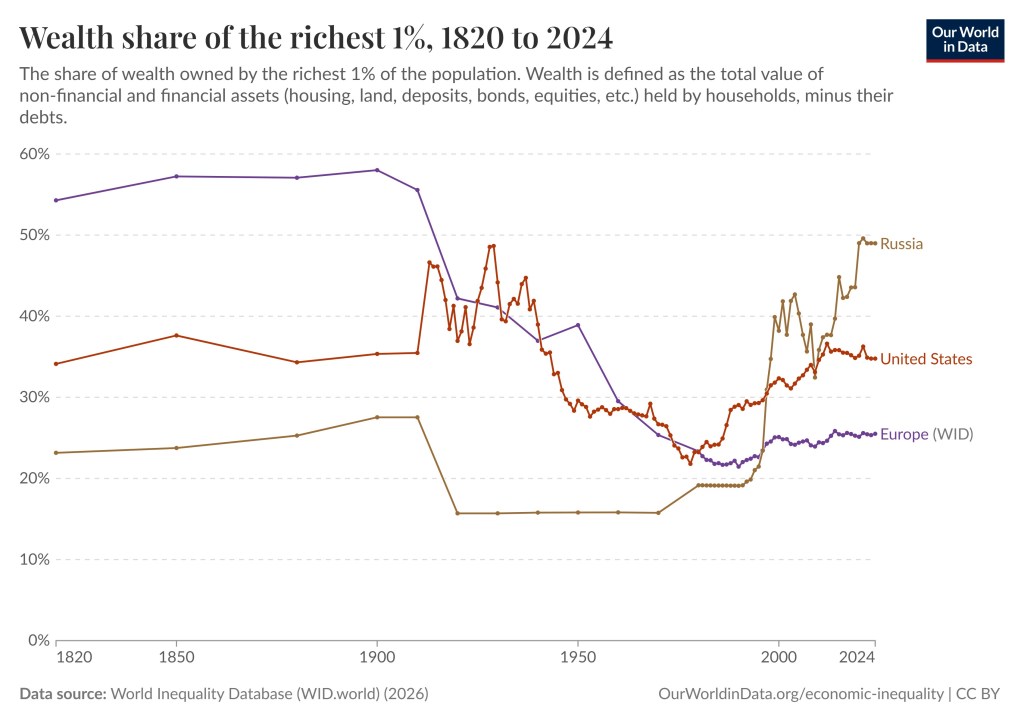
The richest 1% of the global population owns approximately 38% to 45% of the world’s total wealth, which is more than what 95% of humanity own according to Oxfam. The richest 1% of the global population is not about billionaires, it may very well include you and me. Our World in Data has collected and analyzed the statistics for each country in the world. The top richest 1% in the United States own 34.78% of the wealth in the United States. The top richest 1% in Russia own 48.99% of the wealth in Russia. The top richest 1% in Sweden own 27.49% of the wealth in Sweden. The top richest 1% in the Netherlands own 13.98% of the wealth in the Netherlands. See the graphs below from Our World in Data.

This is a world map showing the share of wealth owned by the richest 1% of the population in each country. The darker the color, the greater the wealth of the 1% in that country. | Super Rich
The share of wealth owned by the richest 1% of the population. Wealth is defined as the total value of non-financial and financial assets (housing, land, deposits, bonds, equities, etc.) held by households, minus their debts. Data source: World Inequality Database (WID.world) (2026) – Learn more about this data OurWorldinData.org/economic-inequality | CC BY

As you can see from the graphs below the extreme inequality is nothing new. Europe was extremely unequal in the 19th century. The 1% owned 58.01% of the wealth in 1900. The United States was relatively equal in 1978 when the 1% owned 21.79% of the wealth. Russia became very unequal since 1995. I suggest that you play around with the graphs yourself .

The graphs show the share of wealth owned by the 1% for Russia, Europe and the United States from 1820 to 2024.
The historic share of wealth owned by the 1% for different countries around the world, starting in 1820. Data source: World Inequality Database (WID.world) (2026) – Learn more about this data OurWorldinData.org/economic-inequality | CC BY

ABBA’s Money, Money, Money

Note: This post is not an implicit suggestion that we should tax billionaires more or less, and not about how or whether we should solve inequality, and it is not about politics. It is just surprising statistics regarding wealth and the reality of inequality.

My Other Responses to Esther’s Prompts


To see the Other Super Facts click here

College Tuition Tripled in 25 years

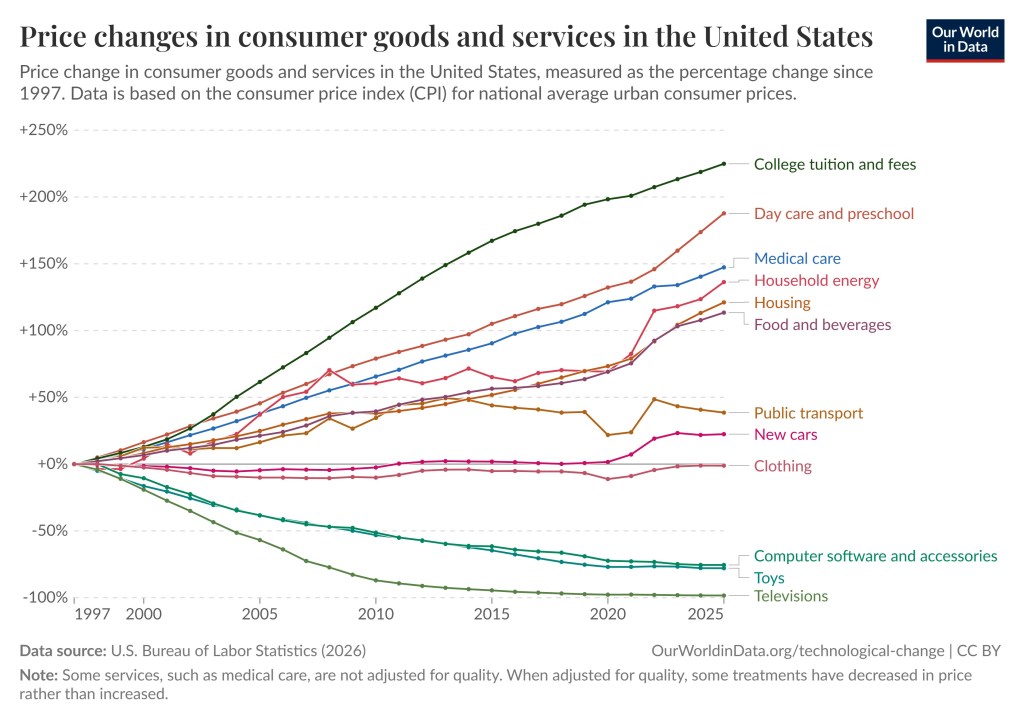
Super fact 92 : College tuition and fees increased by 207% between 1997 and 2022, which corresponds to a tripling.  Since 2022 it has continued to increase. Adjusted for inflation this corresponds to a 60% increase, more than any other major economic sector.

A man is being sucked into a hole filled with money. | College Tuition Tripled in 25 years
Students are sucked into a hole with money for college tuition. Shutterstock Asset id: 335014478 by alphaspirit.it.
The graph shows the percentage increase of college tuition and fees, Day care and preschool, medical care. Household energy, Housing, Food and beverages, public transport, new cars, Clothing, Computer software and accessories, toys, Televisions.
Data source: US Bureau of Labor Statistics (2026). OurWorldInData.org/technological-change. Note: Some services such as medical care are not adjusted for quality, some treatments have decreased in price rather than increased. To visit the original page for this graph click here or on the picture.

To read about the graph above in greater detail click here. To read more about the increase in college tuition click here, here, here, or here. To calculate the inflation for different periods of time click here (the inflation calculator).

It should be noted in the graphs above that Televisions have decreased in price by 98%, which seems implausible. However, it is not an April 1st joke. It is not April 1st in Texas yet (where I live). The reason for the large decline in price of Televisions is that quality is taken into account. 20 years ago, you could not easily buy the kind of TVs you can today and if you did you would cost you an enormous amount of money. You get a lot more for a few hundred bucks than you did 20 years ago.

This is a superfact because it is true, shocking, and important to how we live.

Why have college Tuition become so expensive?

College tuition has increased so much due to administrative bloat, increased student loan availability, declining state funding for public institutions, and heavy spending on amenities to attract students.

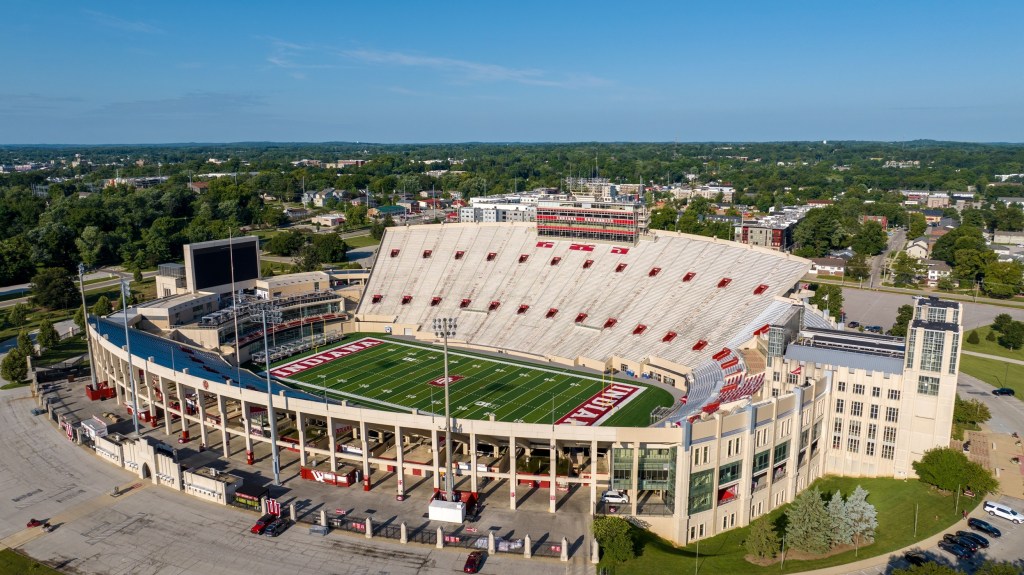
An example of heavy spending on amenities is college sports. I studied at a university called Uppsala University, which is a very large University founded in 1477. It is considered one of the world’s top Universities (top 50). However, they do not have any competitive teams associated with the University itself. In 1987 I was sent as an exchange student (electrical engineering) to Case Western Reserve University, in Cleveland, Ohio. Case Western Reserve University has some competitive teams associated with the University but only a small college football stadium.

However, I quickly came to realize that many American universities have huge college football and baseball stadiums. This is an added expense that you rarely encounter in the rest of the world. Universities are for studies and for learning. Sports teams, whether it is soccer, or American football is a separate issue.

Aerial photo of a large football stadium. | College Tuition Tripled in 25 years
BLOOMINGTON, US – Aug 04, 2025: Side-angle drone view of Indiana University Memorial Stadium with field, stands, and cityscape on a clear summer day. . – Shutterstock Asset id: 2700467103


To see the other Super Facts click here

US National Debt is Ballooning

Super fact 76 : The current US national debt is a record 38.35 trillion dollars and growing despite it being peacetime and no recession. The expected GDP for 2025 is 30.6 trillion, which corresponds to a debt to GDP Ratio of 125 percent.

Hole that sucks a businessman and money | US National Debt is Ballooning
We are drowning in debt. Shutterstock Asset id: 335014478 by alphaspirit.it.

The federal government needs to borrow money to pay its bills when its ongoing spending activities and investments cannot be funded by federal revenues alone. That the national debt is growing in terms of dollars may not be shocking. There is inflation, the country is growing, and as the economy grows its ability to pay the debt increases. Therefore, the debt to GDP Ratio is a better measurement of the size of the problem as this metric relates to our ability to pay the debt back. When the debt to GDP Ratio is growing there is a real problem.

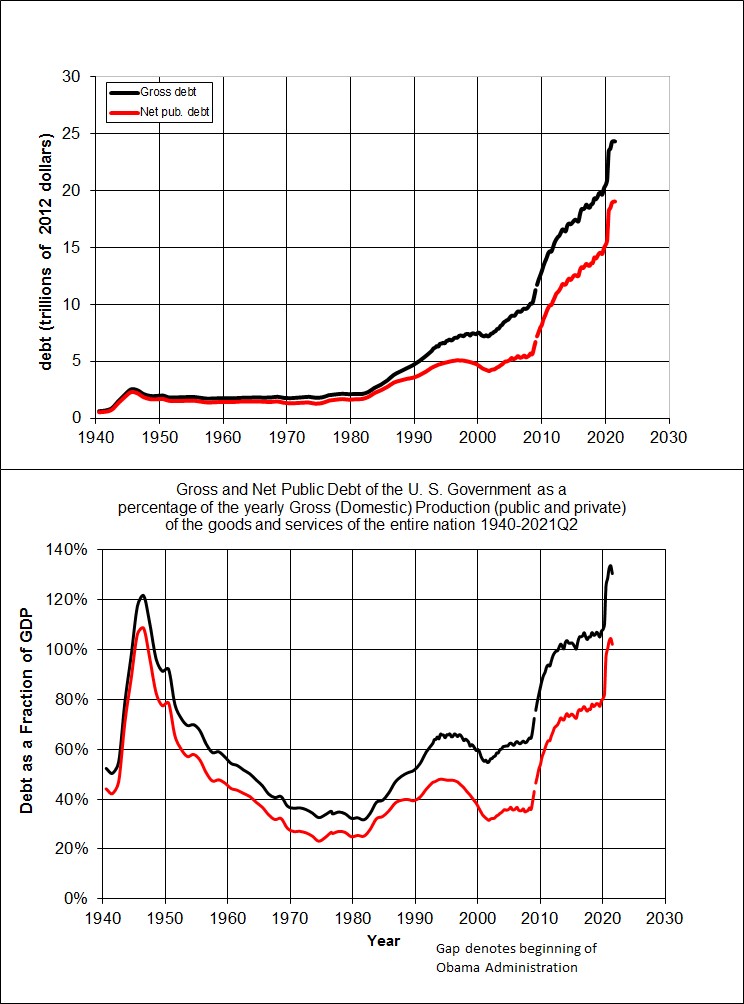
Wars and recessions tend to add to the federal debt. While debt spikes during crises, it historically receded after. The second World War is an example (see below). However, since 1980 US debt has grown without seeming to come back down. Not only does the current debt to GDP Ratio exceed the one after the Second World War, the current trends show persistent deficits even in peacetime, unlike post-WWII, making the long-term outlook scary.

The graph shows two graphs, the US gross public debt and the net public debt as a debt to GDP Ratio. Both graphs show a spike during and after World War II followed by a recovery. Since 1980 the debt started growing again reaching higher than ever levels.
The top panel shows debt deflated to 2010 dollars; the second panel shows debt as a percentage of GDP. The US debt and the US debt to GDP Ratio is at a record high, exceeding that following the Second World War and we aren’t slowing down. Note the gross public debt includes all U.S. government debt, including money it owes itself (Social Security trust fund), while net public debt subtracts the government’s financial assets. The graph is from this Wikipedia article. en:User:O18, CC BY-SA 3.0 <https://creativecommons.org/licenses/by-sa/3.0&gt;, via Wikimedia Commons.

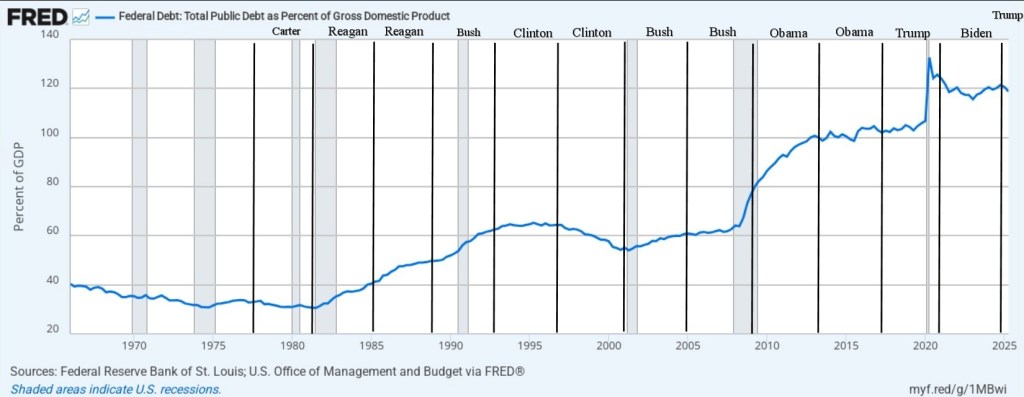
Below is an overview of the Federal Debt as percent of the GDP starting with 1965 to the beginning of 2025. The graph does not include most of the more than 2 trillion increases in debt during 2025, including a 1 trillion increase that happened in just two months toward the end of the year. So at the end there is a missing uptick. The graph below comes from this website.

US National Debt is Ballooning

In the past we used to discuss the national debt and the national deficit a lot, and it was viewed as an important and urgent problem to solve. It was a matter of intergenerational justice. There are some big problems that we have largely solved, for example, the sulfur dioxide pollution that created acid rain has fallen by 95 percent in the US, and the emissions of ozone-depleting gases have fallen by 99 Percent. As a result, we have mostly stopped talking about those problems. However, as the problem with national debt has grown, we have not increased but decreased our attention to the problem. The fact that the debt is now more than 38 trillion dollars, or $112,000 per person in US, and keeps rising despite no wars or recessions happening is probably a shock to many. It is true, it is an important fact, and it is surprising and perhaps shocking and therefore it is a super fact. To read more about the national debt click here.

Debt to GDP Presidents

One might be curious as to how the debt changed during specific Presidencies. I took the graph above and inserted lines representing the starting and ending years for the most recent Presidents. For example, Joe Biden’s Presidency started January 20, 2021, and ended January 20, 2025. I might not have gotten it exactly right so don’t read too much into it.

I added lines for Jimmy Carter, Ronald Reagan, H.W. Bush, Bill Clinton, George W. Bush, Barack Obama, Joe Biden, and Donald Trump.
I added the lines representing Presidents periods.

Below is a table I found online.

PresidentYears in OfficeDebt-to-GDP at StartDebt-to-GDP at EndChange (Percentage Points)
Franklin D. Roosevelt1933–1945~20%~112.9%+92.9 (WWII/Depression)
Harry S. Truman1945–1953112.9%~67.1%-45.8
Dwight D. Eisenhower1953–1961~67.1%~55.2%-11.9
Lyndon B. Johnson1963–1969~46.9%~38.6%-8.3
Jimmy Carter1977–1981~35.8%~32.5%-3.3
Ronald Reagan1981–1989~32.5%~53.1%+20.6
George H.W. Bush1989–1993~53.1%~66.1%+13.0
Bill Clinton1993–2001~66.1%~56.4%-9.7
George W. Bush2001–2009~56.4%~84.2%+27.8 (Wars/Recession)
Barack Obama2009–2017~84.2%~103.6%+19.4 (Great Recession aftermath)
Donald Trump2017–2021~103.6%~132.8% (peak in Q2 2020)+29.2 (Pandemic relief/tax cuts)
Joe Biden2021–Present~132.8% (at start of term, Q2 2020 peak)~124.3% (as of 2024)Fluctuation/slight decrease due to GDP recovery/inflation

Other Types of Debt

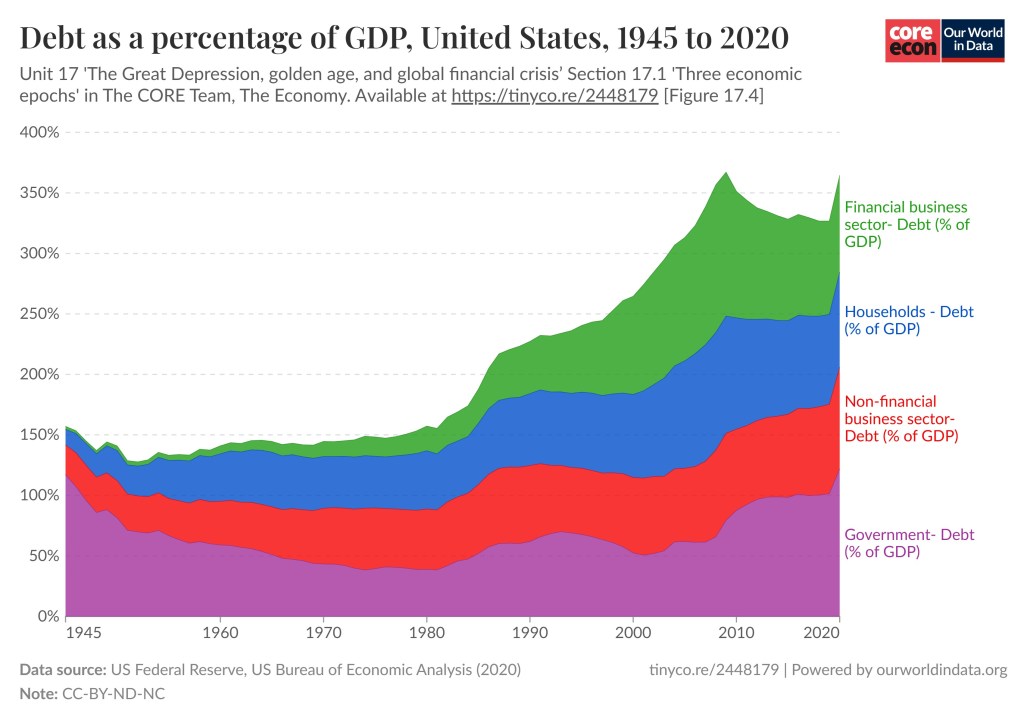
I should add that there are other types of debt not just federal debt / national debt (gross and net). American companies and financial institutions owe money and consumers have debt. As you can see in the graph below the debt to GDP ratio increase is true for those kinds of debts as well. We are a nation in debt. To read more about the graph below click here.

The graph shows four graphs representing Government (% of GDP) in purple, non-financial business sector-Debt (% of GDP) in red, Household - Debt (% of GDP) in blue, financial business sector (% of GDP) in green.
Debt as a percentage of GDP, United States, 1945 to 2020. Data source: US Federal Reserve, US Bureau of Economic Analysis (2020), tinyco.re/2448179 | Powered by ourWorldindata.org


To see the other Super Facts click here

Ten Money Facts

Esther’s writing prompt: October 15 : Money

Click here or here  to join in.

This is not a super fact but a collection of interesting facts regarding money.

A one hundred US Dollar bill sailing through a cloudy sky | Ten Money Facts
US 100 dollar bills falling through the air Shutterstock Asset id: 2555911235 by Caito

Money is a Shared Fiction, a Myth

Money is a fiction that depends on the trust that we collectively put in it. In his book Sapiens, History Professor Yuval Noah Harari argues that money is a “myth”, or a “shared fiction” because its value is not an objective, physical reality but a collective belief. This imagined order allows for mass cooperation by creating a universally accepted, albeit artificial, medium of exchange that can bridge the gap between strangers who don’t know or trust each other personally. When people cease to believe in the value of money it ceases to have value.

Money is Not the Root of All Evil

The “root of all evil is money” is a common phrase that is a misquote of the biblical verse in 1 Timothy 6:10. According to the King James Version of the Bible it says, “For the love of money is the root of all evil: “. However, this is also not correct because it is a mistranslation. According to the New American Standard Bible – NASB 1995 (NASB1995),  the New Century Version (NCV), the American Standard Version (ASV), the New King James Version (NKJV), the correct translation is “For the love of money is a root of all kinds of evil”. The latter makes a whole lot more sense. Not all evil is because of the love of money, but a lot of it.

The Wealth of the World is 500 Trillion Dollars

The world’s total net wealth in 2025 is estimated to be around 500 trillion, but there are other estimates. More than half of this, $260 trillion, is in stocks and bonds.

The Wealth of the United States is 160 Trillion Dollars

The United States has an estimated total wealth of approximately $160 trillion. The top 50% of the US population own 98% of that wealth. The bottom 50% of the US population owns 2% of that wealth. In Q3 2024, the top 1.3 million had a wealth of 49.2 trillion (31%), the next 65.2 million had a wealth of 106.8 trillion (67%), and the next 66.6 million had a wealth of 3.9 trillion (2%).

The Second Most Important Currency is the Euro

The Euro is the second most important currency after the US Dollar, which is the most important currency for borrowing, lending, and reserves.

US paper money is not paper

US paper mone is not made of paper; it’s a blend of 75% cotton and 25% linen to make it more durable.

Cacao Was Once a Currency

The ancient Aztecs used cacao beans as a form of money. Some Aztec taxes were paid in Cacao, and it was even used to pay workers. A single bean could buy you a tamale, while a few dozen might get you a rabbit.

Cash is Not Very Common

On the topic of digital money, it turns out that only 8% of the world’s currency is actually physical, the rest is online or card transactions.

In God We Trust

In God We Trust” is the official motto of the United States. It was adopted by the U.S. Congress in 1956, replacing E pluribus unum (“Out of many, one”). The first paper money to feature the motto was the one-dollar silver certificate, which entered circulation on October 1, 1957.

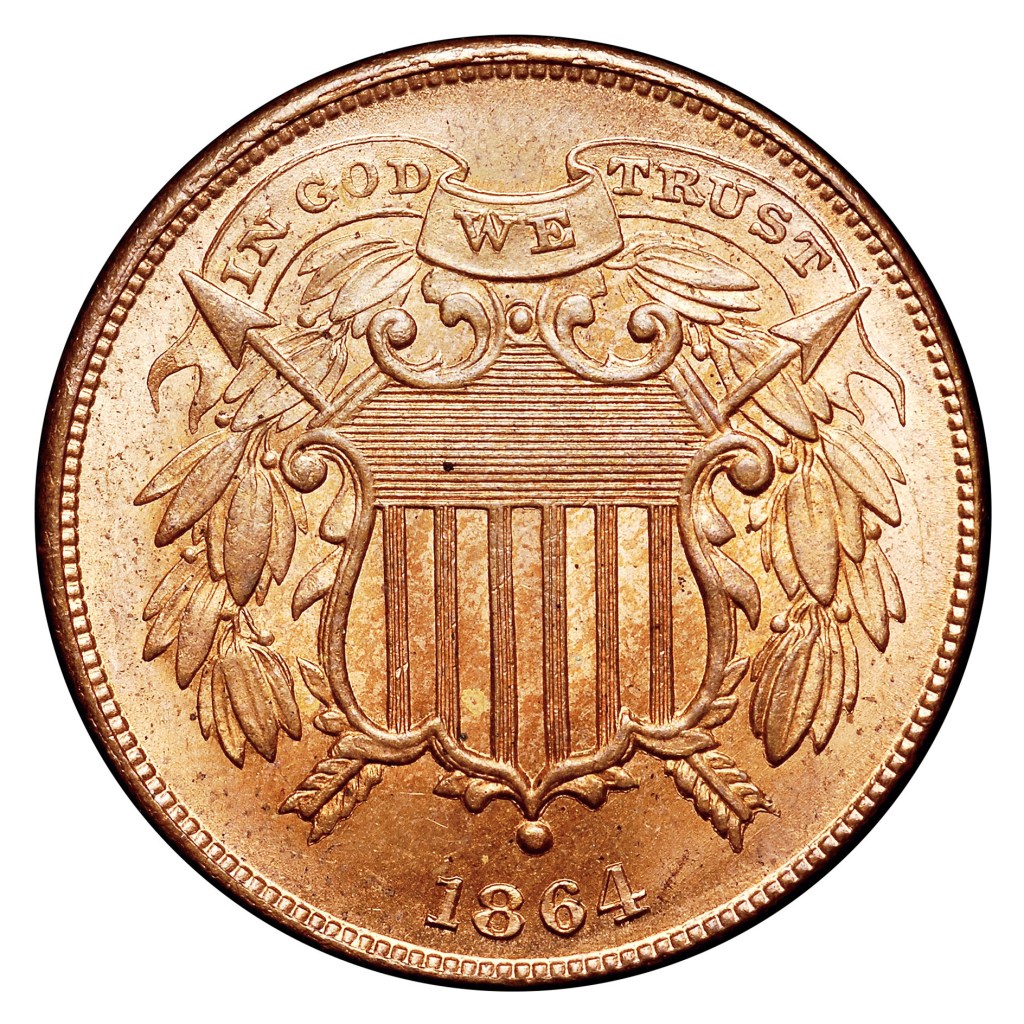
However, that was not the first time “In God We Trust” appeared on American money. “IN GOD WE TRUST” first appeared on the obverse side of the Two-cent piece in 1864.

The backside of a copper colored coin featuring the text “1864” and “IN GOD WE TRUST” | Ten Money Facts
Image courtesy of Heritage Auctions, Public domain, via Wikimedia Commons

US Banknotes Have Multiple Security Features

US banknotes / “paper currency” (along with other currencies) contain security features that can be used to authenticate the banknotes and thereby avoiding accepting counterfeit currency. If you feel the paper (well it is not paper) it should feel slightly rough. All denominations higher than $10 have color shifting ink in the numeral on the lower right corner of the note. On current notes it should change from copper to green. The current style of $100 notes also includes two new security features that you can check by tilting the note: the color shifting in the inkwell and the 3D security ribbon (in the middle across the note). The images of the bells and the text of “100s” should shift as you tilt the note.

In addition, hold the note to light and check the watermark and the security thread that are included on denominations $5 and higher. When held to light the security thread should be visible when held to light. The watermark on a bill should match the portrait of the banknote. The two watermarks on five dollar bills should match the numeral five. The security thread is in a different location for each denomination and glows in a unique color when exposed to UV light. To watch a video explaining how you can check if a bank note is authentic click here or on the YouTube Video below.

If you sort the banknotes or use a machine to check for counterfeiting, there are additional features. The different denominations have a unique magnetic ink signature, as well as a serial number that is unique to each banknote. However, that is for machines and complex systems to discover. The serial number helps in identifying and tracking individual bills.

Me Being a Money Printing Engineer

At one point in my life (2013, 2014, beginning of 2015), I was working for a British company, which at the time was called DeLaRue Cash Systems, now DeLaRue Currency Solutions. DeLaRue Currency Solutions provide more than half of the world’s currencies for a lot of countries around the world. I was working there as a senior software engineer (and electrical engineer) and I was handling and developing the machines that printed banknotes or sorted banknotes. Both of these machines needed to be able to detect the security features described above and therefore they featured various detectors such as cameras, UV lights, magnetic detectors, etc. In the first case to make sure the banknotes were printed correctly and in the second case to check for counterfeit banknotes.

Through my work at DeLaRue I got the opportunity to travel to Great Britain and India. In Great Britain (Gateshead) I visited a banknote printing facility, which when I visited contained huge stacks of banknotes to the value of several billion dollars. Security was pretty tight, and you were not allowed to bring in or out any money. In Bangalore in India, I was introduced to an actress at the Bangalore Palace. My guide told me she was the Jennifer Aniston of India. I looked it up and she was not. Anyway, below is a picture.

Young Indian woman on the left. Me in a yellow T-shirt on the right
Me and allegedly Jennifer Aniston of India, at the Bangalore Palace. They were making a movie at the palace. It was very nice of her to agree to a photo, but my guide’s claim that she was Jennifer Aniston of India was perhaps a slight exaggeration.

Finally, ABBA’s Money, Money, Money


To see the Super Facts click here