Orbital Cycles are not the Cause of the current Global Warming

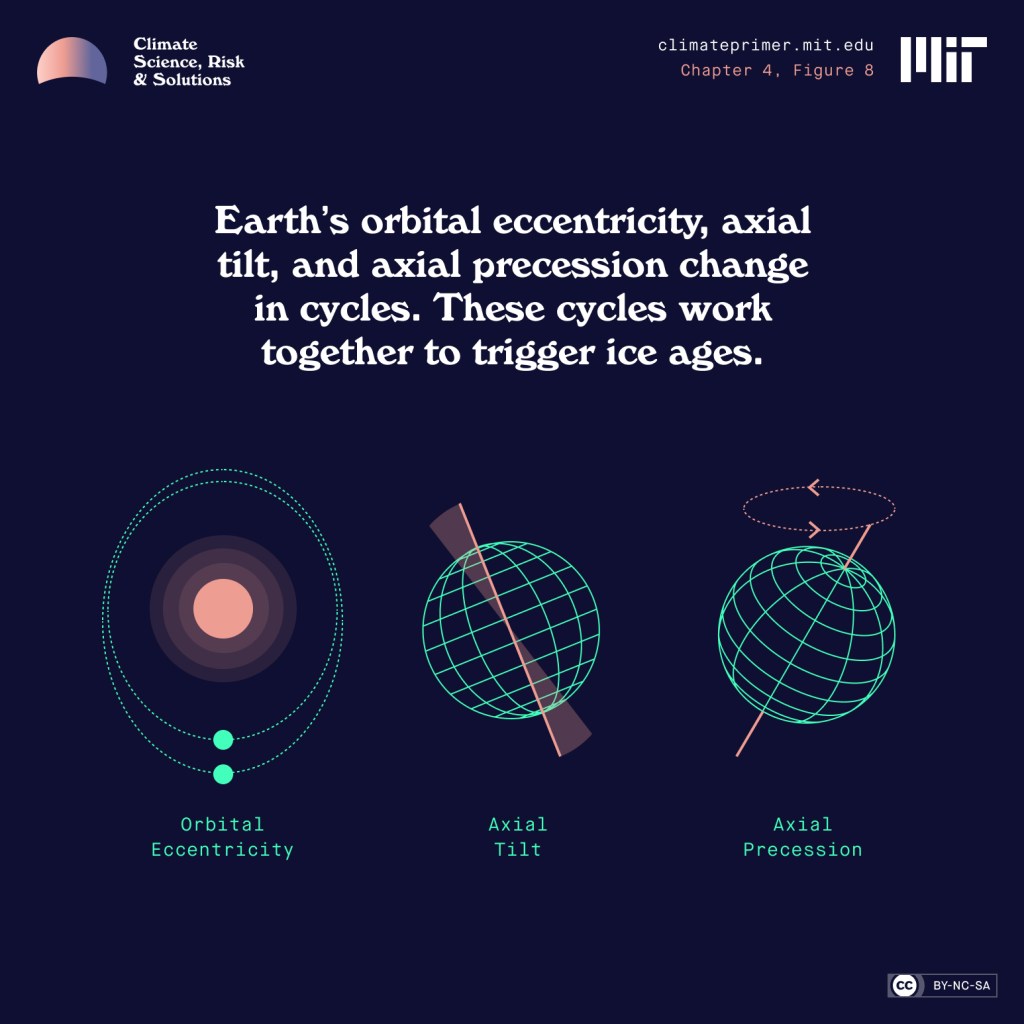
Superfact 122: We know that the current global warming, or if you call it Climate Change, or Climate Disruption, is caused by us primarily because of our burning of fossil fuels. It is not “natural causes”, and it is not orbital cycles, so called Milankovitch cycles. These orbital cycles include changes in orbital eccentricity, axial tilt, and axial precession.

Three illustrated orbital cycles. On the left orbital eccentricity, in the middle is the axial tilt and on the right axial precession.
Illustration of Milankovitch cycles from MIT’s Climate Primer.

The evidence that the current rapid global warming is chiefly caused by our burning of fossil fuels is extensive and for all practical purposes conclusive. One of the steps towards understanding this evidence is understanding why no known natural cause of climate change can explain the current warming, and that includes orbital cycles. Therefore, this post is just one small step towards preparing you for the evidence that the current rapid global warming is chiefly caused by us. However, there is a lot of disinformation around this specific topic.

Hockey stick curve going back 1,000 years. The recent uptick in global temperature is very sharp and very sudden.
The so-called hockey stick curve depicting the last 1,000 years. The blue line is the first hockey stick curve ever created (by Michael Mann). He used proxy measurements such as tree rings, green-dots 30-year average, red temperature measurements. Wikimedia commons <<https://creativecommons.org/licenses/by-sa/4.0/deed.en>>. This graph is taken from this page.
Again, hockey stick curve going back 1,000 years. This time human causes and natural causes are indicated with a black respective a red shape.
The so-called hockey stick curve depicting the last 1,000 years. In this graph I have indicated what part of the graph is climate change caused by natural causes respective climate change caused by human causes.

Very briefly; Earth’s orbital cycles, called the Milankovitch cycles are largely responsible for the ice ages, but they are not responsible for the current warming because the current warming is too rapid for the orbital cycles to be the cause, and the way the warming is happening is incompatible with how a warming caused by Milankovitch cycles would have happened. In addition, according to the Milankovitch cycles we should be cooling, not warming.

I am considering this a super fact because a lot of people have been fooled by the disinformation on this topic, and there is also a lot of gaslighting from less than reputable organizations and from politicians. They have bamboozled a lot of people. About 15 years ago, I was bamboozled by the disinformation myself. That was before I took the time to try to understand the topic. Understanding a topic, and understanding the evidence makes all the difference, and that is why climate scientists are near unanimous the world over that climate change / global warming is both real and caused by us.

Ask yourself, why would the climate scientists and the atmospheric physicists around the world, including scientists at NASA and NOAA, not investigate orbital cycles and other natural causes for climate change as a possible cause for our current warming? They are the experts on orbital cycles and past climate after all. We know that orbital cycles are not the cause of the current global warming, and this is important to know. Therefore, I think it is a super fact.

What Are Orbital Cycles?

One type of important type of climate forcing that’s been the cause behind the multiple ice ages that we’ve had over the last two million years are earth’s orbital cycles, or the Milankovitch cycles. There are primarily three orbital cycles, orbital eccentricity, change in axial tilt, and axial precession. Could they explain the current warming? No, they can’t because they are too slow, we are currently in a cycle that should be cooling the planet, and the way orbital cycles would warm the planet if they were responsible for the warming is very different from what we are witnessing.

Changes in Eccentricity

Earth’s orbit is not a perfect circle. Earth’s orbit varies from nearly circular to slightly elliptical and this change can cause climate change. This shift in Earth’s orbit takes place over periods of about 100,000 and 400,000 years. Click on the video from NASA below for an illustration of Earth’s eccentricity.

Changes in Obliquity (Tilt)

The angle Earth’s axis of rotation is tilted as it travels around the Sun is known as obliquity. Obliquity is why Earth has seasons. Over the last million years, it has varied between 22.1 and 24.5 degrees with respect to Earth’s orbital plane. The greater Earth’s axial tilt angle, the more extreme our seasons are. In addition, a larger tilt angle favor periods of deglaciation. The changes of Earth’s obliquity have a period of 41,000 years. Click on the video from NASA below for an illustration of the changes in obliquity.

Axial Precession (Wobble)

Earth wobbles slightly as it rotates, like a slightly off-center spinning top. The axis of Earth’s wobble changes slowly and is called axial precession. The corresponding cycle spans 25,771.5 years, or approximately 26,000 years. Click on the video from NASA below for an illustration of the changes in axial precession.

Video Explaining Earth’s Orbital Cycles

The video below from PBS gives an explanation and overview of earth’s three orbital cycles.


Orbital cycles are far too Slow to Cause the Rapid Global Warming Happening Today

The changes in Earth’s orbit and tilt operate over 20,000+ to 100,000-year periods, making Orbital Cycles unable to drive the sharp temperature spikes seen in a single century.

The graph shows the temperature since the last ice age. There is a maximum temperature about 6,000 years ago, then a cooling and then a sharp uptick in temperature.
Global temperature going back twenty thousand years, a hockey stick graph. Notice the stable temperature during the last 10,000 years, coinciding with the development of human civilization, and also notice the sudden sharp increase at the end. Orbital cycles can’t explain that, and it certainly does not look natural.

Orbital Cycles Predict Slow Cooling, not Rapid Heating

About 6,000 years ago Earth’s temperature was a bit warmer than it is today largely due to the climate fluctuations caused by orbital cycles. The warm period in the beginning of the Holocene epoch is referred to as the Holocene climatic optimum. Natural causes for climate change caused Earth’s temperature to slowly cool off until the recent very sudden uptick in average global temperatures.

Temperature record for the last 150,000 years. Notice the sharp uptick towards the end. This picture is taken from this article.
The graph shows wild swings over the last 50,000 years and then a very sharp uptick at the end, which as indicated in the graph is caused by us.
Temperature record for the last 50,000 years. Notice the sharp uptick towards the end. I have circled natural and human caused causes for the climate change. This picture is taken from this article.

Below is a video that explains in greater detail why orbital cycles cannot explain the current warming. You can also read more about it here.

The Cooling of the Upper Atmosphere Tells Us the Current Warming is not Caused by Orbital Cycles or the Sun

Yes, the cooling of the upper atmosphere (specifically the stratosphere above the troposphere) is a key sign that current global warming is not caused by Milankovitch cycles or changes in the sun. Instead, observations show a warming lower layer (troposphere) and a cooling upper layer, which is the exact “fingerprint” of human-caused greenhouse gases. Other evidence that the warming is caused by greenhouse gases and not orbital cycles or the sun is the distribution of the warming across the globe and over time.

A Couple of Videos

The video below is a short one-minute overview of the causes behind global warming.

The video below from NASA is a bit longer, 13 minutes, but it gives a more detailed overview. Click here to see the page from where this is coming from.


Conclusion

We know that Orbital Cycles are not responsible for the current rapid global warming because Orbital Cycles operate on tens of thousands of years or hundreds of thousands of years, not a couple of centuries.

We know that Orbital Cycles are not responsible for the current rapid global warming because the effects of Orbital Cycles are slowly cooling Earth, not warming it.

We know that Orbital Cycles are not responsible for the current rapid global warming because if it was orbital cycles (or the sun) the upper atmosphere would not be cooling and the temperature increases would be distributed differently across Earth and distributed differently with respect to time.


Other super facts related to global warming


To see the other Super Facts click here

The Mysterious Vanishing of Bronze Age Civilizations

Superfact 121: Between the years 1200BCE and 1150BCE (3,200 years ago) major civilizations in the Mediterranean and Near Eastern civilizations vanished or collapsed completely, notably Mycenaean Greece, the Hittite Empire, the Canaanite city-states, civilizations in eastern Libya, Balkans, and Babylon suffered a severe political decline and eventual fall during the Late Bronze Age collapse. Other civilizations such as the Assyrian empire and Egypt survived the Late Bronze Age collapse but emerged severely weakened.

Green represents the Mycenaean Greece, blue the Hittite Empire, orange the New Kingdom Egypt, and purple the area of conflict between Hittites and Egypt. The various colored arrows depict the various invasions and movements. The red, blue and yellow arrows represent invasions from different Sea Peoples.
Invasions, destruction and population movements during the Late Bronze Age collapse. The red, blue and yellow arrows represent invasions from different Sea Peoples. Alexikoua, CC BY-SA 3.0 https://creativecommons.org/licenses/by-sa/3.0, via Wikimedia Commons.

The Mediterranean and Near Eastern civilizations were powerful, important and wealthy, and their sudden collapse is one of the most consequential and mysterious events in history that ended in a dark age that lasted several hundred years, including the Greek Dark Ages, which lasted from c. 1200 BCE to c. 800 BCE.

Colorful map of 14 century BCE Mediterranean and Near Eastern civilizations including the Mycenaean Greece, Hittite empire, Assyria, Kassite Kingdom, Babylonia, Mittani, Egypt and Elam.
Eastern Mediterranean and the Middle East during the 14th century BC; Mycenaean Greece in purple. Alexikoua,, CC BY-SA 3.0 <https://creativecommons.org/licenses/by-sa/3.0&gt;, via Wikimedia Commons.

The reason for the late Bronze Age collapse is being debated but climate change, droughts, and invasions by the so called Sea Peoples are considered to be major reasons. The Trojan war, which is mostly fiction occurred around 1200 BCE. If you watched the recent 2026 movie the Odyssey, you probably notice the frequent references to the Sea Peoples. One of the Sea Peoples was the Philistines. If you want to take a deep dive into the late Bronze Age collapse, click here, or here.

Most of us know about the collapse of the Roman Empire around 400-500 AD and perhaps the fall of the Byzantine Empire in 1453 AD, but the late Bronze Age collapse may come as surprise to many despite it being so consequential, at least I was very surprised when I first learned about it. It was not just civilization collapsing but many at the same time. The collapse is also mysterious and shrouded in mythology. That is why I consider it a super fact.

The Collapse of Mycenaean Greece

The collapse of Mycenaean Greece stands out. No other part of the Eastern Mediterranean suffered a civilizational setback quite as intense as in Greece. I think most of us are aware that after the Mycenaean Greece came other periods in Greece’s history, the Greek Dark Ages, the Archaic period, and classical and Hellenistic periods, Alexander the Great, Plato, Aristotle, etc.

I learned in school that there was a Dorian invasion of Greece that displaced its original population and this led to the Greek Dark Ages before a rebirth of Greek civilization. This is most likely not true. The Mycenaean Greeks were not replaced by modern Greeks; they were the ancient Greeks. What likely happened was that climate change and drought resulted in crop failures, which in turn resulted in people movements and a range of invading peoples around the Mediterranean and the Near East. This is what may be remembered in Homer’s account of the Trojan War.

Various Mycenaean states in various colors, Athens, Thebes, Orchomenos, Mycenae, Elis, Pylos, Menelaion, Dimini, Kythera, and IoLcos.
Reconstruction of the political landscape in mainland southern Greece, c. 1400–1250 BC. Alexikoua, CC BY-SA 4.0 <https://creativecommons.org/licenses/by-sa/4.0&gt;, via Wikimedia Commons.


To see the Other Super Facts click here

Smorgasbord Blog Magazine Share Superfact 57 – Half the World’s Population Live within a 2 Percent Circle

Imagine my delight when I saw the post above. Sally is sharing my super fact 57: Super fact 57 : Half the World’s Population live within a circle that covers 2% of the world’s surface, or 10% of earth’s land area. This circle is often referred to as the “Valeriepieris Circle” or Yuxi Circle, and it is centered on southeast Asia. In addition, she is promoting my Leonberger dog book for which Robbie wrote a great review. Thank you so much Sally and Robbie. Please hop over to Smorgasbord blog magazine and read it.

Half the World’s Population Live within a 2 Percent Circle

Super Rich

Superfact 120: The amount of wealth owned by the billionaires is roughly double as much as the poorest half of the world’s population. The amount of wealth owned by the 12 richest billionaires is more than the wealth of the poorest 50% of the world’s population. The richest 1% of the global population owns approximately 38% to 45% of the world’s total wealth.

Esther’s writing prompt: July 15th : Rich

Click here or here  to join in.

A one hundred US Dollar bill sailing through a cloudy sky. | Super Rich
US 100 dollar bills falling through the air Shutterstock Asset id: 2555911235 by Caito

There are at the moment of this writing 3,428 dollar billionaires in the world worth 20.1 trillion dollars together. For comparison the poorest 50% of the world’s population holds between $9 trillion to $12 trillion dollars of wealth (about half). According to this report the amount of wealth owned by the poorest half of the world is less than the amount owned by just the 12 richest billionaires. By the time you read this the numbers have probably changed (likely upwards). You can also read more in Wikipedia.

I am specifying that it is in dollars and not let’s say in the Iranian Rial. With respect to the Iranian Rial, I am also a billionaire, and you are probably too (if you own a phone or computer). One dollar can buy roughly 1,300,000 to 1,600,000 IRR. You just need $700 to be a billionaire in the Iranian Rial.

This is a bar graph showing the number of billionaires and combined wealth starting in 2013 and ending in 2026.
World’s billionaires. Number and total wealth by year. Trillions of dollars. The graph comes from here. <<Link-6>> Katharina Buchholz. Cropped and edited by User:Timeshifter using freeware IrfanView., Public domain, via Wikimedia Commons.

I should say that initially I was just going to list interesting statistics about the super-rich. However, I found myself surprised by the statistics, and I am sure I am not the only one. Therefore, I picked a couple of facts I decided super facts.

The ten richest billionaires in the World

The numbers below are from Forbes Magazine. To see a list of all billionaires in the world, click here. To see a list with numbers that are updated minute by minute, click here.

  • Elon Musk – 839 billion dollars – source Tesla, SpaceX
  • Larry Page – 257 billion dollars – source Google
  • Sergey Brin – 237 billion dollars – source Google
  • Jeff Bezos – 224 billion dollars – source Amazon
  • Mark Zuckerberg – 222 billion dollars – source Facebook
  • Larry Ellison – 190 billion dollars – source Oracle
  • Bernard Arnault & family – 171 billion dollars – source LVMH
  • Jensen Huang – 154 billion dollars – semiconductors
  • Warren Buffet – 149 billion dollars – source Berkshire Hathaway
  • Amancio Ortega – 148 billion dollars – source Zara

Wealth share of the richest 1%

The richest 1% of the global population owns approximately 38% to 45% of the world’s total wealth, which is more than what 95% of humanity own according to Oxfam. The richest 1% of the global population is not about billionaires, it may very well include you and me. Our World in Data has collected and analyzed the statistics for each country in the world. The top richest 1% in the United States own 34.78% of the wealth in the United States. The top richest 1% in Russia own 48.99% of the wealth in Russia. The top richest 1% in Sweden own 27.49% of the wealth in Sweden. The top richest 1% in the Netherlands own 13.98% of the wealth in the Netherlands. See the graphs below from Our World in Data.

This is a world map showing the share of wealth owned by the richest 1% of the population in each country. The darker the color, the greater the wealth of the 1% in that country. | Super Rich
The share of wealth owned by the richest 1% of the population. Wealth is defined as the total value of non-financial and financial assets (housing, land, deposits, bonds, equities, etc.) held by households, minus their debts. Data source: World Inequality Database (WID.world) (2026) – Learn more about this data OurWorldinData.org/economic-inequality | CC BY

As you can see from the graphs below the extreme inequality is nothing new. Europe was extremely unequal in the 19th century. The 1% owned 58.01% of the wealth in 1900. The United States was relatively equal in 1978 when the 1% owned 21.79% of the wealth. Russia became very unequal since 1995. I suggest that you play around with the graphs yourself .

The graphs show the share of wealth owned by the 1% for Russia, Europe and the United States from 1820 to 2024.
The historic share of wealth owned by the 1% for different countries around the world, starting in 1820. Data source: World Inequality Database (WID.world) (2026) – Learn more about this data OurWorldinData.org/economic-inequality | CC BY

ABBA’s Money, Money, Money

Note: This post is not an implicit suggestion that we should tax billionaires more or less, and not about how or whether we should solve inequality, and it is not about politics. It is just surprising statistics regarding wealth and the reality of inequality.

My Other Responses to Esther’s Prompts


To see the Other Super Facts click here

High Wet-bulb Temperatures the Mass Killer in Heat Waves

Superfact 119: Heat waves are becoming significantly more frequent, intense, and longer-lasting globally due to human-caused climate change. The combination of a high temperature and humidity can create a high so called wet-bulb temperature that you cannot survive unless you can find a way to cool down. High humidity and heat can make it impossible to cool off through sweating, which rapidly leads to heatstroke. It is estimated that this kills about 500,000 people annually.

A wet-and-dry hygrometer featuring a wet-bulb thermometer. | High Wet-bulb Temperatures the Mass Killer in Heat Waves
A wet-and-dry hygrometer featuring a wet-bulb thermometer. Crossmr, CC BY-SA 3.0 https://creativecommons.org/licenses/by-sa/3.0, via Wikimedia Commons.

Imagine that it is a hot and humid day, but you want to go for a hike for a few hours. It is 104 degrees (40 Celsius) and humid, but you don’t know how humid. You are concerned about the Wet-bulb temperature. You use the Wet Bulb calculator and you find out that a relative humidity of 70% will yield a Wet-bulb temperature of 35 Celsius, which is deadly. You won’t survive that. A relative humidity of 45% will yield a Wet-bulb temperature of 30 Celsius, which is very dangerous but survivable for a healthy person.

How would you find out how big the risk is? The wet-bulb thermometer above is in Japanese and pretty cryptic but Amazon has wet-bulb thermometers that you can easily understand. Here is another one also on Amazon. I promise, I am not trying to sell Web-bulb thermometers for Amazon. I am just pointing out that we may need to start paying attention to Wet-bulb temperatures and perhaps buying these products as heat waves are becoming significantly more frequent, more intense, and longer-lasting due to our burning of fossil fuels.

The graph shows the increased risk for 10-year heavy rains, 10-year droughts, 10-year heat waves and 50-year heat waves at differently increased global average temperatures, +1.0 Celsius, +1.5 Celsius, +2.0 Celsius, +3.0 Celsius, +4.0 Celsius,
Large increases in both the frequency and intensity of extreme weather events (for increasing degrees of global warming) are expected. RCraig09, CC BY-SA 4.0 https://creativecommons.org/licenses/by-sa/4.0, via Wikimedia Commons.

I should say that the Wet-bulb temperature of 95 Fahrenheit / 35 Celsius is more of an upper limit for survivability, like a suicide temperature. Wet bulb temperatures below 35 Celsius can also be very dangerous, at least for some people. As mentioned, excess heat and humidity kill about 500,000 people annually. You can read more here or here.

I was first made aware of the Wet-bulb temperatures when I read a science fiction novel focused on climate change, a so called Cli-Fi novel, the Ministry for the Future by Kim Stanley Robinson. It was a dystopian novel with the premise that 20 million Indians died because the Wet-bulb temperature became deadly in a large area in India, and not many people had air conditioning. Also, animals including wildlife and cattle died because, well obviously they did not have air-conditioning.

What followed was international crises, revenge and terrorism by the survivors against those whom they believed to be most responsible for our global warming / climate change, and desperate geo-engineering solutions to cool the planet. At first, I thought it seemed exaggerated but then I learned that dozens of places have already reached deadly Wet-bulb temperatures. Hopefully, a catastrophe like that will never happen but it is not entirely implausible.

The existence of the Wet-bulb temperature scale was a surprise to me. I knew that if you got locked into a Sauna for a long time you would not survive. Accidents that like that have happened in Sweden where I grew up. I did not know that the same thing could happen at natural temperatures. It made me realize that the more frequent, intense, and longer-lasting heat waves we are experiencing is a serious issue. I consider this to be a super fact because it is a true and important fact that many are unaware of.

What is the wet bulb temperature?

The wet bulb temperature is the lowest temperature to which a body can cool down through the evaporation of water (like sweating). It is measured using a thermometer covered in a water-soaked cloth. Because evaporation absorbs heat, the wet bulb temperature is lower than the actual air (dry bulb) temperature. When it is dry outside, sweat evaporates rapidly, keeping you comfortable. When it is humid, the air is already saturated, making it difficult for sweat to evaporate.

The humidex index, real feel and the wet-bulb all take both temperature and humidity into account, but Wet-bulb is focused on the body’s ability to cool down and is a safety measure. For example, if the Wet-bulb temperature is 28 Celsius then a body hotter than that (a human body is 37 Celsius) can lower the temperature via evaporation (sweating). So, a Wet-bulb temperature of 28 Celsius is not a problem (in that regard).

However, if the Wet-bulb temperature is 37 then the human body cannot use evaporation to cool down. Sweating won’t do anything. You’ll overheat and die. A Wet-bulb temperature of 35 is close enough to 37 for your evaporation system to fail and you’ll die. Basically, humidex is about feel, and Wet bulb about whether the body’s cooling system will work.

Our emissions seemed to have peaked, what is the worry ?

I have stated in other posts that thanks to the expansion of renewable energy our carbon emissions have taken a different path lately and that it looks like our emissions have started to go down, so what is the worry? It is important to understand that the average temperatures are not directly tied to our emissions but to the total amount of greenhouse gases in the atmosphere, for example, CO2 (an important greenhouse gas) leaves the atmosphere very slowly, and any level of excess CO2 emissions will keep accumulating.

Before we humans came along there was a balance, the soil, volcanoes, etc., added CO2 and roughly the same amount left the atmosphere. The so called carbon cycle. Imagine a bathtub with a drain that is slowly emptying water and a faucet adding about the same amount. Then we came along and sped up the faucet. For example, humans add roughly 60 to 100 times more CO2 to the atmosphere each year than all the volcanoes on the planet combined. Note: Our current administration is trying to censor climate science related information from NOAA and NASA, so tell me if the link in the previous sentence has stopped working.

A faucet is filling up a transparent glass bathtub with water, and a drain is emptying it but much slower.
The faucet is adding water to the bathtub faster than the drain is emptying the water, so it keeps filling up. The same is true for the CO2 in our atmosphere. Our emissions correspond to the faucet. I generated this picture with the help of ChatGPT.
Again a faucet is filling up a transparent glass bathtub with water, and a drain is emptying it but much slower. The difference between this picture and the previous is that in this picture the faucet is a bit slower than the faucet in the first picture, but still faster than the drain. | High Wet-bulb Temperatures the Mass Killer in Heat Waves
The faucet is adding water to the bathtub a little bit slower than in the previous picture but still faster than the drain is emptying the water, so the bathtub still keeps filling up, but a little bit slower. That is why the problem with heat waves will keep getting worse despite us doing a little bit better with our emissions. I generated this picture with the help of ChatGPT.

Other Climate Change Related Super facts


To see the Other Super Facts click here