The goal of this blog is to create a long list of facts that are important, not trivia, and that are known to be true yet are either disputed by large segments of the public or highly surprising or misunderstood by many.
Author: thomasstigwikman
My name is Thomas Wikman. I am a software/robotics engineer with a background in physics. I am currently retired. I took early retirement. I am a dog lover, and especially a Leonberger lover, a home brewer, craft beer enthusiast, I’m learning French, and I am an avid reader. I live in Dallas, Texas, but I am originally from Sweden. I am married to Claudia, and we have three children. I have two blogs. The first feature the crazy adventures of our Leonberger Le Bronco von der Löwenhöhle as well as information on Leonbergers. The second blog, superfactful, feature information and facts I think are very interesting. With this blog I would like to create a list of facts that are accepted as true among the experts of the field and yet disputed amongst the public or highly surprising. These facts are special and in lieu of a better word I call them super-facts.
Superfact 11: United States, Europe and the Pacific Ocean Are Bigger Than You Might Think
The area of the United States is around 9,8 million square kilometers
The area of continental United States is around 8.1 million square kilometers
The area of Europe is around 10.2 million square kilometers
Earth’s total land area is 148.9 million square kilometers
The area of the Pacific Ocean is 165.3 million square kilometers
The area of the whole earth is 510 million square kilometers
The United States
The United States is much bigger than many Europeans think. Europe is much bigger than many Americans think. Many of us don’t realize that one of the five oceans, the Pacific Ocean, is one third of earth’s entire surface and cover a larger area than all landmass on earth. Since so many of us are surprised to hear these facts and they are not under dispute among experts, they constitute a super-fact, or a few super-facts in my opinion.
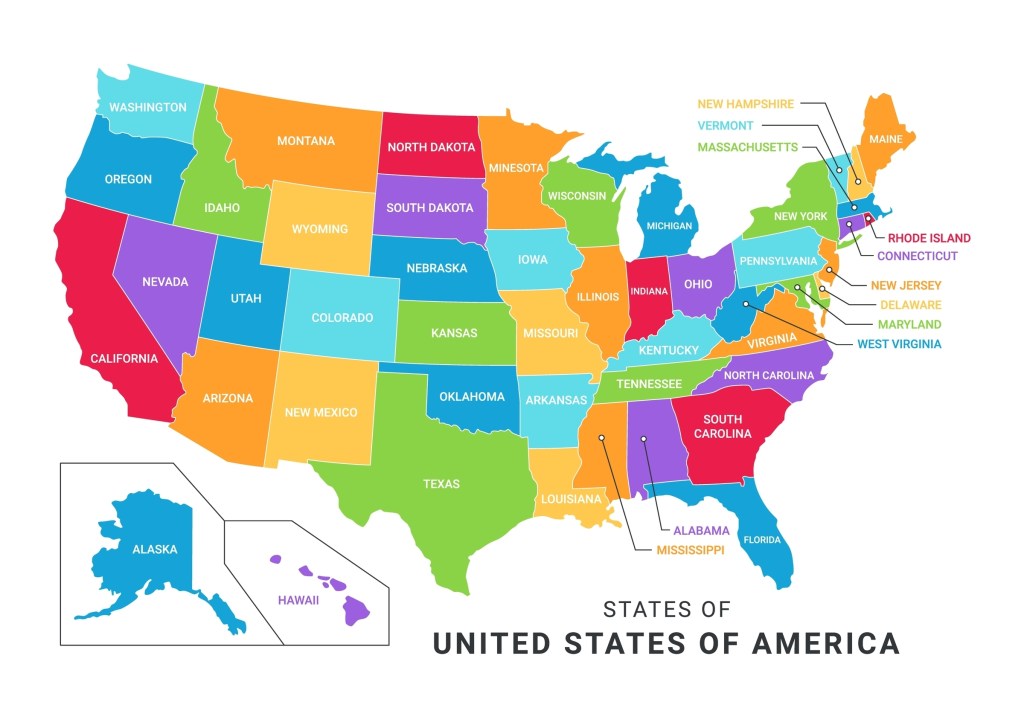
Map of the United States. Alaska and Hawaii are not to scale. Alaska is double as big as Texas. Stock Vector ID: 2247501877 by HazimAlfi.
Some time ago I was talking to a Swedish friend of mine who told me something along the lines of “the United States isn’t so big as they say. We drove through half a dozen states in an afternoon.” I asked her, “which states?” It turns out that was the New England states, Maine, New Hampshire, Massachusetts, Rhode Island, Connecticut, and finally New Jersey and New York (New York city). You can do that drive in an afternoon, but you cannot drive through Texas in an afternoon, not even in a day.
The distance from Texarkana to El Paso is 1,300 kilometers and takes more than 12 hours to drive on the highway without stopping. I’ve come across many Europeans who underestimate the size of the United States. The mistake they make is that they don’t realize that while some US states are small, other states are much bigger. Just look at the map.
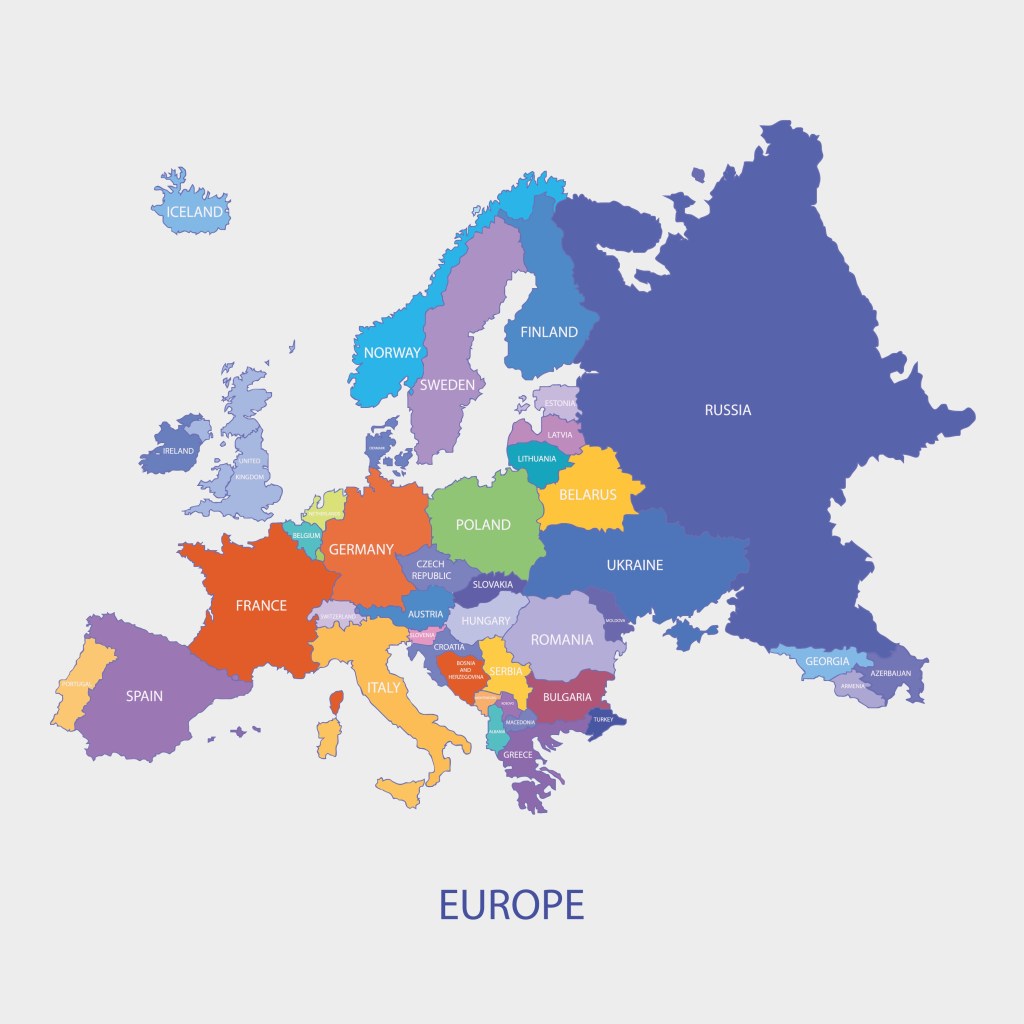
Political map of Europe (including European Russia) Stock Vector ID: 319593110 by okili77.
Europe
Interestingly Americans often make the same mistake about Europe. I quite often hear Americans claim that distances are so small in Europe. You can drive through a country in a couple of hours and the language changes. It’s a trope that seems to be repeated every time Europe is discussed on social networks.
Today, as I was talking to a friend of mine about our recent trip to Sweden and Norway, my friend told me that it was good that distances in Europe were so short so we could easily travel between the places I was telling him about. He was more than surprised to hear that was not the case. The distance between where we were Sweden and Norway was too large for anything other than planes considering we only had 10 days.
The distance from Malmö in southern Sweden to Karesuando in northern Sweden is more than 1,900 kilometers and takes more than 21 hours to drive without stopping. In fact, by area, Sweden is bigger and longer than California.
The Pacific Ocean
Last but not least. Earth has seven continents (Asia, Africa, North America, South America, Antarctica, Europe, and Australia), and five oceans (the Arctic, Atlantic, Indian, Pacific, and Southern (Antarctic) Oceans). But just one ocean, the Pacific Ocean cover a third of earth’s entire surface. This may come as a surprise to many. See the globe photorealistic 3d illustration below.
Earth Pacific Ocean view Stock Illustration ID: 1617553012 by Matis75.
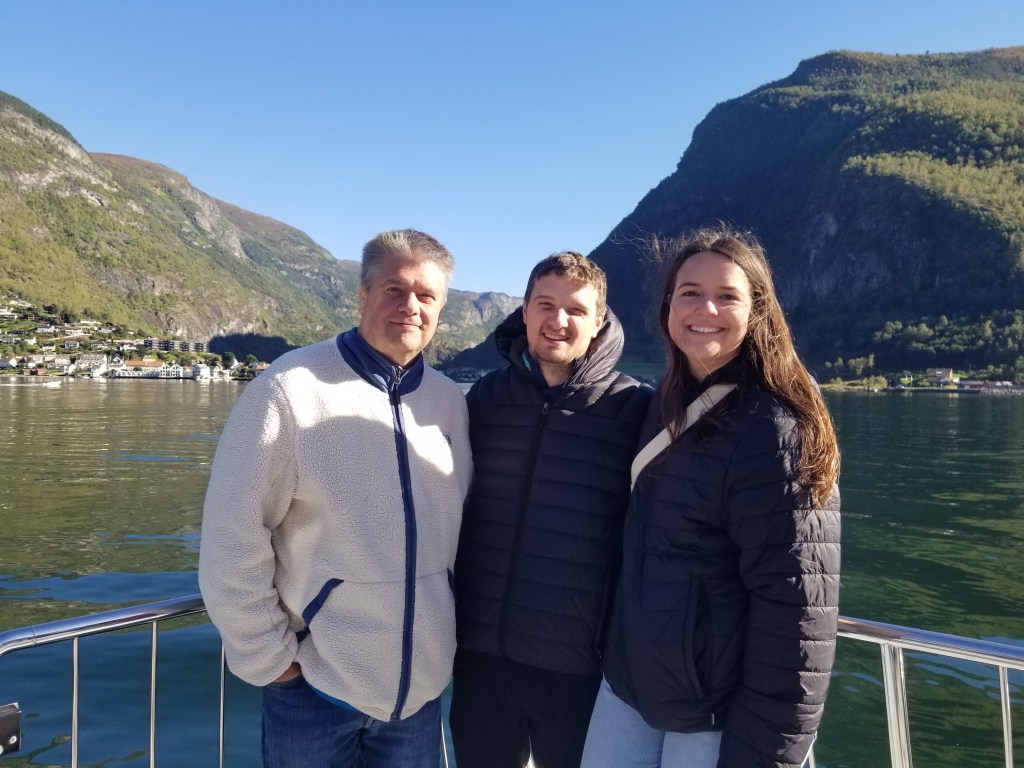
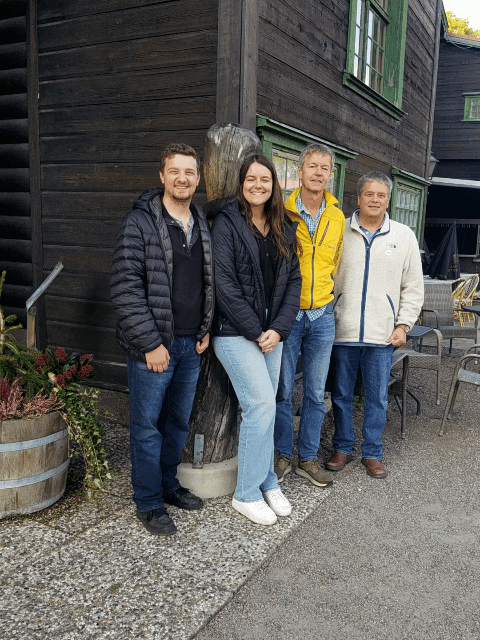
I just returned from a trip to Scandinavia with my son and his wife. Since it is World Tourism Day today, September 27th, I thought I’d make one more post related to our trip. As usual, the post features many interesting facts, but it is not a super-fact post. To provide some background. Me and my oldest son and his wife visited my native country of Sweden and Norway over the last 10+ days. We got a lot done. Unfortunately, we did not have time to visit with family this time.
From a cruise in Sognefjord. Left to right, me, my eldest son and his wife.
First, we visited Stockholm including the Old City (Gamla Stan), the Royal Palace in Stockholm and Drottningholm, which is a Royal Palace outside of Stockholm, built in the 1660’s and resembling Versailles in France. We also visited the Ice Bar, a Viking restaurant, many museums including the Vasa Museum and the Abba Museum, and we learned about Karl XIV Bernadotte, the founder of the current Swedish Royal dynasty.
A photo of the Vasa ship from the bottom floor. My son is standing on the right in a green and black shirt.
We spent a day in Uppsala, the student city north of Stockholm, where I studied engineering physics. Here we visited Sweden’s largest cathedral, the tomb of king Gustav I, Uppsala castle, my old student club (Nation of Norrland), the religious center of the Vikings, a Viking Museum, and we spent the afternoon with a classmate from my days at Uppsala University.
From left to right, my oldest son, his wife, a classmate of mine from engineering physics 35-40 years ago, and finally me in the white jacket. In the background is a restaurant. I had Viking honey mead.
We also visited Oslo, Norway, where we visited several museums including an outdoor museum, the armed forces museum, the Maritime and the Fram Museum, an old fort, and we did some fishing in Oslo fjord. We toured the Norwegian mountains and did a cruise on Sognefjord. As a side note, the Fram Museum was centered around a ship called Fram, which was used by polar explorers such as Roald Amundsen who was the first to reach the South Pole. It is generally considered that the American Robert Peary reached the North Pole first, but that claim is disputed, which makes it possible that Roald Amundsen reached the North Pole first as well.
Fram was the Norwegian ship used for Polar expeditions.
With this post I also wanted to focus on practical issues regarding visiting Scandinavia. The Scandinavian countries are relatively wealthy, like the United States, and most people, at least young people, speak English and are friendly towards tourists including Americans. When you visit tourist attractions in Scandinavia you will hear a plethora of languages. However, unlike Texas, Spanish is not a common language, so if Spanish is your first language you’ve got to know English as well. Crime is not high, even though you should watch out for pick pockets. It is rare to encounter Scandinavians who try to trick you or take advantage of you, in contrast to some other tourist places around the world. However, there are some differences between Scandinavia and the United States, especially Texas, that can be challenging to tourists.
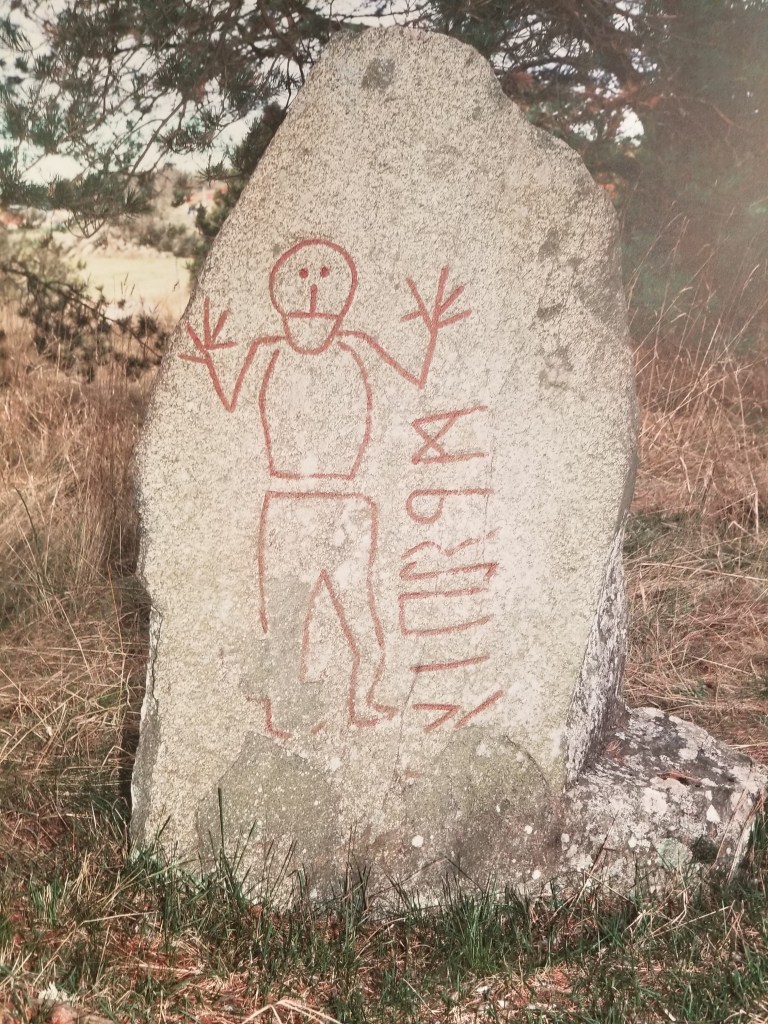
An early runestone in Sweden.
Sweden and to a certain degree Norway are trying to be cashless societies. Banks will not handle cash, most stores, restaurants, hotels, and other businesses will not accept cash. Before leaving I tried to change dollars into Swedish crowns at my bank in Dallas, but I was informed that Swedish banks no longer provide or handle cash, so they did not have any either. There are Forex stores at airports that will exchange dollars and euros into Swedish and Norwegian crowns, but using the cash is a challenge. You pretty much have to use credit cards or a swish app on your phone to pay for anything.
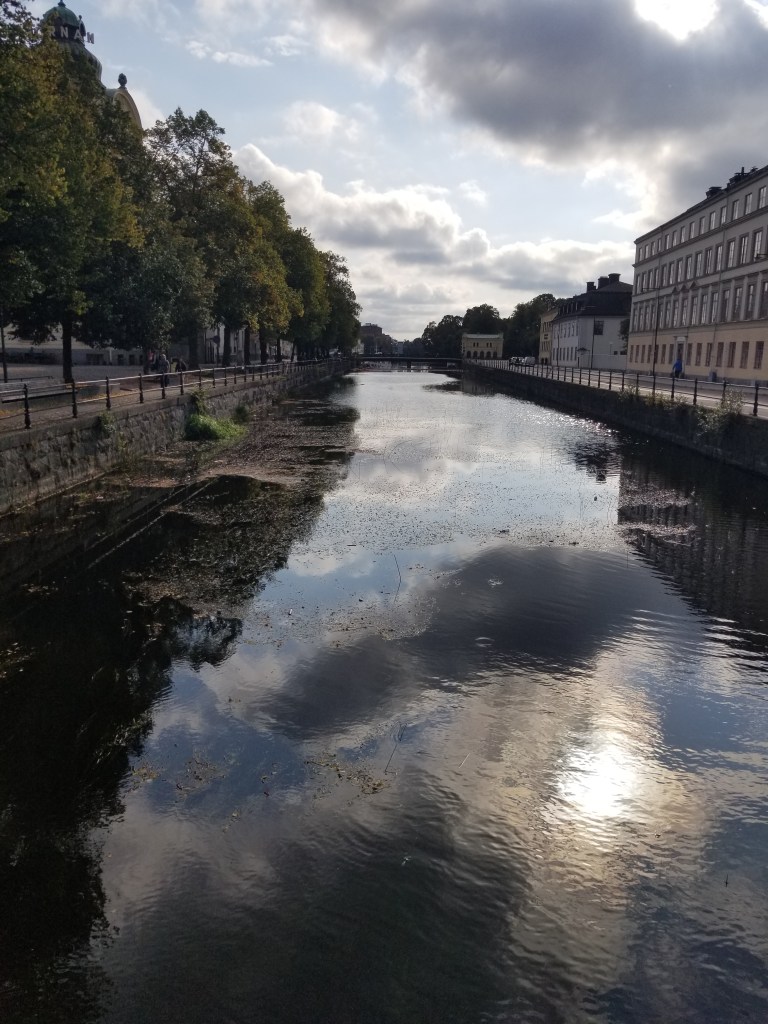
Fyrisån, the small river that flows through Uppsala.
Personally, I disagree with this. It removes one important option to pay, which becomes a problem if your credit card is stopped, or you don’t have a credit card. It greatly inconveniences tourists, visitors, and many immigrants. In addition, it forces everyone to have a detailed digital footprint that can be used to track everything you buy. Identity theft, power outages, cyber-attacks, natural disasters, and other mishaps that disable electronic payment options can become disastrous without access to cash. Therefore, despite being Swedish I think this is a bad move by Sweden.
A view of a few of the Viking king and iron age king burial mounds in Uppsala.
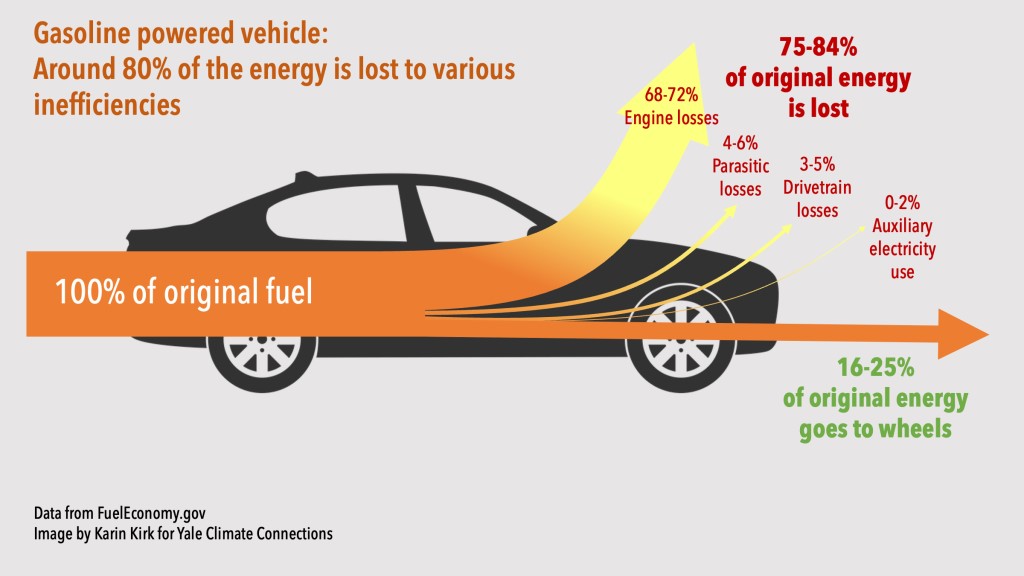
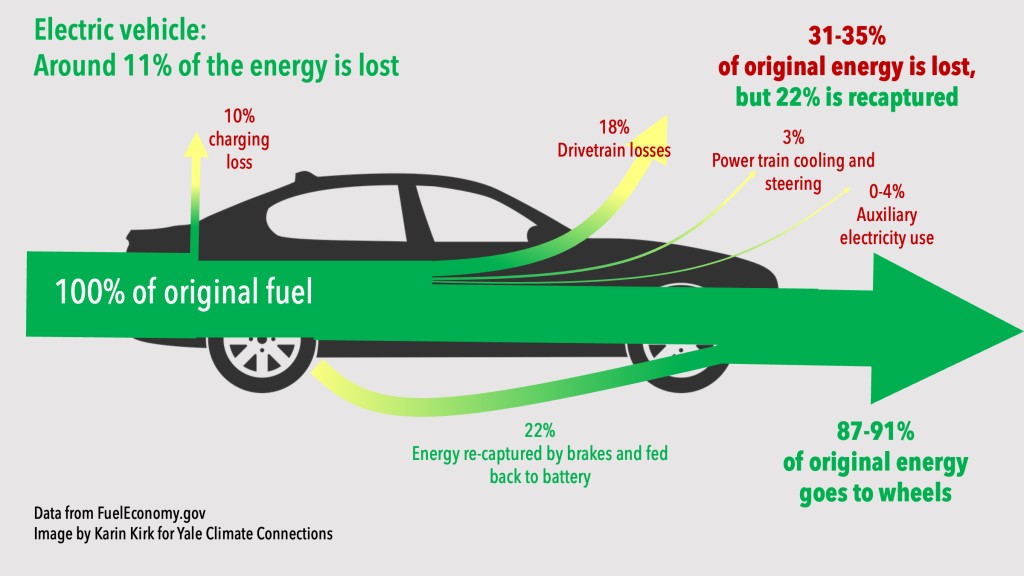
One difference that I personally find more amenable, but I know that many Texans (I live in Texas) will find objectionable, is the focus on reducing one’s carbon footprint and the fight against global warming. You are reminded of this all the time and EV cars are very common. Texans frequently believe that EV cars are not environmentally friendly and does not emit less carbon dioxide than regular internal combustion engine cars. This is a false belief that Swedes do not tend share. Sweden has an almost entirely fossil fuel free grid and Swedes value that their carbon footprint is less than a third of that of, for example, Americans. These are all things that could rub some Texans the wrong way, just like Texas opinions could rub Swedes the wrong way. It is better not to argue.
16-25% of original energy goes to the wheels. Data from FuelEconomy.gov, Image by Karin Kirk for Yale Connections.87-91% of original energy goes to the wheels. Since EVs are so much more efficient than internal combustion engines they are cleaner even when their electricity come from a very dirty grid. Data from FuelEconomy.gov, Image by Karin Kirk for Yale Connections.
There are other differences. Public transportation is very good in Sweden and Norway. Public transportation is safe and typically much cheaper than taxi, uber or renting a car. In fact, considering the difference in traffic signs, the difficulties with parking, and the restrictions on driving in inner cities, you may not want to rent a car unless you plan on driving far out into the countryside. Bicycles and bicycle lanes are also very common and need to be respected. Luckily Scandinavian inner cities are very walkable. Doorknobs/handles are not round and are like levers. Scandinavians eat dinner earlier compared to southern and central Europeans and are like Americans in that regard.
I just returned from a trip to Scandinavia with my son and his wife and I thought I would make another post related to our travel. “Sweden and Norway and Carl XIV Bernadotte” is a factual post, but it is not a super-fact post.
This post is about an interesting Swedish and Norwegian king who was imported from France, and who was the founder of the current Swedish dynasty, Bernadotte. While the United States is a democratic federal republic and Sweden is a democratic constitutional monarchy, they are both representative democracies with a lot in common politically.
The Swedish political power is divided between a legislative, executive, and judicial branch, just like in the United States, people vote for their representatives, and the modern Swedish king does not have any significant political power. However, the royal family is an important symbol for Sweden and is in general well liked. Below is the photo of the current Swedish royal family.
The Swedish Royal family. The two people in the middle are Queen Silvia and King Carl XVI Bernadotte. To the right of the king is the future monarch of Sweden princess Victoria and to the left of Queen Silvia is her husband. The others are their other two children and their spouses.
It may come as a surprise to non-Americans that despite the United States being a Democratic Republic and not a monarchy, Americans are obsessed by the British Royal family. I should say that this obsession is only with the British Royal Family and not with any of the other 42 Royal Families of the world. Sweden, Norway and Denmark are all monarchies, but my efforts to create an American obsession with the Swedish royal family might be in vain. Below is a map of northern Europe showing these three countries and a few more north European countries.
Northern Europe including Sweden, Norway and Denmark. Stock Vector ID: 2173507635 by Peter Hermes Furian
King Karl XIV Johan of Sweden (or Carl XIV), or Charles XIV John was King of Sweden and Norway from 1818 until his death in 1844 and the first monarch of the Bernadotte dynasty. However, he was elected the heir-presumptive to the childless King Charles XIII of Sweden in 1810 and became the de facto ruler after Charles XIII (Carl XIII) had a stroke in 1812. King Karl XIV was born in France 26 January 1763 and his name was originally Jean-Baptiste Jules Bernadotte.
During the Napoleonic Wars, he participated in several battles as a Marshal of France, and he played a significant role in the French victory at Austerlitz. He became an extended member of the French Imperial family (Emperor Napoleon).
This is a painting of Jean-Baptiste Jules Bernadotte (Carl XIV) hanging in the Royal Palace in the Old City of Stockholm.A photo I took of the guard at the Royal Palace in the Old City of Stockholm. If you zoom in you can see that a few of them are women.One of the many rooms inside the Royal Palace in the Old City of Stockholm.Drottningholm, one of the Royal Palaces in Sweden. It was built in the 1660’s and inspired by Versailles.
Sweden took Norway from Denmark in 1814, and Karl XIV Johan became the ruler of both Sweden and Norway and was officially made king in 1818. Sweden was a country that had been almost constantly at war but since 1814 reign Sweden was at peace. Sweden’s longstanding non-alignment and peace was initiated during King Carl / Karl XIV reign (Karl XIV Johan died 1844). Norway and Sweden resolved their union peacefully in 1905. Karl XIV Johan was popular in both countries.
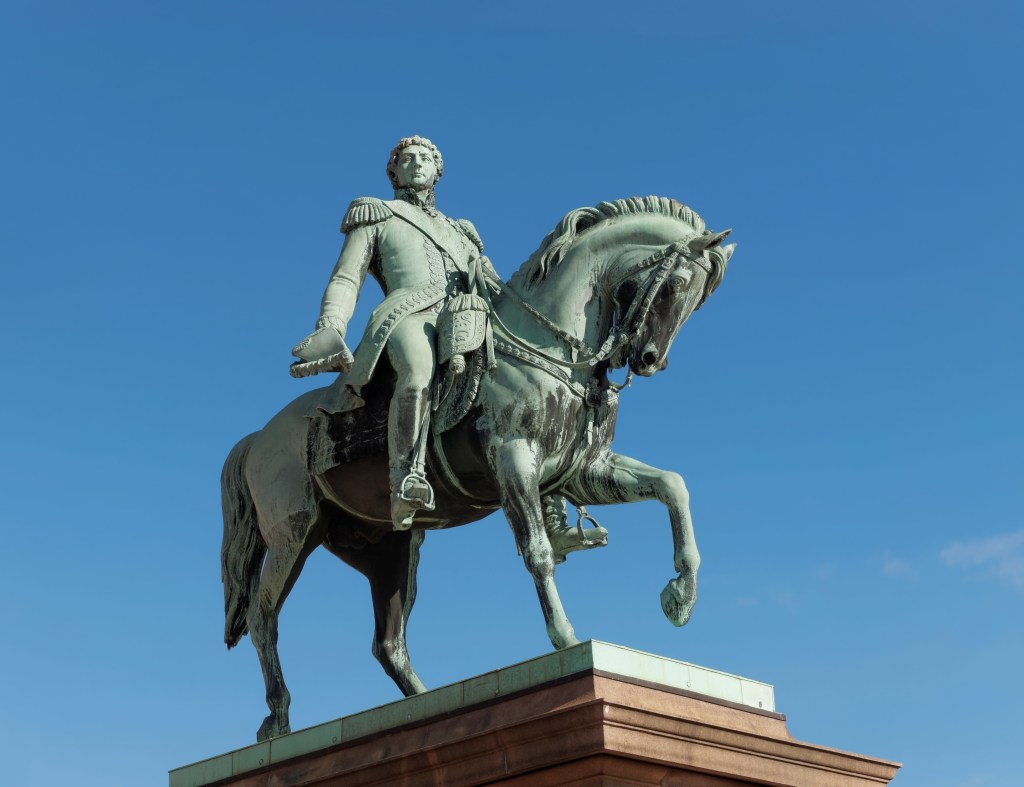
My photo of a painting in the Royal Palace in the Old City of Stockholm. It shows the coronation of Karl XIV Johan.Carl XIV of Norway and Sweden. This statue is located in Norway. Stock Photo ID: 191276033 by Toni Genes
I am currently traveling in Scandinavia with my oldest son and his wife. Therefore, my blogging activities are a little bit less intense than usual. This post is factual, but it is not a super-fact post.
Yesterday, we visited Uppsala, a city north of Stockholm. Uppsala is Sweden’s fourth largest city, and it is the home to one of Europe’s most prominent universities, Uppsala University. This is also where I studied engineering physics before coming to the United States.
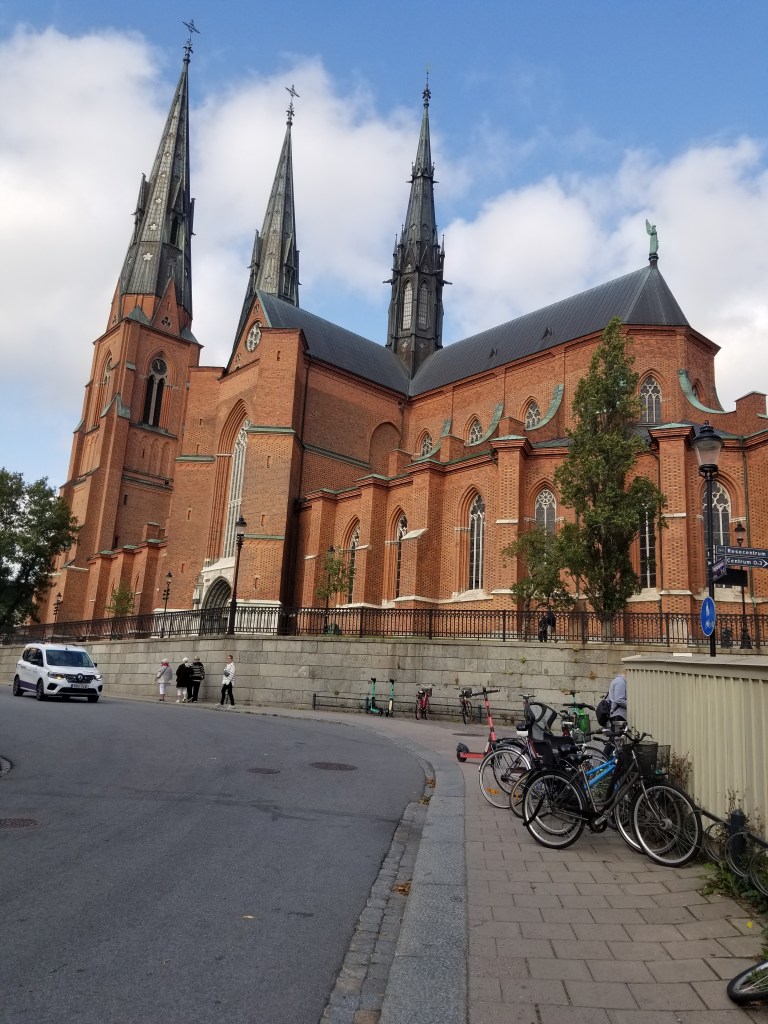
The largest cathedral in Sweden, Uppsala Domkyrka. This is where Gustav I Vasa is buried. Gustav I is arguably Sweden’s most prominent king.
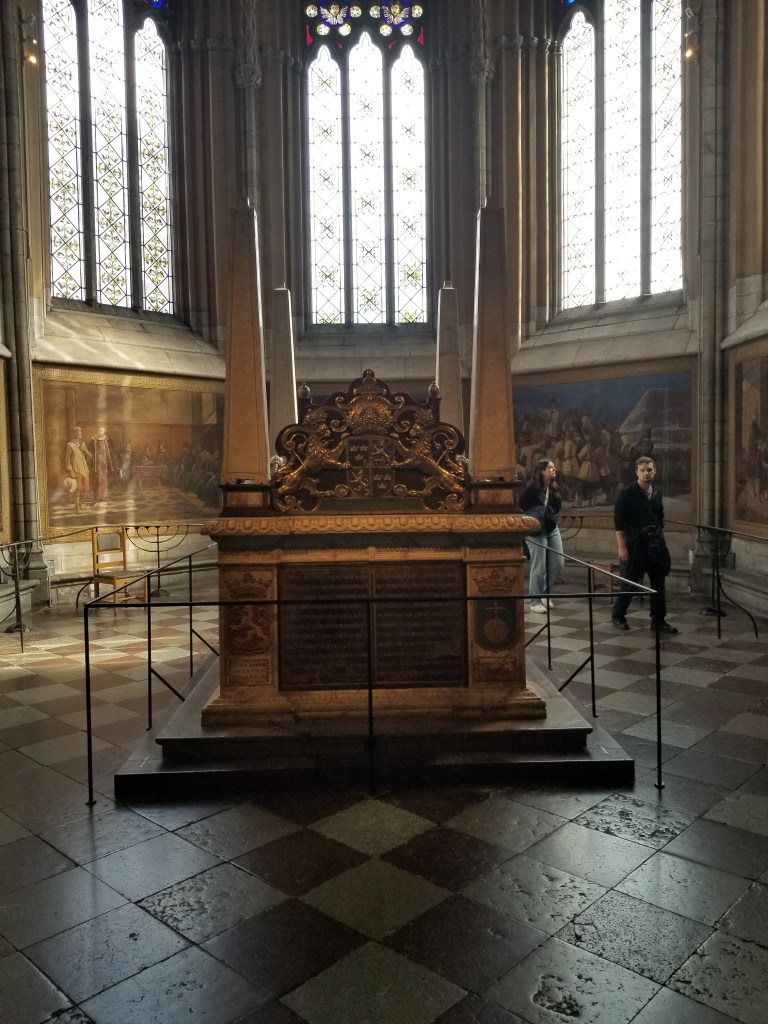
During the Viking era Uppsala was the religious center of Sweden. Later as Sweden became Christian it remained the religious center of Sweden, however, the Viking temple in old Uppsala was replaced by a Christian church. Sweden’s largest cathedral, Uppsala Domkyrka, is located in Uppsala. Inside Uppsala Domkyrka is the tomb of the king that is considered to be the father of Sweden, Gustav I Vasa.
Inside Uppsala Domkyrka.
The relationships between the Scandinavian countries were quite complicated in the past, especially that between Sweden and Denmark. If you do a google search using the phrase “which two countries fought the most wars with each other” the top results all claim that this was Sweden and Denmark. The websites in question, Quora, Twitter and Reddit, aren’t reliable sources, so this may not be true. However, more reliable sources, such as historical sites, encyclopedia Britannica and Wikipedia state that Sweden and Denmark fought at least 11 wars with each other.
Denmark vs Sweden. The yellow and blue flag is the Swedish flag. Red and white is the Danish. Shutterstock Stock Photo ID: 1114320377 by Hasanov Jeyhun.
In 1397 a union was formed between Denmark, Norway and Sweden called the Kalmar Union (Kalmar is a city a Sweden). The Kalmar Union came to be dominated by Denmark and eventually Sweden rebelled against the Danish King Christian II. He was called Christian the Good in Denmark and Christian the Tyrant in Sweden.
This rebellion was led by a noble, Gustav Eriksson who later would be crowned as Gustav I Vasa. He was the first of the Vasa kings. Sweden declared its independence from Denmark on June 6th, 1523, which is why June 6th is Sweden’s national day, or Independence Day.
The Kalmar Union. Finland was part of Sweden at the time. Ssolbergj, CC BY-SA 3.0 <https://creativecommons.org/licenses/by-sa/3.0>, via Wikimedia CommonsPainting of Gustav I Vasa. Fashion was somewhat different back in the day.
Sweden and Denmark had a complicated history that included a lot of hostilities and wars, but you wouldn’t know it if you looked at the situation today. There hasn’t been a war between Sweden and Denmark in more than 180 years and Swedes and Danes get along very well, well as long as you don’t talk too much about the past. In my opinion Swedes and Danes get along better than Texans and Oklahomans. Maybe it helps that Swedes can’t understand what the Danes are saying.
The tomb of Gustav I Vasa in Uppsala Domkyrka. In the background is my son and his wife.
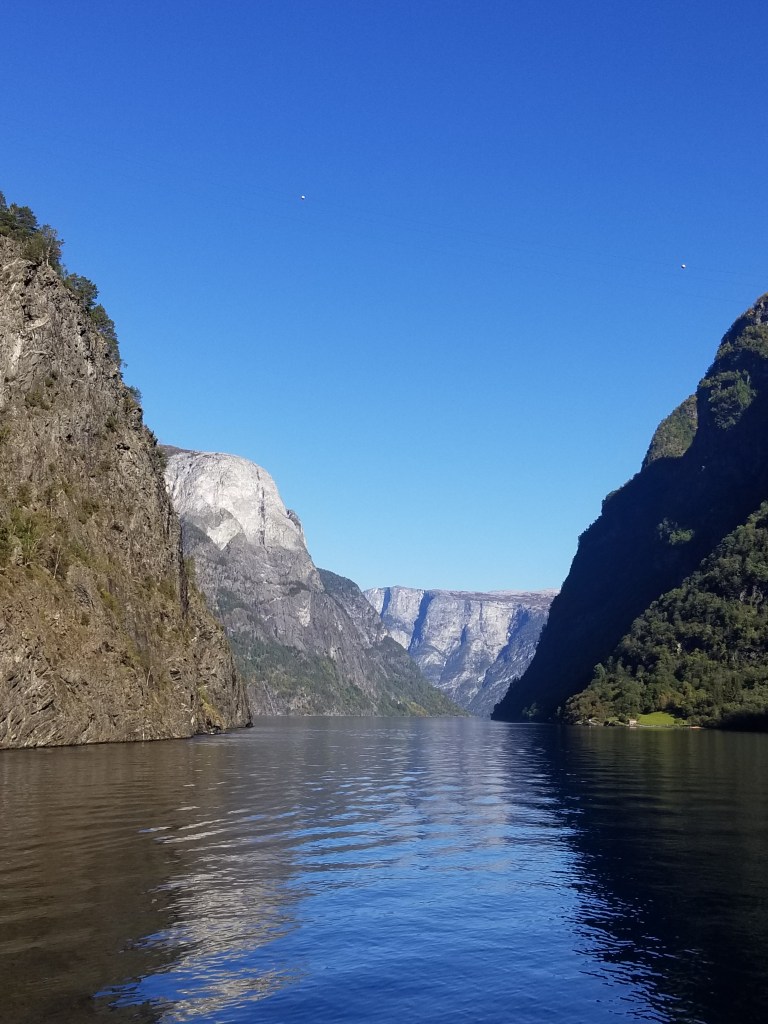
I am currently traveling in Scandinavia with my oldest son and his wife. Therefore, my blogging activities are a little bit less than usual. This particular post is not a super-fact, but it features some interesting facts regarding Scandinavian folklore and mythology. Yesterday, we visited a Norwegian Fjord called Sognefjord, which is said to be the dwelling of a number of Huldra, which is their name in Norwegian, or Skogsrå (forest fairy) in Swedish. Sognefjord is also known to be a narrow deep and long fjord. Sognefjord is one mile deep and 45 miles long and it is surrounded by tall mountains.
Me on a boat in Sognefjord Norway.The beginning (or end) of Sognefjord. Sognefjord is one mile deep and 45 miles long and surrounded by tall mountains.
A Huldra or Skogsrå or Tallemaja in Swedish is a seductive female creature who lures men with her beauty and beautiful singing and then kills the men. It should be noted that I read that if you meet a Huldra in the forest and you treat her with respect she will not kill you. She would just enjoy your company for a while, talk to you, sing to you, show you the beauty of the forest, and then she would let you go. It is only the rude and selfish men who don’t respect her boundaries whom she kills. What do you think is the truth?
Imagining how a Huldra would look like. Stock AI-generated image ID: 2400845203 by Shutterstock AI Generator.
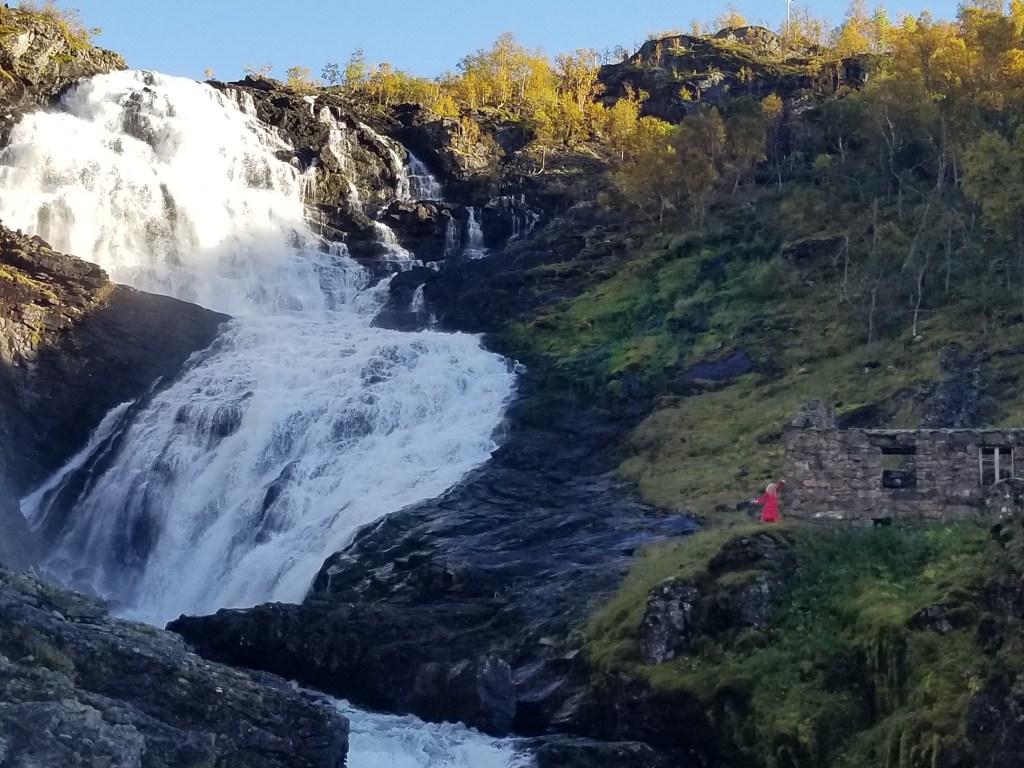
We took a two-hour cruise on Sognefjord and after the cruise we took a train to the top of the surrounding mountains. Along the way we encountered a Huldra by a waterfall. She sang to us in her beautiful voice, and she seduced us all, both men and women, to take photos of her with our phones and posting them on social media.
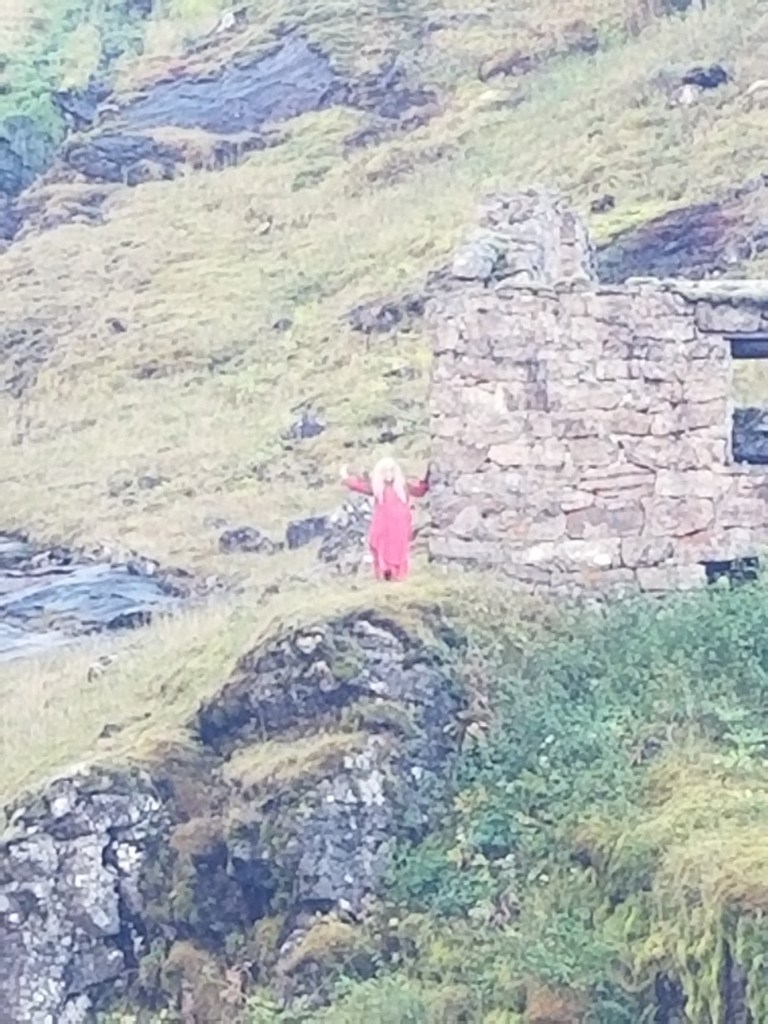
My photo of the Huldra (in red) by the waterfall in the Norwegian mountains. She seduced us all into taking photos of her for Facebook. Her seductiveness was feared in medieval times, but in modern times we refer to the seductiveness of the Huldra as a “tourist trap”. On Facebook we call it clickbait.A close up of the Huldra we encountered. Sorry, my phone camera is the best and it was at a distance.
Scandinavian Folklore Creatures:
The Huldra / Skogsrå is not the only creature in Scandinavian folklore. There are many. Below is a list of Scandinavian folklore creatures.
Huldra / Skogsrå – the aforementioned female forest spirit who may kill the men she lures with her beauty and beautiful singing.
Troll – Trolls are large ugly creatures with magical powers. They typically live in caves and sunlight is dangerous to them. They are typically hostile to humans and may kidnap people, including children, to work in their mines.
Näcken – is a male creature who lives by the water, creeks, rivers, ponds and lakes. He lures children and others to their death. In southern Sweden (Scania) he seduces people by skillfully playing a violin thus creating irresistible music.
Vittra or Vitterfolk – are supernatural spirits or small invisible people who have a lot in common with people. They own cattle and they sometimes interact with people. Usually, they stay out of your way, but if you hurt them, for example by throwing hot water out the window without warning them first, they may take revenge on you and burn down your house. Vittra are not evil but not friendly either. The belief in Vittra is especially prevalent in northern Sweden.
Tomtar – gnomes – nisse – is another type of small magical people related to vittra but unlike vittra they are friendly. They may help you with your projects and duties as long as you are nice to them. They help you with your farm and your animals, warn you of danger, and bring you gifts for Christmas if you in return give them food, such as porridge. The Swedish Santa Claus is not one guy, but a Tomte, and there are many Tomtar, often one Tomte per house. It makes a lot more sense. How could one guy bring presents to all the children around the world? He would have to fly faster than the speed of light. No, it is rather an army of Tomtar who does that work. The Walt Disney Santa Claus invention is not realistic. Ancient superstition makes more sense.
Storsjö odjuret – this is a Swedish lake monster like the Loch Ness monster. It resides in a lake in northern Sweden.
Kraken – a gigantic octopus that can bring down entire ships.
Blodstämmare – this is not a creature but a very common superstition in northern Sweden. There are people, blodstämmare, who can stop the flow of blood by uttering magical phrases while focusing their minds on the person in question. This power is usually used for good to help people who are bleeding. It can also be used for evil, like black magic, to stop the blood flow in someone’s heart. This superstition is based on Sami (indigenous north Scandinavian people) Shamanism and north Swedish Christian fundamentalism (Laestadians). It is respected enough that some north Swedish hospitals has used blodstämmare in emergency situations. The father of a close friend of mine called a blodstämmare when he had a bad nosebleed, and it worked. I know anecdotes are not valid scientific evidence, but maybe someone should do a study.
An illustration of a Tomte. Shutterstock ID: 2060057882 by PLIMPLUM.
Do I believe in the existence of any of these creatures? No, I don’t, but I am curious, what are the mythical creatures in your culture?