
Super fact 76 : The current US national debt is a record 38.35 trillion dollars and growing despite it being peacetime and no recession. The expected GDP for 2025 is 30.6 trillion, which corresponds to a debt to GDP Ratio of 125 percent.

The federal government needs to borrow money to pay its bills when its ongoing spending activities and investments cannot be funded by federal revenues alone. That the national debt is growing in terms of dollars may not be shocking. There is inflation, the country is growing, and as the economy grows its ability to pay the debt increases. Therefore, the debt to GDP Ratio is a better measurement of the size of the problem as this metric relates to our ability to pay the debt back. When the debt to GDP Ratio is growing there is a real problem.
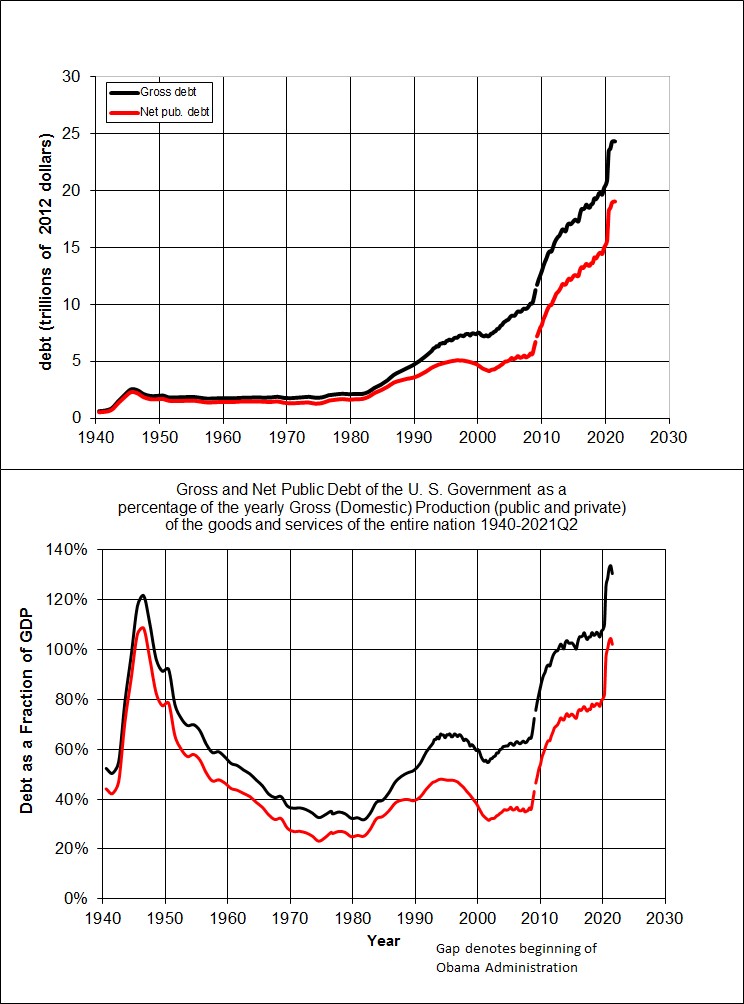
Wars and recessions tend to add to the federal debt. While debt spikes during crises, it historically receded after. The second World War is an example (see below). However, since 1980 US debt has grown without seeming to come back down. Not only does the current debt to GDP Ratio exceed the one after the Second World War, the current trends show persistent deficits even in peacetime, unlike post-WWII, making the long-term outlook scary.
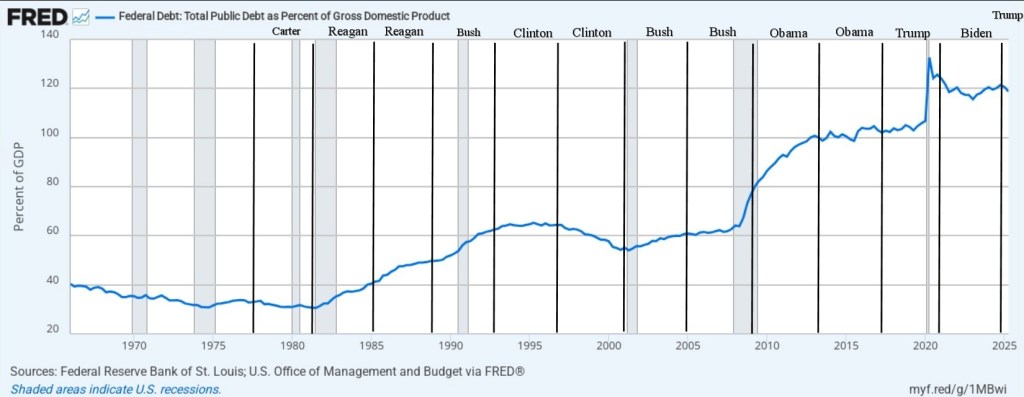
Below is an overview of the Federal Debt as percent of the GDP starting with 1965 to the beginning of 2025. The graph does not include most of the more than 2 trillion increases in debt during 2025, including a 1 trillion increase that happened in just two months toward the end of the year. So at the end there is a missing uptick. The graph below comes from this website.

In the past we used to discuss the national debt and the national deficit a lot, and it was viewed as an important and urgent problem to solve. It was a matter of intergenerational justice. There are some big problems that we have largely solved, for example, the sulfur dioxide pollution that created acid rain has fallen by 95 percent in the US, and the emissions of ozone-depleting gases have fallen by 99 Percent. As a result, we have mostly stopped talking about those problems. However, as the problem with national debt has grown, we have not increased but decreased our attention to the problem. The fact that the debt is now more than 38 trillion dollars, or $112,000 per person in US, and keeps rising despite no wars or recessions happening is probably a shock to many. It is true, it is an important fact, and it is surprising and perhaps shocking and therefore it is a super fact. To read more about the national debt click here.
Debt to GDP Presidents
One might be curious as to how the debt changed during specific Presidencies. I took the graph above and inserted lines representing the starting and ending years for the most recent Presidents. For example, Joe Biden’s Presidency started January 20, 2021, and ended January 20, 2025. I might not have gotten it exactly right so don’t read too much into it.
Below is a table I found online.
| President | Years in Office | Debt-to-GDP at Start | Debt-to-GDP at End | Change (Percentage Points) |
| Franklin D. Roosevelt | 1933–1945 | ~20% | ~112.9% | +92.9 (WWII/Depression) |
| Harry S. Truman | 1945–1953 | 112.9% | ~67.1% | -45.8 |
| Dwight D. Eisenhower | 1953–1961 | ~67.1% | ~55.2% | -11.9 |
| Lyndon B. Johnson | 1963–1969 | ~46.9% | ~38.6% | -8.3 |
| Jimmy Carter | 1977–1981 | ~35.8% | ~32.5% | -3.3 |
| Ronald Reagan | 1981–1989 | ~32.5% | ~53.1% | +20.6 |
| George H.W. Bush | 1989–1993 | ~53.1% | ~66.1% | +13.0 |
| Bill Clinton | 1993–2001 | ~66.1% | ~56.4% | -9.7 |
| George W. Bush | 2001–2009 | ~56.4% | ~84.2% | +27.8 (Wars/Recession) |
| Barack Obama | 2009–2017 | ~84.2% | ~103.6% | +19.4 (Great Recession aftermath) |
| Donald Trump | 2017–2021 | ~103.6% | ~132.8% (peak in Q2 2020) | +29.2 (Pandemic relief/tax cuts) |
| Joe Biden | 2021–Present | ~132.8% (at start of term, Q2 2020 peak) | ~124.3% (as of 2024) | Fluctuation/slight decrease due to GDP recovery/inflation |
Other Types of Debt
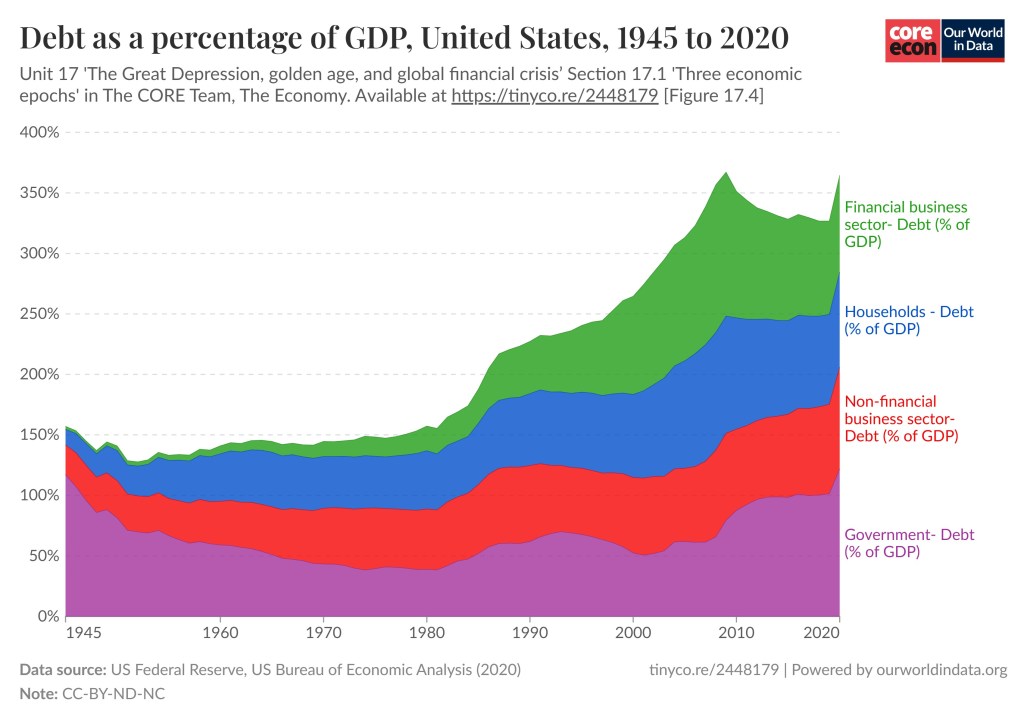
I should add that there are other types of debt not just federal debt / national debt (gross and net). American companies and financial institutions owe money and consumers have debt. As you can see in the graph below the debt to GDP ratio increase is true for those kinds of debts as well. We are a nation in debt. To read more about the graph below click here.

Wow, that’s a lot of debt. Is there no solution?
LikeLiked by 2 people
There is and it is catastrophic. Somewhere around 30% hard cut elimination of many programs.
LikeLiked by 2 people
That would effect a lot of people, do you think something like will be implemented at some point?
LikeLiked by 1 person
Another good question. I added some thoughts in response to Kevin
LikeLiked by 1 person
Will read your response. Thanks.
LikeLiked by 1 person
The problem with eliminating programs is that to make any impact you must cut big but popular programs such as Medicare (12-13% of total budget), Defense (13%), Medicaid (10-11%) and Net interest (14-15%) which can’t be cut. That is more than half of the budget from just those four. Social security is another 22% of the federal budget. The money for that comes from payroll taxes, and a portion from a trust fund, but it still counts as part of budget outlays. USAID, which many saw as a huge expense, was significantly less than 1% of the budget and only 0.15% to 0.24% of GDP. Administrative overhead is typically significantly less than 1%, so called waste is mostly a myth, and the programs people view as “cuttable” are very small. Significant cuts to the big popular programs such as Medicare and Defense is political suicide. Cuts are harder than one may think. However, there is also high inflation (implicit default), and raising taxes. Well, I guess that is political suicide too.
LikeLike
This is true as far as programs to cut. Couple things, social security dos not impact the deficit as hat is funded by employer/employee. Another topic or discussion is solvency as it was not really designed for people to live into their 90’s I just retired at 62 and took 30% to collect now.
This issues will be the cuts needed are massive and across the board some programs would have to be eliminated. The issue as you indicate to GDP is the % the US is always going to be a deficit country because the dollar runs the world, the economy is massive and we are a good bet so no risk. The risk issue is when the deficit to % of GDP is now past sustainability and it will be an issue. The last time there was no Deficit was Andrew Jackson maybe 200 years ago when there was no federal income tax so he close the 2nd national bank at the time now known as the fed and canceled the debt with Tariffs. That is another topic with Trump and no Tariffs were not meant to be used the way he has implemented them. As I previously stated the US is a good bet and we have stability. The % to GDP and Trumps lack of or growing stability on how the US acts on the world stage are the big issues now that can impact that debt in numerous ways.
LikeLiked by 1 person
Social Security is special since it is legally separate and funded by dedicated payroll taxes. However, it still affects the federal deficit and is a major driver of the national debt. The program’s current cash shortfalls require the U.S. Treasury to borrow from the public to cover the gap, thus increasing the publicly held national debt.
Like you say, the US dollar runs the world and is a good bet. However, I’ve been following discussions in the Economist about this, and China had a great 2025. There are a number of serious contenders that could replace the US dollar as the world’s reserve currency including the Yuan, the Euro, digital currencies, and the IMF’s SDR’s. But I believe you are right. There is always going to be a deficit, well except for during Andrew Jackson, and interesting fact I did not know by the way.
I certainly agree with you about what you say about Trump and Tarriffs.
LikeLike
I agree the social security is complicated when it comes to the debt, technically it is non impactful. The issue (no expert) as best I can explain depends on how the accounting is done. in the 80s the government used the surplus to fund other projects and that was never the intent. Now if there is a gap then yes the government must borrow to put back the gap. If the surplus was never touched probably a moot point.
As far as Andrew Jackson, yes he eliminated the debt and the 2nd instance of the national bank. He did not like it and knew it would lead to borrowing and debt. It was in 1913/1914 with the income tax and the founding of the Federal Reserve as the third version of a “federal bank”
I do have a killer book review coming on the history of Andrew Jackson.
LikeLiked by 1 person
I should say it was articles like this one that I had in mind. However, I admit I need to learn a lot more about this to fully understand it. Thank you for your explanation and I am looking forward to your book review.
LikeLike
That is a very good question
LikeLiked by 1 person
E ainda insistem em considerá-los o paus mais rico do mundo…. o mais endividado, com certeza. Credores que jamais serão pagos kkkk
LikeLiked by 1 person
I speak a few languages but not Spanish. But I used Google Translate. Unfortunately, I believe you are right. At some point an implicit default via high inflation may happen and then creditors will not be paid.
LikeLiked by 1 person
And our truthless leader just went on record claiming he has shaved 64% off the national debit! When will this madness ever end! Thank you for publishing the truth.
LikeLiked by 1 person
Well Trump’s latest executive order is that all numbers in the world have been increased by 5000%. So we are much older than we think. I don’t blame one President more than another for this mess but you are right, Trump and numbers is hilarious.
LikeLike
This is the classic kick the can down the road. Irresponsible politicians and as they say take from peter to pay paul. There is no actual solution. To solve the problem would take mind blowing cuts and with Donny cutting taxes to fund the rich the outlook is quite bad. It will come around. Watch BRICS and if China starts calling in debt quicker it will get worse fast. Buckle up kids. the old look here why we do something over there. My little rhyme
The news is fake, it’s all a joke,
We know by now he’s blowing smoke.
We listen daily—same old game,
His tired routine is always the same.
First, it was Greenland he would take,
Anyone with sense knew that was fake.
Then Panama became his strange obsession,
Canal possession was swapped for fears of recession.
No one can guess where that orange guy goes,
In his rants and throws, we brace and oppose.
We wait, we watch, we roll our eyes,
Another circus, no surprise.
LikeLiked by 1 person
Very good points
LikeLike
Charlee: “Okay but when everything catastrophically implodes we will still get our food and treats and have laps to sit in, right? Right … ?”
LikeLiked by 1 person
Charlee, yes your Dada will always protect you
LikeLike
I am sure a large part of the uptick in debt during 2020 was due to Covid which was an anomaly. Did you calculate this on an inflation and currency adjusted basis?
LikeLiked by 1 person
You are right Robbie, that sudded uptick at 2020 is the covid crisis. If you look at the double graph with the red and black line, the graph at the top is real dollars (2010 value). The graph below is debt to GDP ratio, which implicity includes, inflation, currency, population growth, economic growth, etc., because it is a percent of GDP rather than dollars. It is a way of normalizing the numbers, making them correspond to the real problem. That’s why that graph is scarier. It really correspond to the size of the problem with respect to our ability to pay back the debt.
LikeLike
Yes, it is well known in financial circles that American debt is out of hand. It is the same in many other Western countries.
LikeLiked by 1 person
Yes you are right. You are working in finance and accounting. A lot of countries around the world has put themselves in the same situation and worse, Japan, Greece, Singapore, Italy,… I focused on the US because that’s where I live and intearact with people, but you are right it is worldwide. My native country Sweden is in a much better position.
LikeLike
I’m glad Sweden is better. There needs to be a bit of a reset of how people live and what they expect.
LikeLiked by 1 person
When I left Sweden in 1996 Sweden had a bad national deficit but they fixed so it is less bad now. Someone suggested to me that I should pay my share of the national deficit before I am allowed to leave Sweden. However, now the tables have turned.
LikeLike
Yes, nothing stays the same in life
LikeLiked by 1 person
I meant for the presidential terms. I know it’s adjusted in the top charts because it says so.
LikeLiked by 1 person
Sorry Robbie I typed before reading this comment. But yes that graph is also debt to GDP ratio.
LikeLike
💗🙏
LikeLiked by 1 person
Another interesting post. Thank you, Thomas.
LikeLiked by 1 person
Thank you so much Esther.
LikeLiked by 1 person
Thank you for this interesting post, Thomas!
LikeLiked by 1 person
Thank you so much Miriam
LikeLiked by 1 person
Interesting to see the graphs matched up to the presidents. It is ot what I would have thought. Maggie
LikeLiked by 1 person
Yes there might be a few surprises. It is important though to remember that Presidents may not have that much influence over the fate of the national debt. Thank you so much Maggie.
LikeLiked by 1 person
I don’t follow US politics too closely, but it seems as though the president has a lot more power than he/she should.
LikeLiked by 1 person
Yes you are right in the US, as in many other countries you have a separation of powers. The executive branch in the US has overstepped lately, especially overstepping the powers of congress. Examples are, freezing and reprogramming congressionally appropriated funds, dismantling and defunding of independent agencies created by congress, deployment of national guard/federal agents to cities without approval, firing federal employees he does not have the right to fire, overuse of executive orders, imposing tarrifs without approval of congress, etc. The President should not have the power to do that.
However, what I meant when I said “Presidents may not have that much influence over the fate of the national debt” is that the national debt grows a lot when recessions happen, or big wars, and recessions are hard to predict and control, covid was an unpleasant surprise, and even some wars you are more or less forced to fight.
LikeLiked by 1 person
He has restricted powers as one of the branches but that can be a bit grey as the president. The issue is the powers today are being allowed to expand unchecked to the political slant of the court.
LikeLiked by 1 person
Yes you are right
LikeLike
Hope you had a great holiday 😊
LikeLiked by 1 person
Yes we did and I hope you had a great holiday too, and Happy New Year, and I hope you will have a better 2026
LikeLiked by 1 person
Thanks my friend
LikeLiked by 1 person
Thanks for the reality check. I’m okay with cuts in “defense” and cutting tax breaks for the ultra-rich, but people pay into social security, deserve to collect on our investments made for retirement.
LikeLiked by 1 person
I agree with you but it is getting complicated. We’ll see what happens.
LikeLiked by 1 person
I remember the “grownups” talking about this when I was a kid in the 80s. I even remember an old Bloom County cartoons where a couple of economists show up and get into an argument about the economy and just when it’s winding down one of the animals makes the mistake of saying something about “the deficit” and they start arguing again about whether or not it matters. The more things change …
LikeLiked by 1 person
Yes I know. However, even though we talked about it a lot back then the debt was much smaller.
LikeLike
Cyber guy played a crucial role in successfully recovering my stolen USDT, which was valued at more than $10,000. His expertise and dedication made the recovery process smooth and efficient. Throughout the entire time, he demonstrated himself to be a reliable recovery agent. His professionalism and commitment to his clients are evident in the results he achieves. He’s indeed who he says he is a professional hacker who also recovered my lost social media accounts. If you find yourself in a similar situation or need assistance, he is available for contact. You can reach anthony through email at Cybersafe_001@yahoo.com thank you a lot Mr. Anthony
LikeLiked by 1 person
Thank you so much cptsmith70
LikeLiked by 1 person
Welcome Thomas 🙏
LikeLiked by 1 person