Super fact 60 : Superfluids such as liquid Helium cooled below -455.58 Fahrenheit exhibit some very strange characteristics such as it flows right through many solids, it climbs walls, it has near zero viscosity, it exhibits circulating flows that never stop despite no energy being added. It is a Macroscopic Quantum Phenomenon.
When gases are cooled far enough, they will turn into liquids and eventually typically to solids. For example, Oxygen becomes a liquid when its temperature drops to -297 Fahrenheit, which is -183 Celsius, or 90 degrees Kelvin. Kelvin is 0 at absolute zero, the coldest possible temperature, and in addition it uses Celsius for the scale. So, 90 degrees Kelvin is 90 degrees Celsius above absolute zero or 162 degrees Fahrenheit above absolute zero. When Oxygen becomes a liquid, it turns into a pale blue liquid. Oxygen becomes a solid at 54 Kelvin, or −218.8 Celsius, and −361.8 Fahrenheit (at normal pressure). It becomes sky blue ice.
Helium stays a gas until very extreme temperatures. Helium becomes a liquid at 4.2 kelvin or -269 Celsius, or -452.11 Fahrenheit. If the temperature is reduced further by almost half to 2.17 Kelvin, or -270.98 Celsius, or -455.8 Fahrenheit, then Helium suddenly becomes a superfluid, exhibiting macroscopic quantum phenomena. It is so different from normal liquid Helium that it is called Helium II. Its heat conductivity (speed of heat/cold transfer) suddenly increases by one million, and the temperature will become the same throughout the liquid instantly. Even a big pool of liquid helium would almost instantly get the same temperature throughout, and the atoms will start behaving in unison. Regular bubbles can no longer exist (atom sized electron bubbles can exist though).
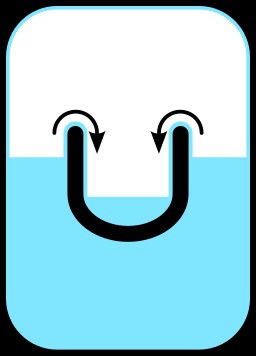
The liquid starts behaving in bizarre ways. If you place an open metal container of Helium II in a closed room the Helium II would climb out of the container and escape, and a thin film of Helium II would climb the walls and the ceiling. If the floor was made of metal or glazed tile the Helium II would remain on the floor. If the floor was made of unglazed tile or stone, it would leak right through the floor as if the floor was a sieve. If you get a whirlpool or fountain going it will keep going forever without any energy loss. In addition, it would also exhibit many quantum effects that are out of scope for this post.
I consider this a super fact because this is a strange, surprising and not a well-known phenomenon. It is a quantum effect that you can observe with your own eyes. It is important because the discovery of superfluidity and its twin effect superconductivity are very important for science and might lead to revolutionizing energy transport in the future. It is no doubt that the phenomenon is real (true), and it has been documented by numerous experiments and papers. It is described in thousands of textbooks, and I’ve observed the phenomenon with my own eyes (that is next).
Our Experiment with Superfluid Helium
During my first class in Quantum Physics, we performed experiments with liquid Helium. We started out by cooling helium using liquid nitrogen (colder than -196 Celsius or -321 Fahrenheit). Then using vacuum pumps, we kept cooling the Helium until it became liquid. We continued cooling it and we could see lots of bubbles and boiling as we kept going, and then it boiled extra much, and then very quickly the bubbles vanished, and the content of the entire glass container settled down and then stood perfectly still.
As 2.17 Kelvin was reached the viscosity (flow resistance) was instantly lowered with about one million times, and non-microscopic bubbles could no longer exist. The heat conductivity (the speed with which temperature spreads) increased by one million times. It means that the heat of a drop falling in one end of a swimming pool of Helium II would spread throughout the swimming pool in a second. Except, we only had a glass container in which sameness reigned throughout the liquid.
We continued doing experiments such as watching the Helium II climb walls inside the experimental setup, and of course the famous fountain. Insert a little metallic straw and watch a Helium fountain start to flow, by itself. Without any energy or pressure added, it just kept going by itself because no energy was lost either.
I can add that it was more of a demonstration than an experiment that we actively participated in because playing with extreme temperatures high or low is dangerous. If you’ve read this blog for a while you might remember when I put a Cesium-137 sample (800 times more radioactive than Plutonium-239) in my jeans pocket instead of back into its lead brick container and walked around with it a whole day. Or that time when I replaced a fuse for a 380 volt three phase powered laser with my finger because I was curious what would happen if I put my finger in there, and I was shocked, and it hurt. Students shouldn’t play with dangerous stuff.
Below is a one minute and forty four second YouTube video of a Superfluid / Helium II experiment showing an eternal fountain.
Below is a four minute explanation of a superfluid / Helium II experiment.
I can add that Helium II (super cold helium) is not the only superfluid but the easiest one to achieve.
Other Physics Related Superfacts
- Some Things Cannot be Known
- Radon Represents our Largest Exposure to Ionizing Radiation
- We are Star Dust
- The Speed of Light In Vacuum Is a Universal Constant
- Two events may be simultaneous for some but not for others
- The Strange Worlds of Exoplanets
- The vastness of space and the beginning of infinity
- The Bizarre Reality of Black Holes
- Every Symmetry is Associated with a Conservation Law
- GPS uses relativity for accuracy
- Time Dilation Goes Both Ways
- The Pole-Barn Paradox and Solution
- The Enormous Kuiper belt
- Time is a Fourth Dimension
- Electric Charge is not the only type of Fundamental Charge