The goal of this blog is to create a list of super facts. Important facts that are true with very high certainty and yet surprising, misunderstood, or disputed by many. This blog aims to be challenging, educational, and fun, without it being clickbait. I determine veracity using evidence, data from reputable sources and longstanding scientific consensus. Prepare to be challenged (I am). Intentionally seek the truth not confirmation of your belief.
The goal of this blog is to create a list of what I call super facts. Super facts are important true facts that nevertheless are surprising to many, misunderstood, or disputed among the non-experts. They are special facts that we all can learn something important from. However, I also make posts that are not super facts but feature other interesting information, such as this book review and book recommendation. I should say that this book is not written by a scientist but an environmentalist, and he did not provide references for his hundreds of factual claims. However, I fact checked at least 20 claims and found only one that was not entirely correct, so I think his facts are for the part correct. The book is:
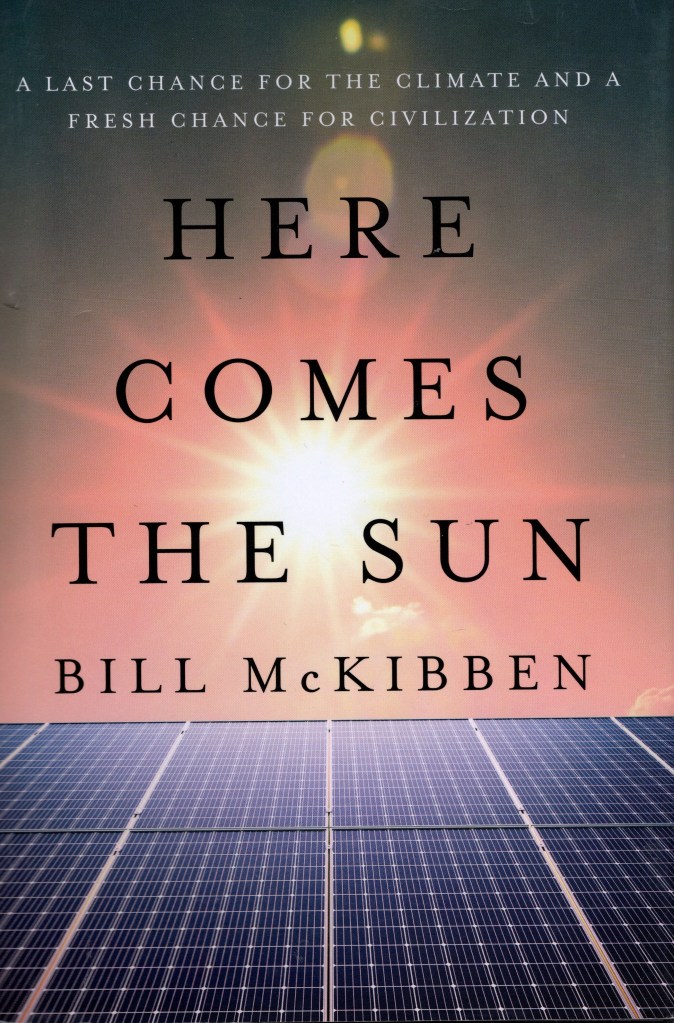
Here Comes the Sun: A Last Chance for the Climate and a Fresh Chance for Civilization by Bill McKibben
Below I am listing the four versions of this book. I bought the hardback version.
Hardback – Publisher : W. W. Norton & Company (August 19, 2025), ISBN-10 : 1324106239, ISBN-13 : 978-1324106234, 224 pages, item weight : 12 ounces, dimensions : 5.8 x 0.9 x 8.6 inches. It costs $15.91on US Amazon. Click here to order it from Amazon.com.
Paperback – Publisher : W. W. Norton & Company (August 11, 2026), ISBN-10 : 1324130628, ISBN-13 : 978-1324130628, 240 pages, item weight : 13 ounces, dimensions : 1 x 5.5 x 8.25 inches. It costs $19.99 on US Amazon. Click here to order it from Amazon.com.
Kindle – Publisher : W. W. Norton & Company (August 19, 2025), ASIN : B0DXQGBM4Z, 220 pages, it costs $9.40 on US Amazon. Click here to order it from Amazon.com.
Audiobook – Publisher : Highbridge Audio (August 19, 2025), ASIN : B0F95QL1C2, Listening length : 7 hours and 36 minutes. $0.00 with membership. Click here to order it from Amazon.com.
The front cover of Here Comes the Sun: A Last Chance for the Climate and a Fresh Chance for Civilization by Bill McKibben. Click on the image to go to the Amazon page for the hardback version of the book.
Amazon’s Description of the Book
From the acclaimed environmentalist, a call to harness the power of the sun and rewrite our scientific, economic, and political future.
Our climate, and our democracy, are melting down. But Bill McKibben, one of the first to sound the alarm about the climate crisis, insists the moment is also full of possibility. Energy from the sun and wind is suddenly the cheapest power on the planet and growing faster than any energy source in history―if we can keep accelerating the pace, we have a chance.
Here Comes the Sun tells the story of the sudden spike in power from the sun and wind―and the desperate fight of the fossil fuel industry and their politicians to hold this new power at bay. From the everyday citizens who installed solar panels equal to a third of Pakistan’s electric grid in a year to the world’s sixth-largest economy―California―nearly halving its use of natural gas in the last two years, Bill McKibben traces the arrival of plentiful, inexpensive solar energy. And he shows how solar power is more than just a path out of the climate crisis: it is a chance to reorder the world on saner and more humane grounds. You can’t hoard solar energy or hold it in reserves―it’s available to all.
There’s no guarantee we can make this change in time, but there is a hope―in McKibben’s eyes, our best hope for a new civilization: one that looks up to the sun, every day, as the star that fuels our world.
Here comes the sun tells the story of the spectacular success of renewables around the world, especially the success of solar power and wind power, with a special emphasis on solar power. The success of renewables was one reason that the IPCC will likely retire the RCP8.5 emissions scenario. The RCP8.5 emissions scenario, which was the extremely bad emissions scenario, was never very likely to begin with, but the fact that the world, including China, is turning away from coal and fossil fuels made this scenario implausible as they stated. I am not sure whether Bill McKibben could have predicted this when he wrote this book, but I think this recent event makes this book very relevant now in 2026.
The book describes a very interesting situation for our world and contains interesting personal anecdotes and is written in a positive and optimistic way. However, I was delighted that the book was full of interesting facts, for example, in 2024 92.5% of all new electricity bought online around the world came from renewables. Other facts are, Chinese emissions are dropping. He tells us that forty percent of the world’s ship traffic consists of moving coal and gas back and forth across the ocean to be burned. He states that the entire continent of Africa has barely produced 3% of the greenhouse gases warming the atmosphere, whilst they are likely to bear the brunt of the effects of global warming.
Other interesting facts are; Chinese citizens can expect to live on average 2.2 years longer than they would have a decade ago, due to the sharp drop in pollution (thanks to renewables and EVs). Dealing with cleantech waste is a small problem compared to fossil fuels, and we have enough minerals, especially considering recycling. He tells us about various physics facts related to the sun, how our health is effected by the sun, the history of the day “Sunday”, sun worship in the ancient world, and other sun related facts.
He reviews the history of fossil fuels and renewables, particularly solar power, and the how the fossil fuel industry and certain politicians are fighting against renewables with disinformation and bad faith arguments. He explains the problems with fossil fuels and the dangers they pose, which is not just limited to climate change. He also explains a little bit about why we know that fossil fuels are causing global warming / climate change, why we need to keep pushing for renewables despite their success. He states that because fossil fuels themselves are easy to concentrate, they often yield authoritarian outcomes.
In the past renewables were an expensive alternative and fossil fuels cheap, but that situation has been reversed. He explains why EVs are in general cleaner and better for the environment than cars with internal combustion engines. He explains how we get around the intermittence issue with wind and solar and that batteries are getting much cheaper and environmentally friendlier, and why a lot of negative information you hear about batteries is not true anymore. Salt batteries is an example of an emerging technology.
My only concern with the book is that Bill McKibben is not a scientist. He is an activist. Because of that it is extra important that he provides references to reputable sources for all his claims. Typically, scientists provide references to their claims even though you in general can trust scientists more than activists. However, Bill McKibben provided no references to any of his several hundred facts and claims, except for some general and vague information in the back about where he got his information from.
I should say that I fact checked about two dozen of his claims and found only one that was not entirely accurate, so overall I trust this book. The book is easy, lighthearted and positive reading. It is not a heavy science book, the book was well organized, and he is a good author. Therefore, I highly recommend this book.
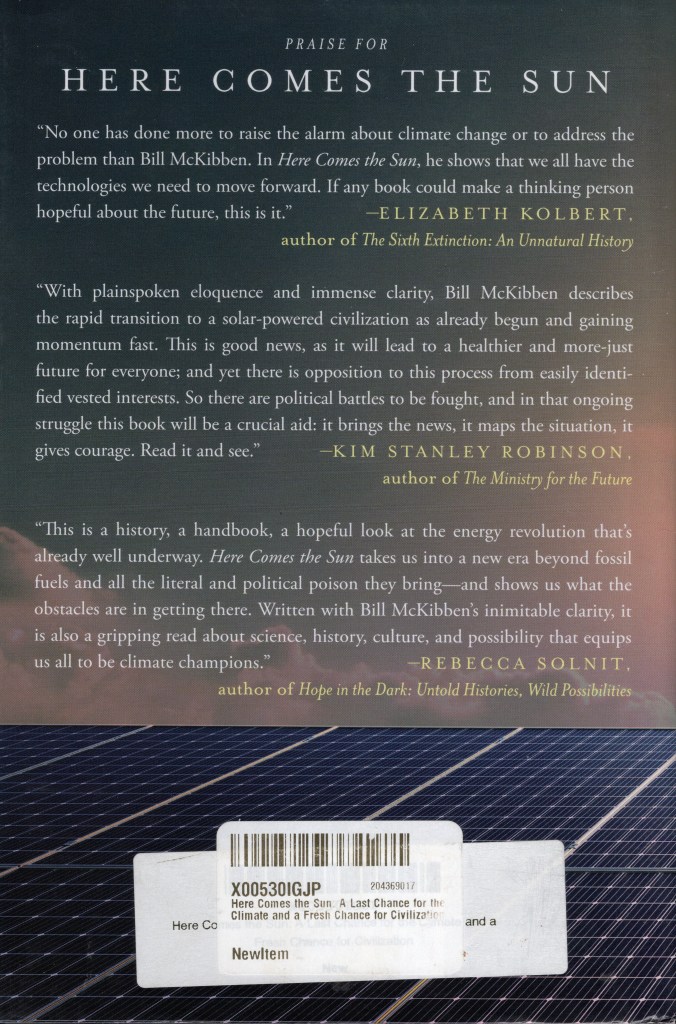
The back cover of Here Comes the Sun: A Last Chance for the Climate and a Fresh Chance for Civilization by Bill McKibben. Click on the image to go to the Amazon page for the paperback version of the book.
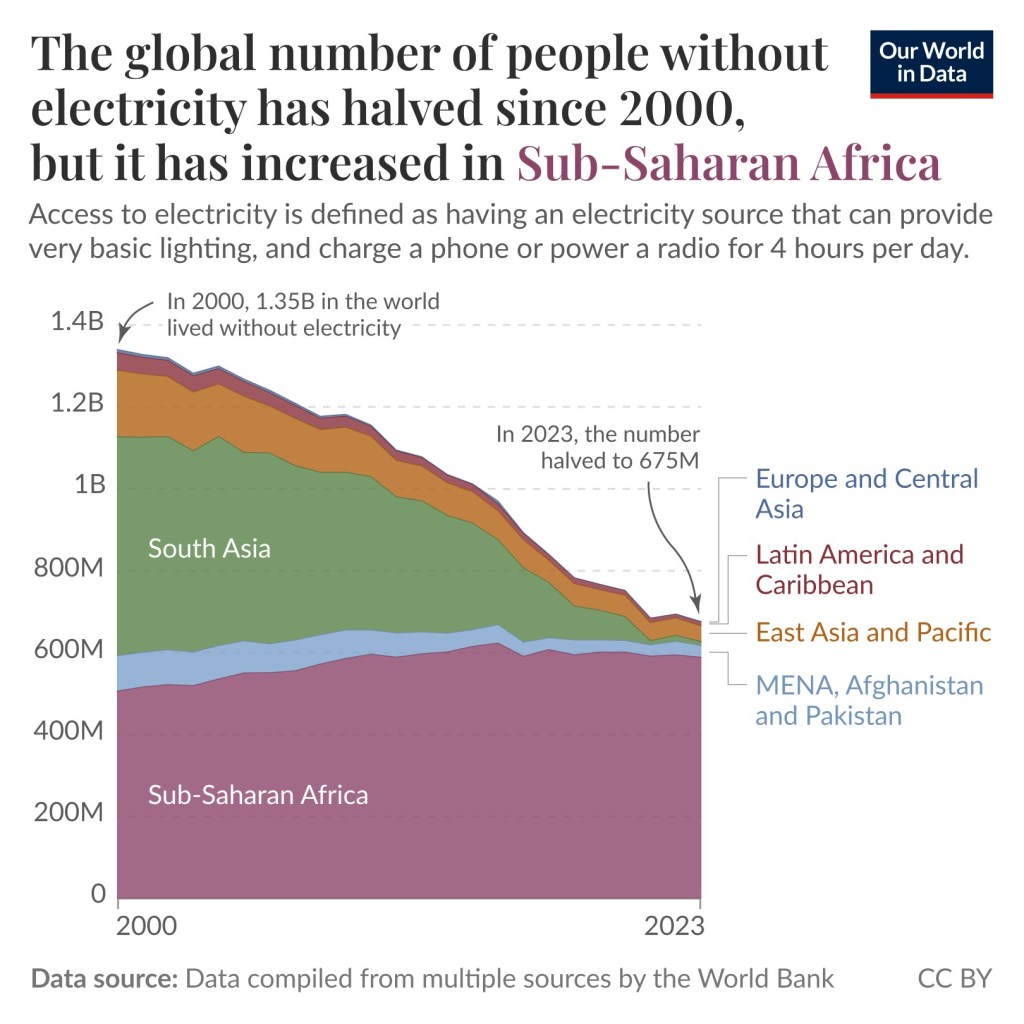
Super fact 109 : The global number of people without electricity has halved since 2000, but it has increased in Sub-Saharan Africa. In the year 2000 1.35 billion people in the world was without electricity and in the year 2023 it was 675 million people according to Our World in Data. The dark aspect of the statistics is that the number of people without electricity in Sub-Saharan Africa has increased from 500 million people to more than 600 million people.
The global number of people without electricity has halved since 2000, but it has increased in Sub-Saharan Africa. Access to electricity is defined as having an electricity source that can provide very basic lightning and charge a phone or power a radio for 4 hours per day. Data source: Data compiled from multiple sources by the World Bank. CC BY. The graphs come from this page from Our World in Data.
This also means that the share of people without electricity living in Sub-Saharan Africa increased from 37% in the year 2000 to 80% now. However, it is also true that the share of people in Sub-Saharan Africa with electricity has doubled, rising from 26% to 53%. What is going on is that population growth has outpaced this expansion, meaning the number of people without electricity has still risen.
For the rest of the world, it is unequivocally good news. For example, in South Asia more than 500 million people lacked electricity in the year 2000, 414 million lacked electricity in 2010, and only 27 million people lacked electricity in 2023. Another way to look at the access to energy gap is by considering how long it is possible to run an air conditioner in different countries. Click here for data and analysis. In summary, the news for Sub-Saharan Africa is complicated but for the rest of the World, it is very good news. To read more about this topic click here.
I consider this a super fact because I believe it is an important but surprising fact in two parts. First the great news for the world and secondly the mixed news for Sub-Saharan Africa.
No Relief for the Heat Down in Africa
As mentioned, four of the five regions of the world, Europe and Central Asia, Latin America and the Caribbean, East Asia and the Pacific, MENA, Afghanistan, and Pakistan have made substantial progress. However, Sub-Saharan Africa is a complicated case. Note that MENA stand for Middle East and North Africa.
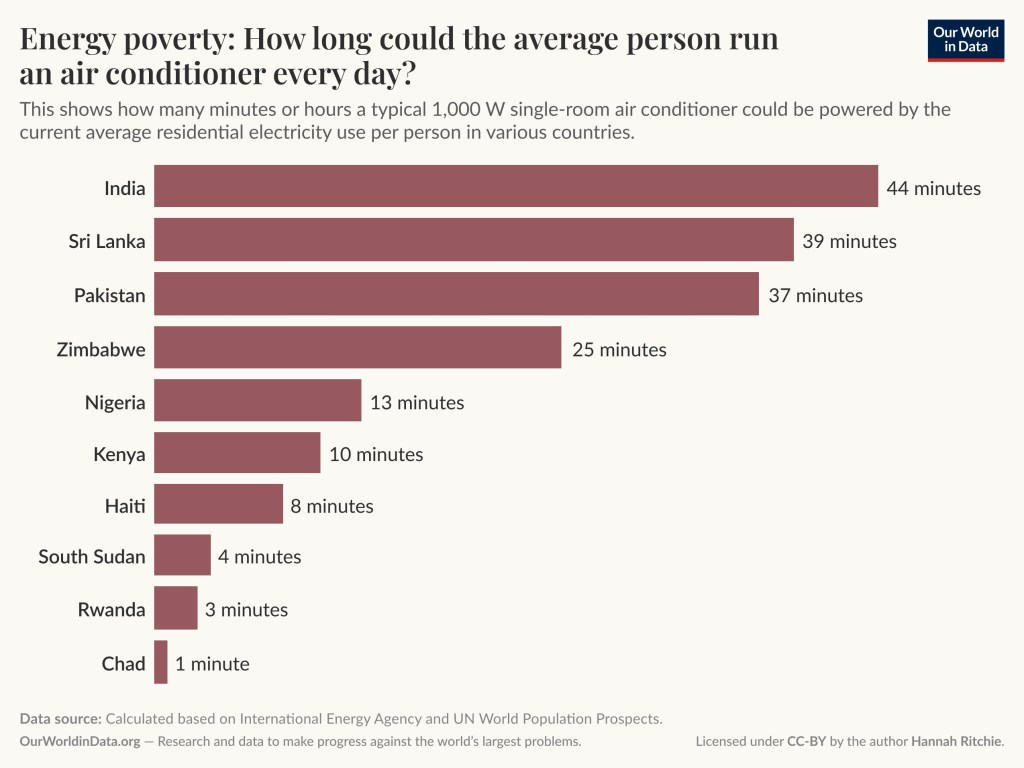
An alternative way of looking at access to electricity is to consider how much electricity is being used in each country and how that translates into the number of hours or minutes that an air conditioner could be running. Note it doesn’t mean that an air conditioner will be shut off after, let say 25 minutes, just that is much electricity one person use. What should be noted from the graph below is how dire the situation still looks like in Sub-Saharan countries. Sub-Saharan Africa is still very behind in this regard, and the fact that global warming is likely to hit Africa very hard that is not good news.
Energy Poverty: How long could the average person run an air conditioner every day? This is how many hours a typical 1000 W single-room air conditioner could be powered by the current average residential electricity use per person in various countries. Data source: Calculated based on International Energy Agency and UN World Population Prospects. OurWorldinData.org – Research and data to make progress against the world’s largest problems. Licensed under CC BY by the author Hannah Ritchie. The graph is coming from this page from Our World in Data.
Superfact 107: Electric vehicles are rapidly replacing the internal combustion engine (ICE cars) and are becoming commonplace around the world. It is analogous to how cars once replaced the horse and buggy.
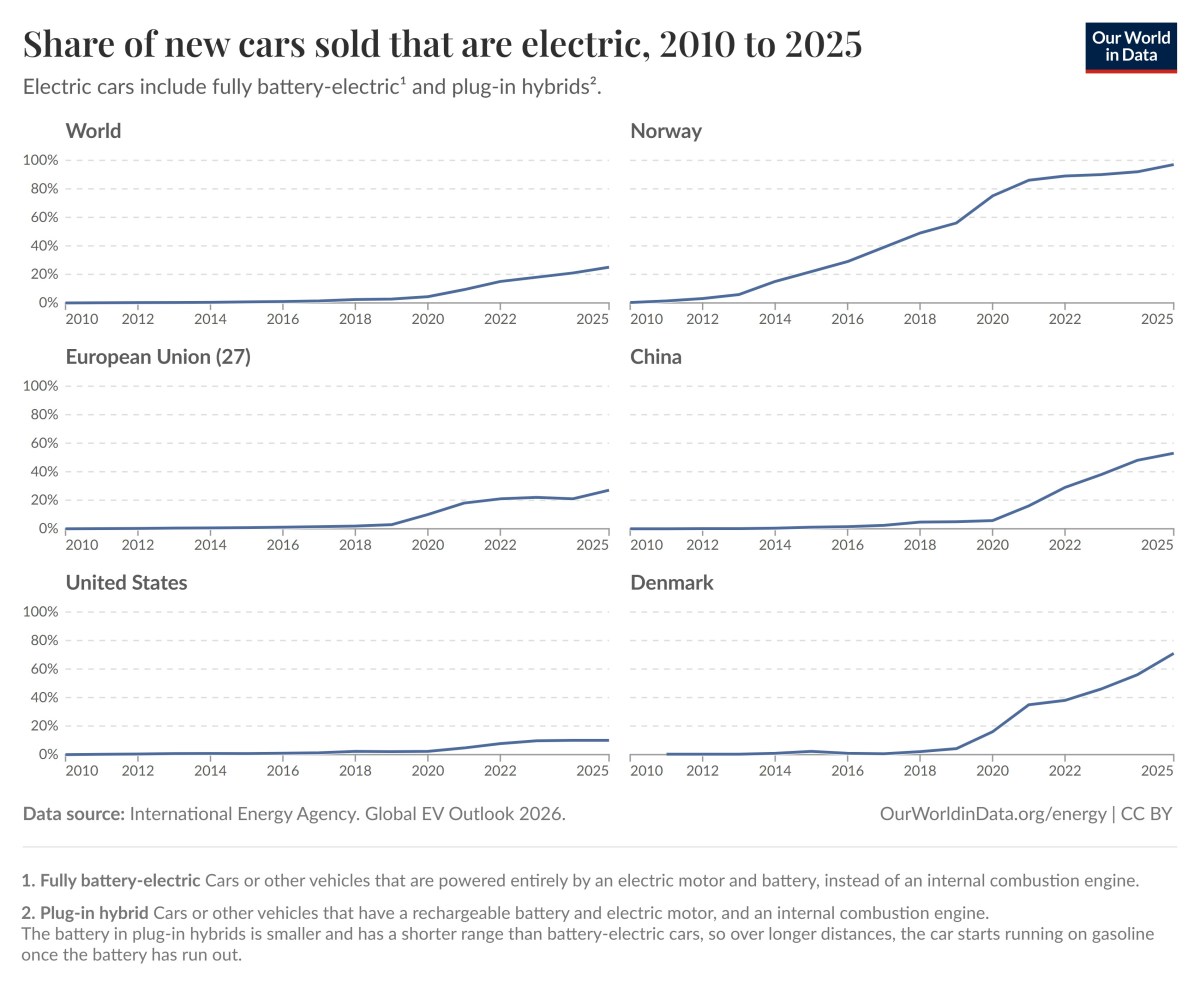
In Norway close to 100% of all new cars sold in 2025 were electric vehicles. Around the world a substantial percentage of new cars sold in 2025 were electric vehicles. This phenomenon is not as visible here in the US, where I live, but if you travel, you’ll notice.
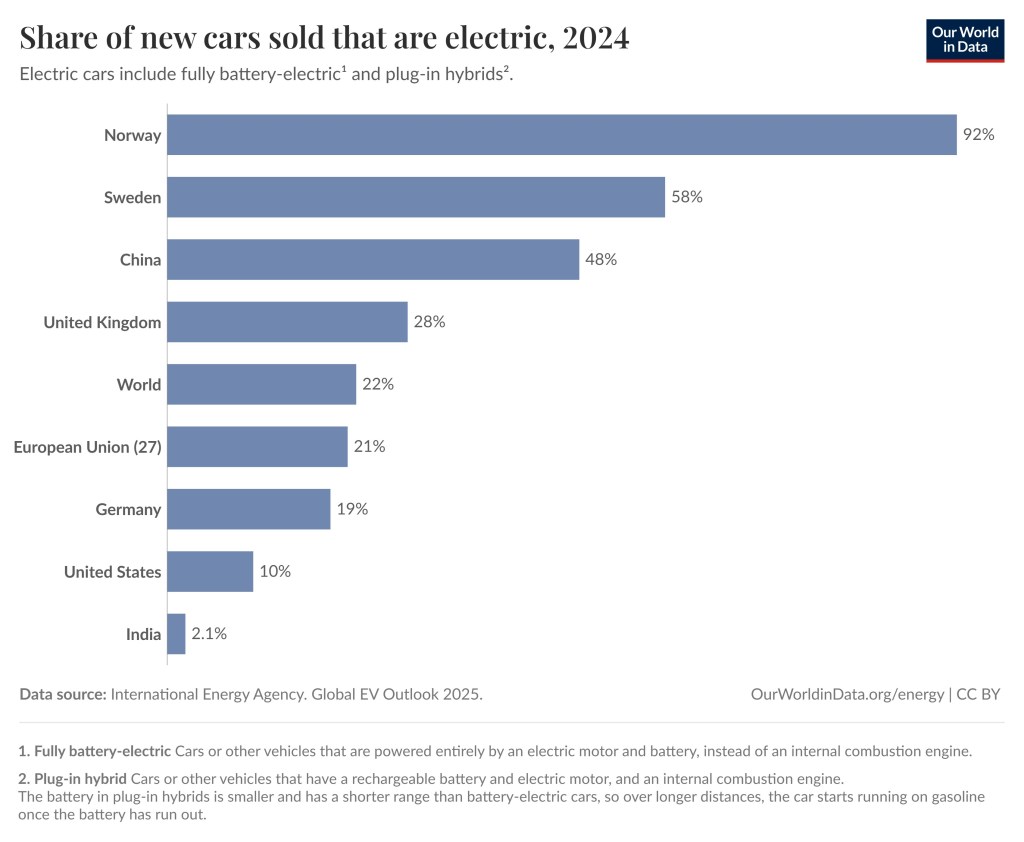
The graphs below show that the share of new cars that were sold in 2025 that were EVs was substantial, but more importantly there is a sharp upward slope of the curve(s). The share of new cars sold in 2025 that were electric was in respective region or country: Norway 97%, Denmark 71%, China 53%, European Union 27%, World 25%, the United States 10%. The graphs are taken from this page on the Our World in Data web page. I encourage you to play around with the interactive graphs. You can read more about new cars sales in Norway here.
It should be noted that electric cars include fully battery-electric and plug-in hybrids. With battery-electric cars is meant cars or other vehicles that are powered entirely by an electric motor and battery, instead of an internal combustion engine. With plug-in hybrid is meant cars or other vehicles that have a rechargeable battery and electric motor, and an internal combustion engine. The battery in plug-in hybrids is smaller and has a shorter range than battery-electric cars, so over longer distances, the car starts running on gasoline once the battery has run out.
This is a fact that is important, and that likely comes as a surprise to people living in countries that are lagging in this transition, such as the United States. Therefore, I consider it a super fact.
The Share of EVs
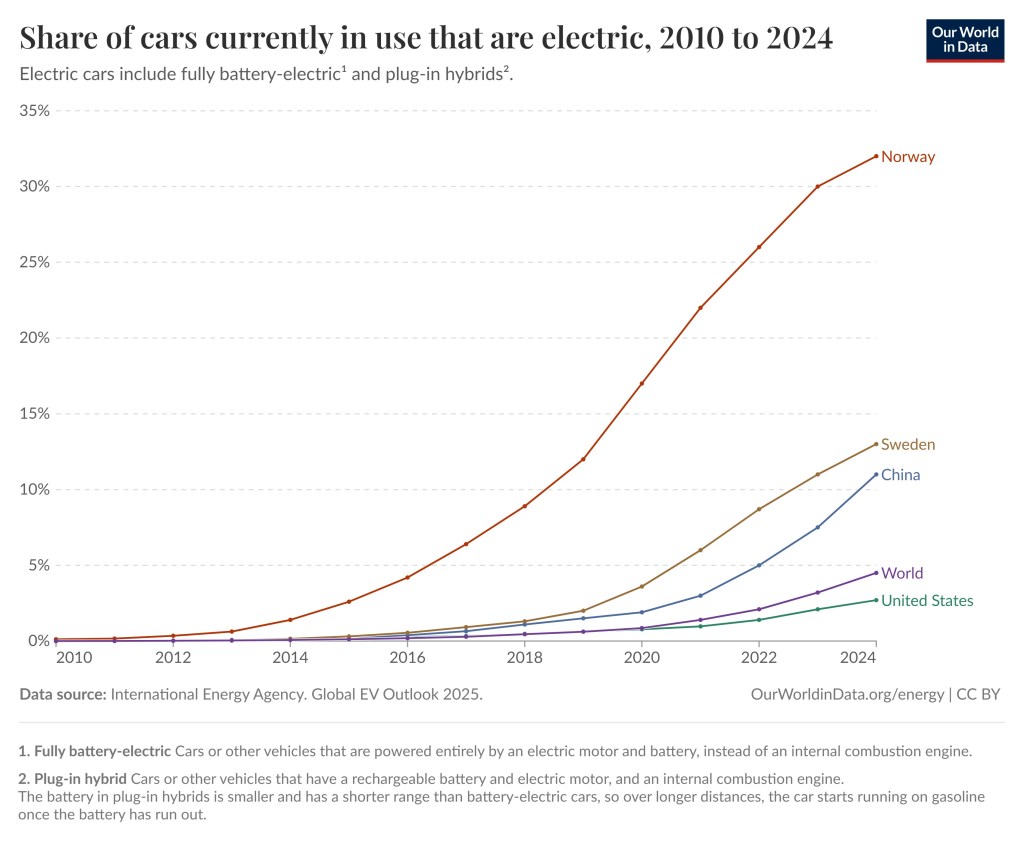
The sharp increase in the sale of electric cars is a recent phenomenon and therefore there are still a lot of ICE cars on the roads. Therefore, there is a significant difference between the share of electric vehicles on the road and the share of new cars sales being EVs. The share of electric cars on the roads in 2024 was in the United States 2.7%, in the world 4.5%, in China 11%, in Sweden 13% and in Norway 32%. See the graph below.
Share of cars currently in use that are electric, 2010 to 2024. Data source: International Energy Agency Global EV Outlook 2025. OurWorldinData.org/energy | CC BY
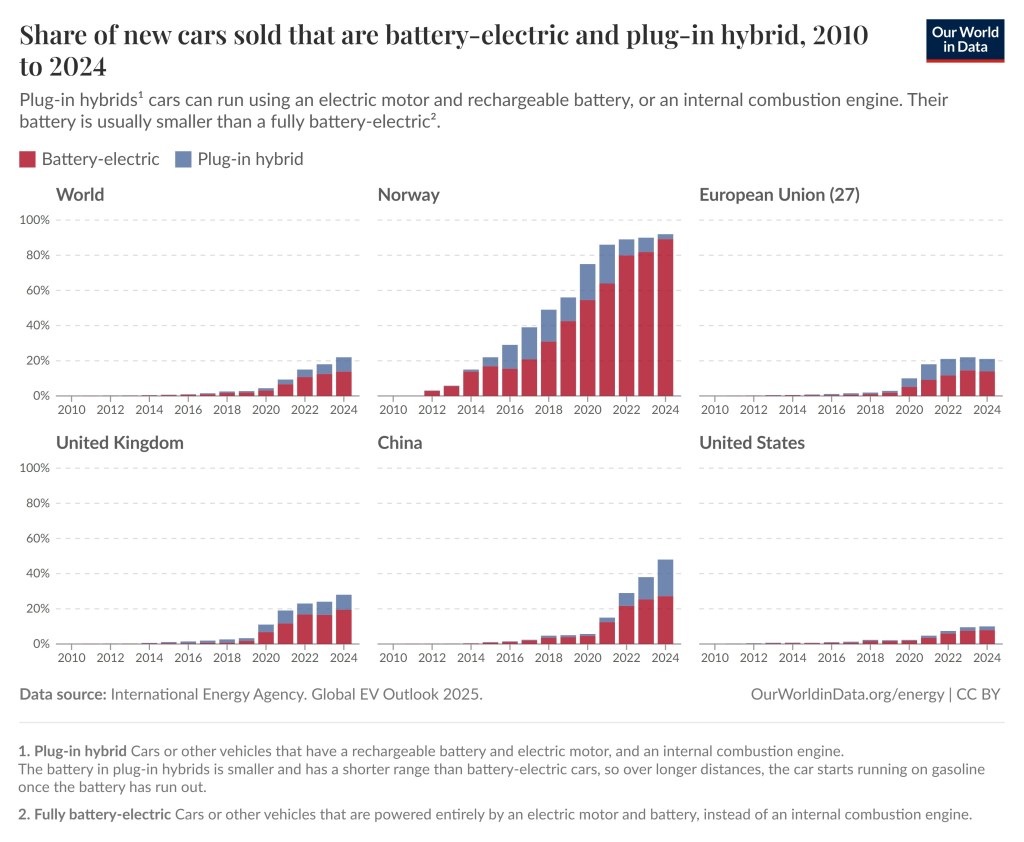
The graph below illustrates the sales of fully battery-electric cars versus plug-in hybrids.
The bar graph below is an alternative illustration showing the share of new cars sold that are electric in 2024 for the world and 8 countries.
Share of new cars sold that are electric, 2024. Electric cars include fully battery-electric and plug-in hybrids. Data source: International Energy Agency Global EV Outlook 2025. OurWorldinData.org | CC BY
This article states that there are now more new electric cars sold in the EU than ICEs. However, it should be noted that they include hybrids (non-plug-in) in this number.
Are EVs cleaner than ICE cars ?
Yes, they are, for the most part. EV Cars emit less pollution than Internal Combustion Engine Cars, even considering manufacturing, disposal and EV Cars being charged by dirty grids. Basically, this is because burning oil to move a vehicle creates significantly more heat than motion.
It all depends on how dirty the grid is. This map shows the average EV as a gasoline MPG equivalent for the different grid networks in the United States in 2020. As you can see an average EV corresponds to a 76 mpg gas car in Texas (with the ERCOT) grid, which is much cleaner than almost any gasoline car. Also, the ERCOT grid has become cleaner since 2020. The average for the United States is 91 mpg. There are a couple of grids for which owning an EV may not be cleaner. I created another super fact post that explains the details called: super fact (29) EV Cars Indeed Emit Less Carbon Pollution. You can read more here.
There are concerns about the mining of minerals for EV cars, such as cobalt and lithium, which has an environmental impact. However, this environmental impact should be compared to the environmental impact caused by the drilling and transport of oil (and the burning of gas/oil). In general, the environmental impact of EVs is considered much less. In addition, EV batteries last a long time, and 95% to 98% of the valuable materials in EV batteries (lithium, cobalt, nickel, and copper.) can be recycled/recovered. You can read about other EV myths here. However, this is probably a topic for a future super-fact.
Craigavad a scientist and fellow blogger, wrote a very well balanced and insightful article on the issue of the carbon cost of electric vehicles. I encourage you to read it : “The Carbon Cost of Electric Cars: are they worth it?”
Superfact 106: IPCC likely retiring the RCP8.5 emissions scenario does not mean that the IPCC backtracked on any climate science. It does not mean that climate change does not remain a serious and dangerous problem, and it definitely does not mean that global warming is not human caused.
The photo below was recently taken by the International Space Station proving once and for all that Earth is flat like a pancake. NASA issued a statement on Thursday stating that Earth being closely spherical in shape is a long standing hoax created by leftwing extremists.
Digital illustration of flat Earth. Shutterstock asset id: 797857906 by Amanda Carden
OK, that isn’t true. It sounds like an April 1st joke, doesn’t it? It is a joke, except it isn’t April 1st. However, a fairly recent survey showed that 10% of the US population believe Earth is flat, not roundish. Imagine you not understanding any of the evidence for Earth being round and imagine that you’ve never stood on a tall hill watching ships disappearing below the horizon and imagine you being surrounded by a lot of people who claim that Earth is flat. It would be easy for you to believe that Earth is flat like a pancake. Wouldn’t it? Trying to understand evidence and science is crucial to understanding the world.
When I was young, I was bamboozled into thinking Earth was 6,000 years old and that evolution was a hoax. Then I got a science education, and I had to abandon those beliefs. Later as a young adult, I was bamboozled again, this time by rightwing media, into thinking that global warming wasn’t happening, well at least not very much of it, but then I learned something about the related evidence and about climate science, and I had to abandon that misconception too.
When you do not know about or understand the evidence, you are easy to fool, and that includes you fooling yourself by misunderstanding articles you are reading. Science is not a well understood topic despite its high importance in today’s world. Conspiracy theories, anti-vaccine propaganda, creationism, anti-climate-science, and other anti-science is spreading fast today, and it is easy to get bamboozled. Anti-science has become a cultural phenomenon.
To us who understand a little bit of the evidence that we are causing climate change, the evidence is conclusive enough that claims that it isn’t us causing it, sound just like the flat Earth claim above. It sounds like an April 1st joke to us because we know something. On the other hand, if you don’t know about the evidence, then you are easy to fool, and you might easily jump to false conclusions. Watch your biases and wishful thinking and pay attention to what the experts in the field are saying, not politicians, not influencers, not Facebook memes.
Examples of evidence that we humans are causing climate / global warming / climate disruption (pick your preferred moniker) include satellites having directly measured our greenhouse gases trapping heat, the upper troposphere cooling whilst the lower troposphere is warming, a phenomenon explained by greenhouse gas emissions, the unnatural speed of the warming, the manner in which the warming happens (explained only by greenhouse gas emissions), and that possible natural causes such as the sun, orbital cycles / Milankovitch cycles cannot explain the current warming. Add isotope studies that show that the added greenhouse gases originate from burning fossil fuels and that volcanoes emit less than 1% CO2 of what we emit.
IPCC (Intergovernmental Panel on Climate Change) being likely to drop the so called RCP8.5 (or SSP5-8.5) scenario in the upcoming Seventh Assessment Report upon the suggestion of the Scenario Model Intercomparison Project has set off a flood of misinformation and misinterpretation. Not the least by politicians, notably our President, who made some very bizarre and clueless statements on the issue.
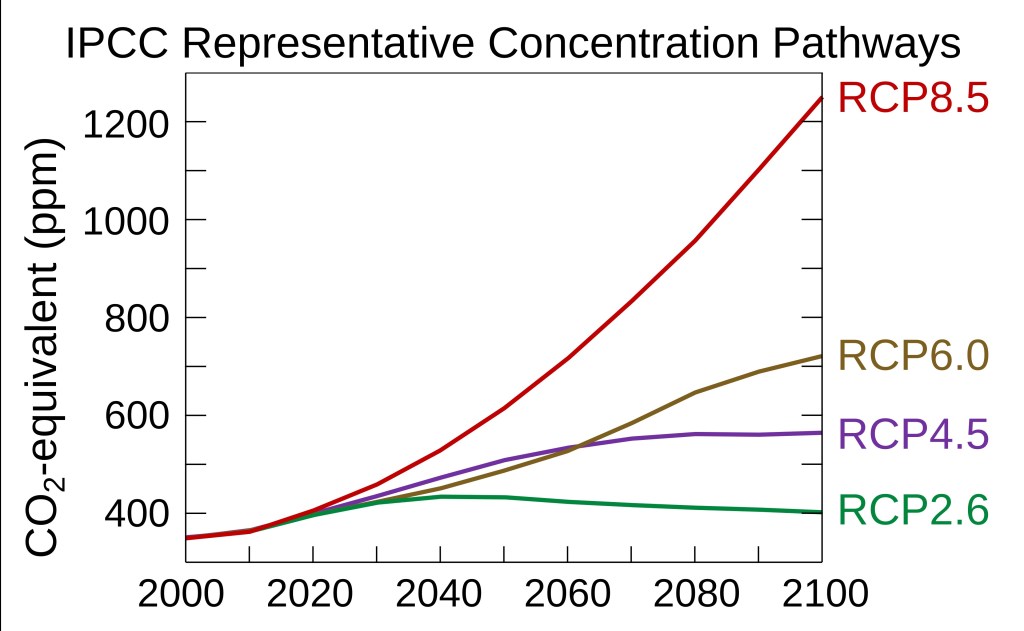
IPCC and the Scenario Model Intercomparison Project never stated that climate change is not caused by humans, or that climate change is not a serious problem. The Representative Concentration Pathways (RCPs) fundamentally depends on how much greenhouse gases we emit, as can be seen in the graph below. RCP8.5 corresponds to a very extreme scenario of burning enormous amount of coal. It was never a likely scenario to begin with, and it had become implausible due to the successful transitions to clean energy. That is why it makes sense to drop RCP8.5.
It was not because climate scientists were wrong about the climate science, or because environmentalists are exaggerating. In contrast to what many media outlets will tell you it is a vindication or victory for environmentalists. The global efforts to transition to clean energy have made it so that we can declare the worst of the worst scenario as implausible.
Different RCP scenarios result in different predicted greenhouse gas concentrations in the atmosphere (from 2000 to 2100). RCP8.5 would result in the highest greenhouse gas concentration (measured as CO2-equivalents). Efbrazil, CC BY-SA 4.0 https://creativecommons.org/licenses/by-sa/4.0, via Wikimedia Commons.
Since there are so much confusion, misinformation and hoopla surrounding this seemingly non-controversial event, I have reasons to consider the rectification of the misinformation a super-fact.
Official Statements on RCP8.5 by IPCC and the Scenario Model Intercomparison Project
It should also be noted that IPCC issues assessment reports based on research done by other organizations such as the Scenario Model Intercomparison Project. The IPCC does not conduct its own research. That is another common misrepresentation across media. It was not IPCC that decided to drop the RCP8.5 scenario, and the seventh assessment report has not yet been released. It was a suggestion by the Scenario Model Intercomparison Project published as a paper in Geoscientific Model Development, which stated “the CMIP6 high emission levels (quantified by SSP5-8.5) have become implausible, based on trends in the costs of renewables, the emergence of climate policy and recent emission trends”. You can read this paper here (and search for the quote).
Notice that the paper by the Scenario Model Intercomparison Project is NOT stating that global warming / climate change is not human caused. It does NOT state that it is not a serious problem. It does not in anyway imply anything like what the President and certain media outlets claim. There is additional reading from the Scenario Model Intercomparison Project here. You can read IPCC’s official comment on the issue here and its statement here. They were published May 20, 2026. The Washington Post and EOS provide some pretty accurate and easy to read explanations of what happened, for those wanting lighter reading.
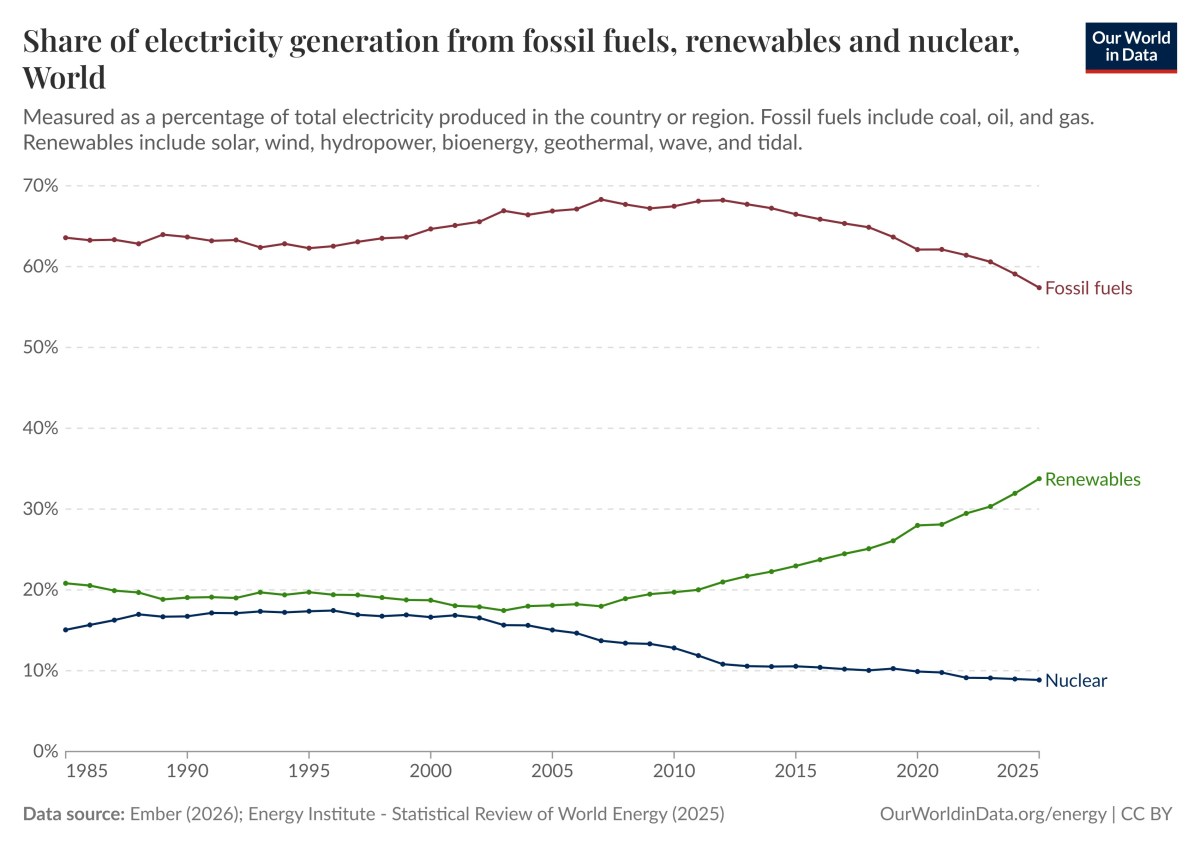
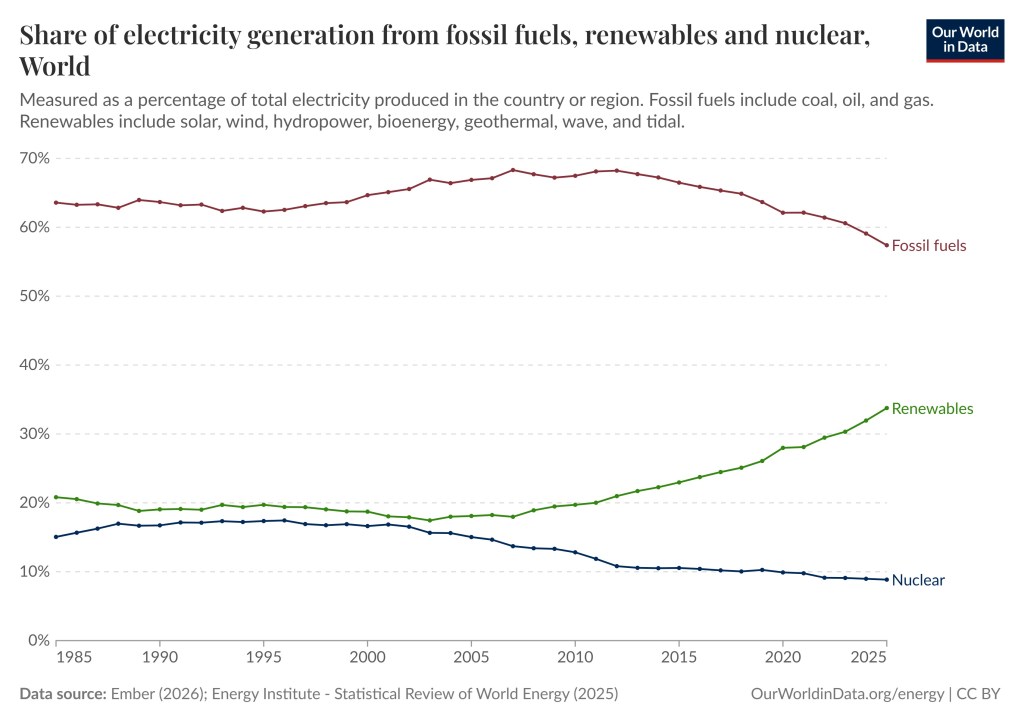
Superfact 100: The share of fossil fuels for electricity generation is decreasing and EVs are replacing internal combustion engines. The share of hydro and nuclear energy, which is clean energy, is decreasing, but the sharp increase in the share provided by renewables such as wind and solar is more than making up for it. In addition, there are new clean energy sources that are very promising but not yet widely implemented such as geothermal energy and fusion energy. The energy landscape is changing rapidly.
Share of electricity generation from fossil fuels, renewables and nuclear, world. Measured as a percentage of total electricity produced in the world. Fossil fuels include coal, oil and gas. Renewables include solar, wind, hydropower, bioenergy, wave and tidal. Data source Ember (2026): Energy institute – Statistical Review of World Energy (2025) OurWorldinData.org/energy | CC BY.
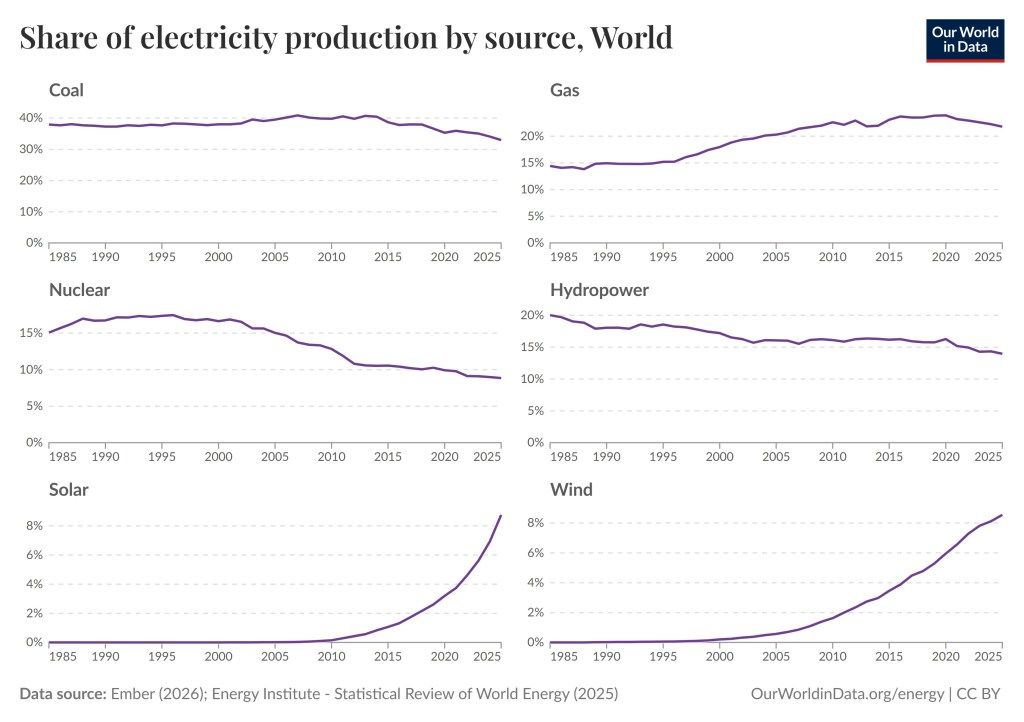
As can be seen in the graph above the share of electricity in the world generated by fossil fuels has gone down in recent years (from 66.48% in 2015 to 57.39% in 2025), and the share of electricity generated by nuclear has also gone down (from 10.55% in 2015 to 8.85% in 2025) whilst the share of electricity generated by renewables has increased (from 22.97% in 2015 to 33.76% in 2025). This is even though the most prominent source of renewable energy, hydro, has decreased its share substantially (from 16.2% in 2015 to 14% in 2025) as can be seen in the graph below.
What is going on is that two sources of renewable energy, wind and solar, have increased their share of electricity generated substantially (wind: from 3.5% in 2015 to 8.5% in 2025) and (solar: from 1.1% in 2015 to 8.7% in 2025), which can be seen in the graph below. It should be noted that renewable energy encompasses solar, wind, hydropower, bioenergy, geothermal, wave, and tidal sources.
To play around with the graph above and other similar graphs click here and select and look at the bottom charts. To play around with the graph below and similar graphs click here and select and look at the bottom charts.
Share of electricity production by source, World. Data source (2026): Energy Institute – Statistical Review of World Energy (2025) OurWorldinData.org/energy | CC BY.
So far, I’ve been talking about the share of electricity production in the world by different energy sources. However, the world is using more and more electricity. Populations are growing, economies are growing, and the world is electrifying, for example, because of the worldwide adaption of EVs.
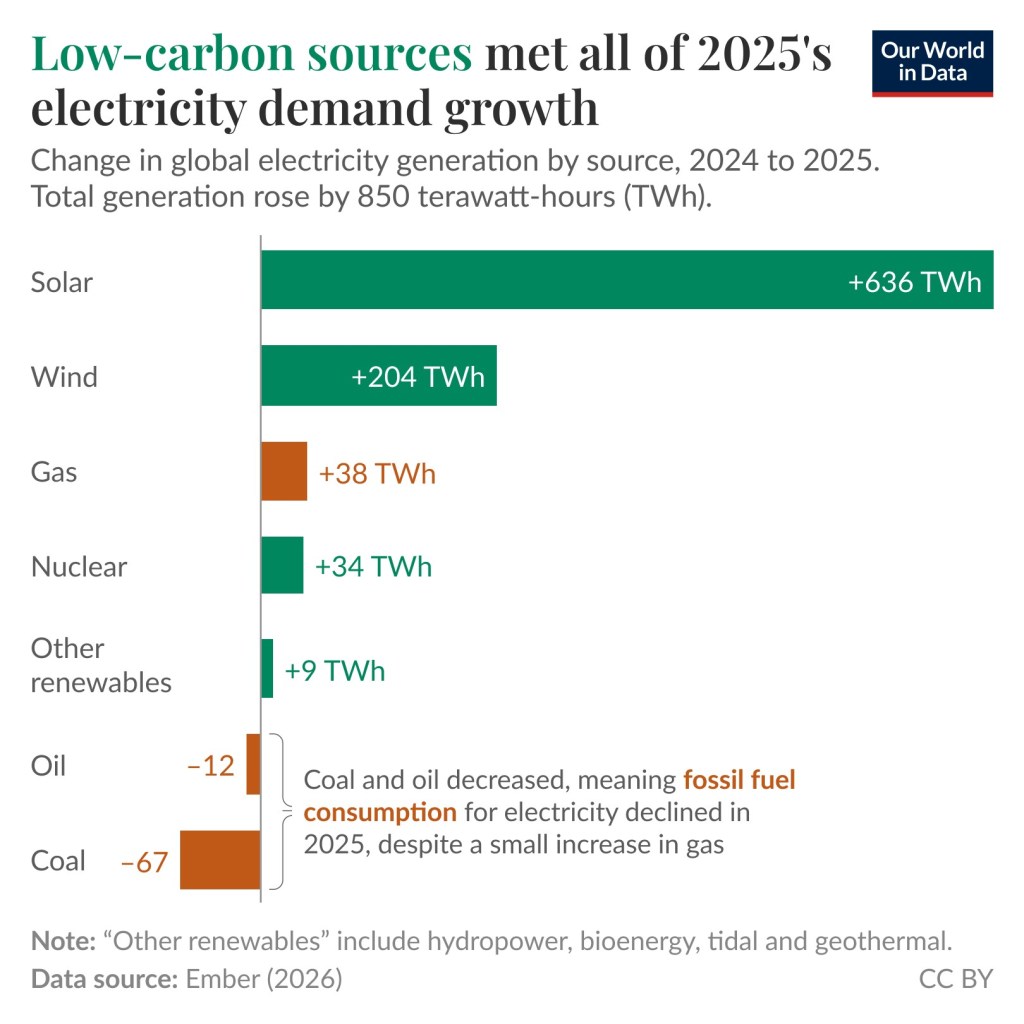
Just because an energy source’s share of electricity production is decreasing does not mean its total global electricity generation by that source is decreasing. In fact, as the share of electricity production by fossil fuels has decreased, the total production of electricity by fossil fuels has increased, well up until now. For the first time in history the total global electricity generation by fossil fuels went down in 2025. Note that since coal and oil decreased in the graph below fossil fuel consumption for electricity declined in 2025, despite s small increase in gas. This means that the use of fossil fuels is finally decreasing.
Low carbon sources met all of 2025’s electricity demand growth. Change in global electricity generation by source, 2024 to 2025. Total generation rose by 850 terawatt-hours (TWh). Note: “Other renewables” include hydropower, bioenergy, tidal and geothermal. Data source: Ember (2026). This graph comes from this page.
The practice of burning fossil fuels to generate electricity and for transportation is becoming less dominant. I believe this fact is surprising to many people, especially Americans since the current administration has taken a strong anti-renewable and anti-climate-science stance, and many Americans are not aware of what is happening in the rest of world in this regard. Superfact #100 is a super fact because the data is reliable, it is surprising to many people, and it is important.
It should be noted that we will likely keep using fossil fuels to produce fertilizers, plastics, medicines, and chemicals for a long time. However, this corresponds to only a few percent of our current use of fossil fuels and seems to be a lot better use of fossil fuels than burning it all up for energy. In fact, we may need the remaining fossil fuels for that purpose. In this post I am using data provided by Our World in Data which in turn got data from Ember Energy, or the International Energy Agency.
The Current Administration’s Opposition to Renewables and Climate Science
I am trying to keep politics out of my blog. However, the current administration’s strong opposition to and the misinformation they disseminate about renewables and climate science makes it difficult to discuss this renewable energy without bringing it up. It is an important piece in our understanding of what is going on. The misinformation about climate science (and other scientific topics) has bamboozled a lot of people and the actions taken to hinder the deployment of renewables have had real consequences. However, it is important to remember that the current situation here in the US is temporary and has a limited impact on the rest of the world.
Some actions that current administration has taken are:
Science organizations such as NOAA and NFS-NCAR have had their budgets severely cut and have been threatened to be dismantled. Websites related to climate science have been taken down. Click here to read more. NASA is also threatened to have its science programs severely cut (by 47%), as well as other programs, but it has not yet been implemented. Click here to read more.
Restricting or ordering the freezing of permits for renewables, canceling tax credits and investment credits for renewables, ordering the cancelation of renewables under construction, for additional information click here, or here.
In 2009 the EPA found that atmospheric concentrations of greenhouse gases endanger both current and future generations, enabling EPA to regulate greenhouse gases. This, so called endangerment finding was overturned in February 2026 by the administration. This article explain why there is no Scientific justification to revoke the endangerment finding.
The administration paid one billion dollars to France’s TotalEnergies in exchange for not developing windfarms on the east coast (kind of a bribe).
Pentagon has frozen permitting since last August halting more than 250 onshore wind projects, including those on private land, which is not only preventing us from meeting our energy needs, but is indirectly a violation of private property rights.
The United States is the only country to have withdrawn from the Paris Agreement (January 27, 2026). Three other countries, Iran, Libya, and Yemen, did not join.
95,000 employees, including 10,000+ with PhD’s, at government science agencies (more than a third of them) have either been laid off / fired, or left, as a result of current policies. This effects CDC, NIH (National Institute of Health), and especially anything related to climate science. Many scientists have left the US for Europe.
There is not wonder many in the United States incorrectly believe clean energy is on its way out. I should say that even though support for solar and wind has declined in the US, solar and wind remain the sources of energy that most people want the federal government to encourage over any other source of energy, according to this Pew Research article.
Important Climate and Energy Facts
As I said, the misinformation about climate science has bamboozled a lot of people. As an example. We know that climate change / global warming is happening. We have also known for several decades that the current climate change / global warming is not natural. It is caused by us, chiefly due to the burning of fossil fuels. The scientific evidence is conclusive. It includes satellites directly measuring our greenhouse gases trapping heat, the upper troposphere is cooling whilst the lower atmosphere is warming, showing that the heating is from greenhouse gases, the unnatural speed of the warming, isotope studies, climate models, etc. How many people know about this? I believe very few people do. Below are eleven related super facts.
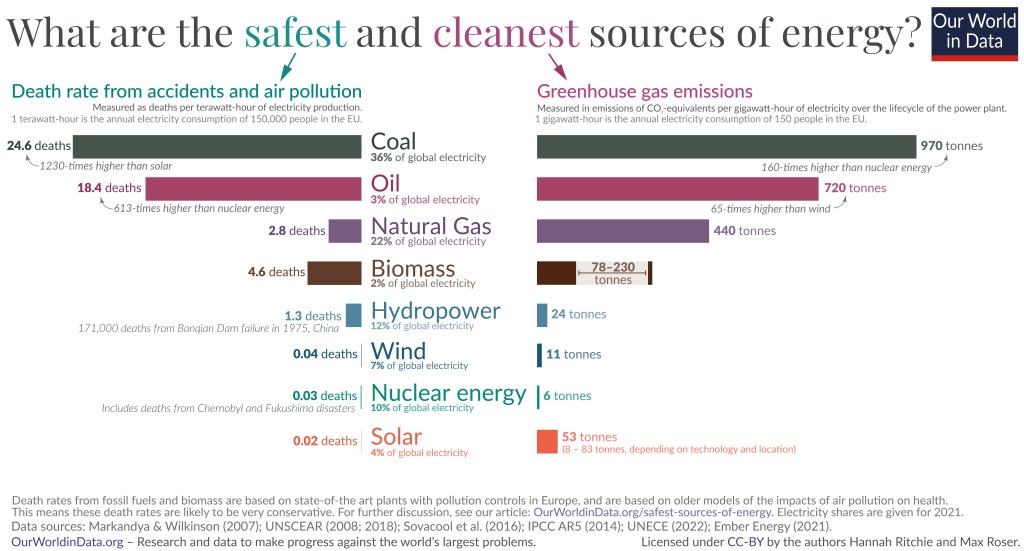
Greenhouse gas emissions and death rates from various sources of energy. Fossil fuels and biomass are based on state-of-the art plants with pollution control in Europe and are based on older models of the impacts of air pollution on health. This means that these death rates are likely to be very conservative. The graph shows that renewables and nuclear are the cleanest and safest forms of energy. For further discussion see the article: OurWorldinData.org/safest-sources-of-energy. Electricity shares are given for 2021. Data sources: Markandya & Wilkinson (2007); UNSCEAR (2008: 2018); Sovacol et al. (2016); IPCC AR5 (2014); UNECE (2022); Ember Energy (2001). OurWorldinData.org – Research and data to make progress against the world’s largest problems. Licensed under CC-BY by the authors Hannah Ritchie and Max Roser. Citation : Hannah Ritchie (2020) – “What are the safest and cleanest sources of energy?” Published online at OurWorldinData.org. Retrieved from: ‘https://archive.ourworldindata.org/20260202-100556/safest-sources-of-energy.html’ [Online Resource] (archived on February 2, 2026).
The Share of EVs
Another phenomenon that results in less burning of fossil fuels than we otherwise would have is that electric cars and plug-in hybrid are becoming more common in the world. Going from nearly non-existent in 2010 electric cars (EVs) are now starting to show up around the world. The share of electric cars on the roads in 2024 was in the United States was 2.7%, in the world 4.5%, in China 11%, in Sweden 13% and in Norway 32%.
What matters more (for the future) is the sale of new EVs and plug-in hybrids. The share of new cars that are electric was 22% for the world, 10% in the United States, 21% in the EU, 28% in the United Kingdom, 48% in China, 58% in Sweden, 92% in Norway. In 2025 the share of new cars that were electric was 98% in Norway according to this website. To see more EV statistics and play around with various graphs visit this link.
One thing that might be surprising to Americans is that EVs are quite common in many other countries including EU, the Scandinavian countries, and China. Another is that EVs are indeed significantly cleaner than internal combustion engines, even when charged from a relatively dirty grid. See this super fact (29) EV Cars Indeed Emit Less Carbon Pollution.
Share of cars currently in use that are electric, 2010 to 2024. Electric cars include fully battery-electric and plug-in hybrids. With battery-electric cars is meant cars or other vehicles that are powered entirely by an electric motor and battery, instead of an internal combustion engine. With plug-in hybrid is meant cars or other vehicles that have a rechargeable battery and electric motor, and an internal combustion engine. The battery in plug-in hybrids is smaller and has a shorter range than battery-electric cars, so over longer distances, the car starts running on gasoline once the battery has run out. Data source: International Energy Agency Global EV Outlook 2025. OurWorldinData.org/energy | CC BYBattery-electric cars are depicted with brown and plug-in hybrid in blue. Share of new cars sold that are battery-electric and plug-in hybrid, 2010 to 2024. Plug-in hybrids cars can run using an electric motor and rechargeable battery, or an internal combustion engine. Their battery is usually smaller than a fully battery-electric. Data source: International Energy Agency Global EV Outlook 2025. OurWorldinData.org/energy | CC BYShare of new cars sold that are electric, 2024. Electric cars include fully battery-electric and plug-in hybrids. Data source: International Energy Agency Global EV Outlook 2025. OurWorldinData.org | CC BY
Share of electricity production by source EU, US, China
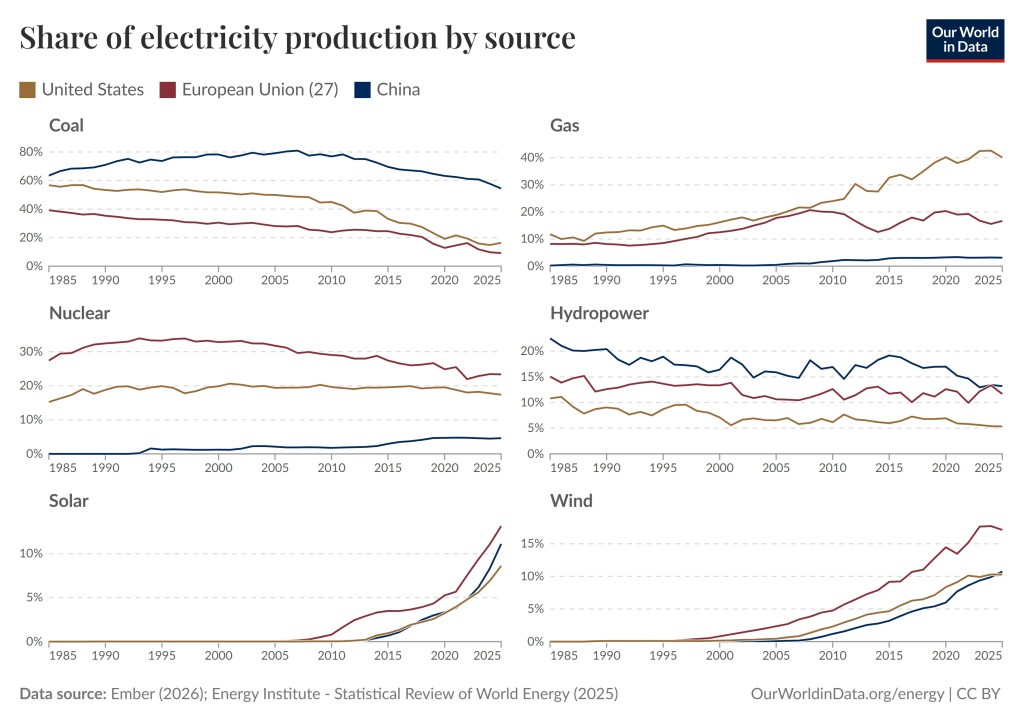
The first graph in this post depicted the share of electricity production by source for the world. The graph below breaks it up to show the share of electricity production by source for the three largest economies in the world, the United States, China and the EU. Again, the share of energy from coal, nuclear and hydro is decreasing whilst the share from wind and solar is going up for all three markets. One notable difference from the top graph is that gas keep increasing for the United States.
Share of electricity production by source, United States, European Union, and China. Data source: Ember (2026): Energy Institute – Statistical Review of World Energy (2025) OurWorldData.org/energy | CC BY
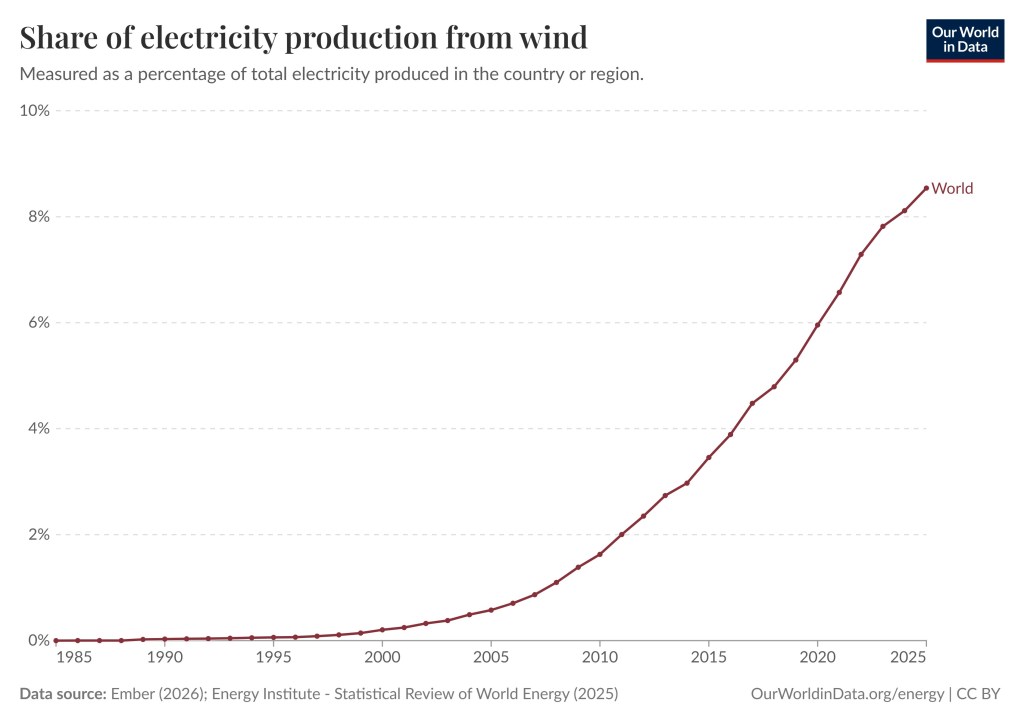
The Share of Electricity Production from Wind
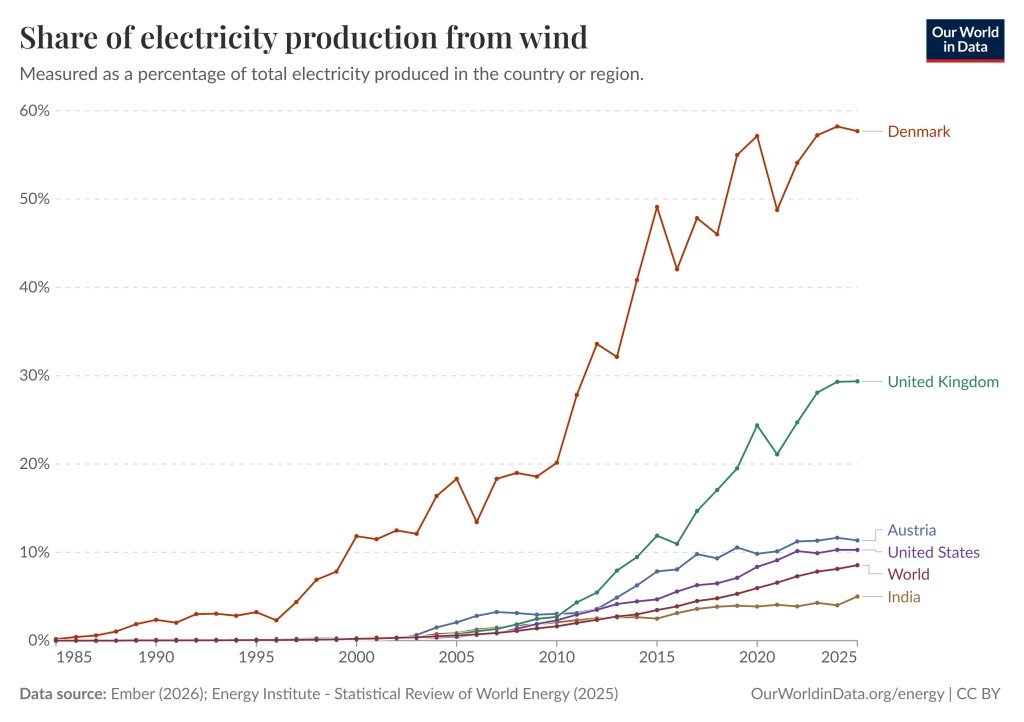
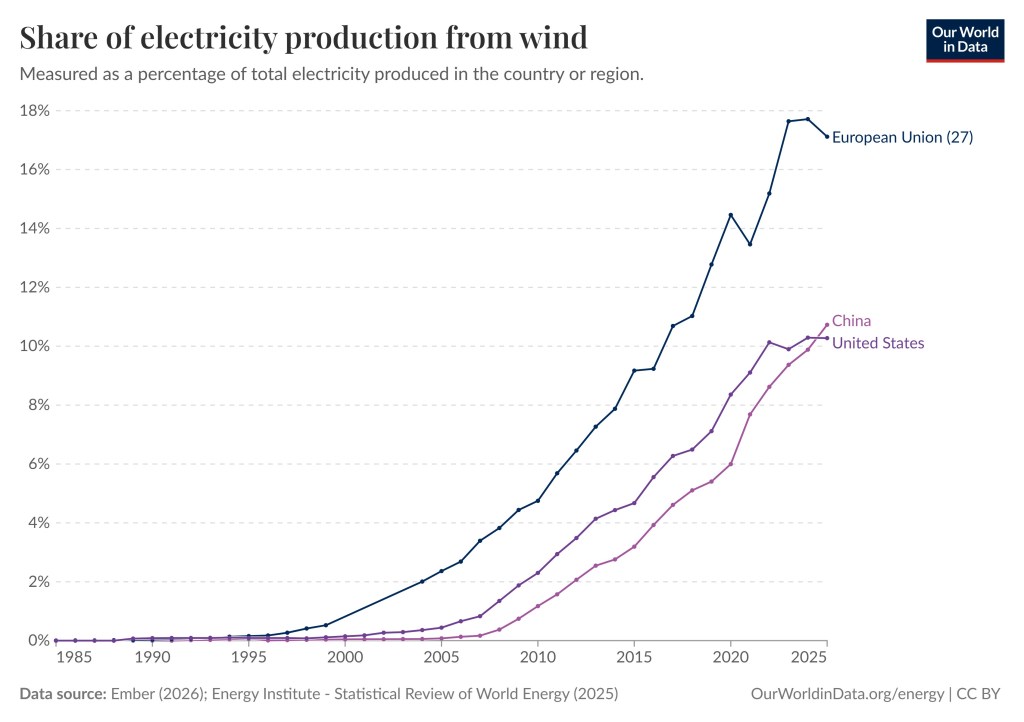
Below are a few charts depicting the share of electricity production from wind. The first graph is already included in the second chart from the top (above). However, this is a close up. The second graph depicts the share of electricity production from wind for multiple countries. It should be noted that Denmark and the United Kingdom are prominent users of wind power. For Denmark the share of electricity production from wind is almost 60%. By clicking here you can play around with the graphs and generate as many different graphs as you wish.
Share of electricity production from wind. Measured as a percentage of total electricity produced in the world. Data source: Ember (2026): Energy Institute – Statistical Review of World Energy (2025) OurWorldinData.org/energy | CC BYShare of electricity production from wind. Measured as a percentage of total electricity produced in the country or region. Data source: Ember (2026): Energy Institute – Statistical Review of World Energy (2025) OurWorldinData.org/energy | CC BYShare of electricity production from wind. Measured as a percentage of total electricity produced in the United States, China and the European Union. Data source: Ember (2026): Energy Institute – Statistical Review of World Energy (2025) OurWorldinData.org/energy | CC BY
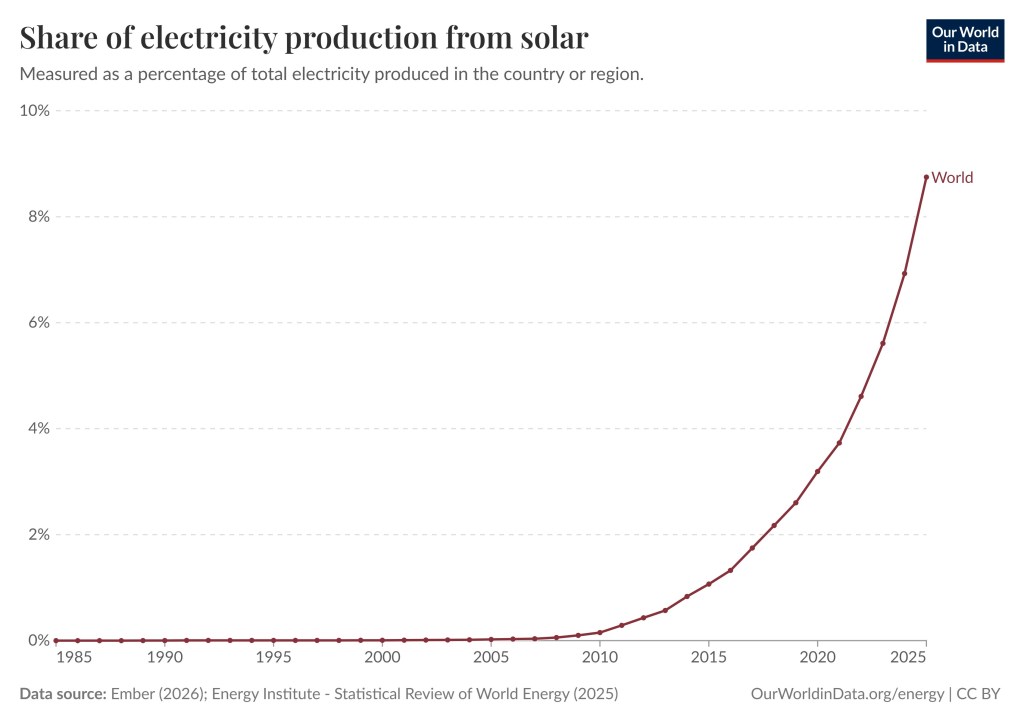
The Share of Electricity from Solar
The share of electricity from Solar for the world has grown from essentially 0% in the year 2000 to 3.19% in 2020 to 8.75% in 2025. For solar, the United States follows the rest of the world closely. Some countries have a higher percentage, such as the Cook Islands – 50%, Luxembourg – 30.52%, Chile – 25.06%. If you wish you can take a look here, or here, and you can play around with the different graphs. You can create millions of scenarios at your pleasure.
Share of electricity from Solar. Measured as a percentage of total electricity produced in the country or region. Data source: Ember (2026): Energy Institute – Statistical Review of World Energy (2025) OurWorldinData.org/energy | CC BY
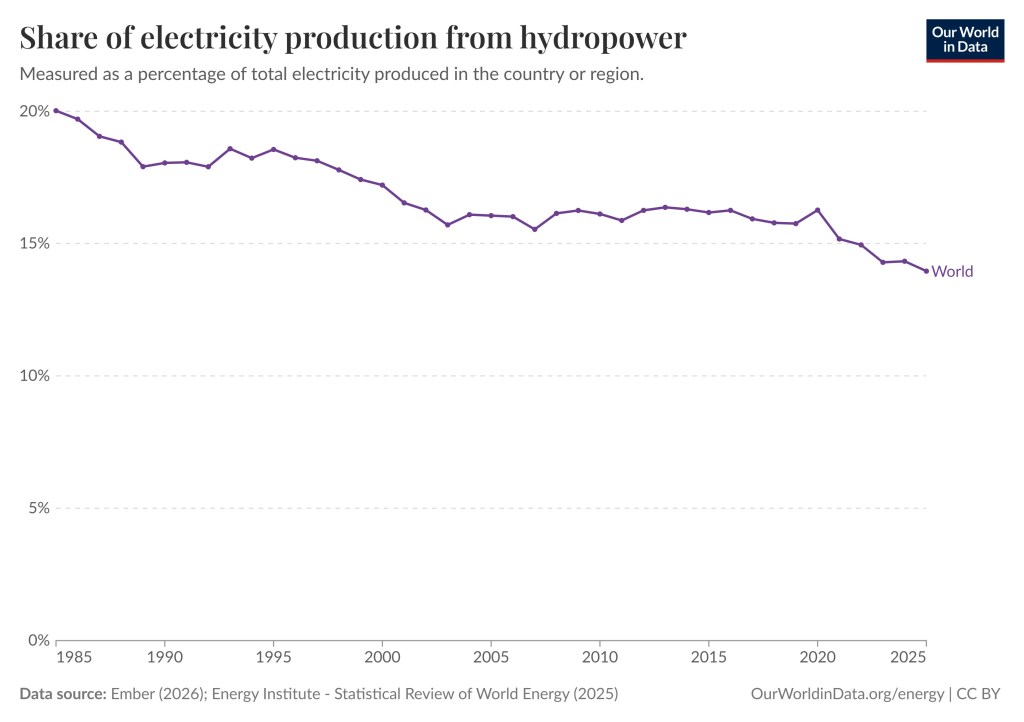
The Share of Electricity Production from Hydropower
Hydro is a renewable energy source but its share of electricity production in the world has gone down. Unlike solar and wind, hydro is not an intermittent source of energy, so that is not necessarily something to celebrate. The intermittency of solar and wind can be mitigated using batteries, or energy sources that are not intermittent, preferably clean energy sources such as hydro and nuclear. Hydro is still the world’s most popular renewable energy source but that is changing quickly.
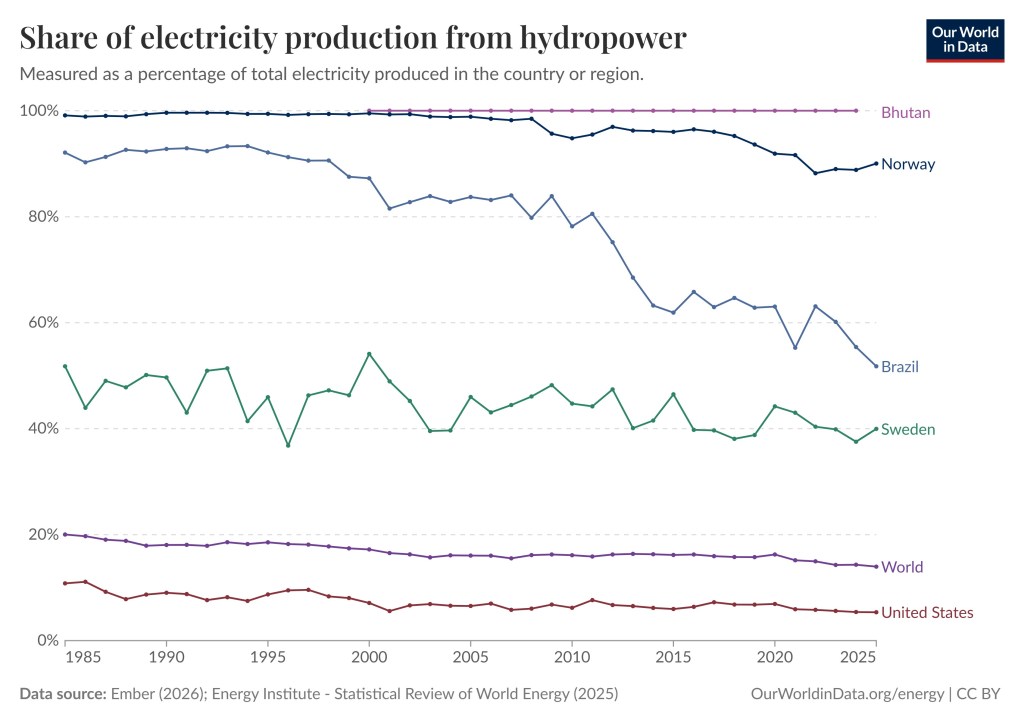
The graph below shows that the share of electricity production from hydropower for the world is 13.96%, USA 5.35%, Bhutan 100%, Norway 90.03%, Brazil 51.78%, Sweden 39.97%. If you wish you can take a look here, or here, and you can play around with the different graphs. You can create millions of scenarios at your pleasure.
Share of electricity production from hydropower. Measured as a percentage of total electricity produced in the world. Data source: Ember (2026): Energy Institute – Statistical Review of World Energy (2025) OurWorldinData.org/energy | CC BYShare of electricity production from hydropower. Measured as a percentage of total electricity produced in the world and five countries (Bhutan, Norway, Brazil, Sweden, United States). Bhutan remains at 100% hydro, Norway went from 99.12% in 1985 to 90.03% in 2025, Brazil went from 92.10% hydro in 1985 to 51.78% in 2025, Sweden went from 51.76% hydro in 1985 to 39.97% in 2025, the United States went from 10.81% hydro in 1985 to 5.35% in 2025. The world went from 20.02% hydro in 1985 to 13.96% in 2025. Data source: Ember (2026): Energy Institute – Statistical Review of World Energy (2025) OurWorldinData.org/energy | CC BY
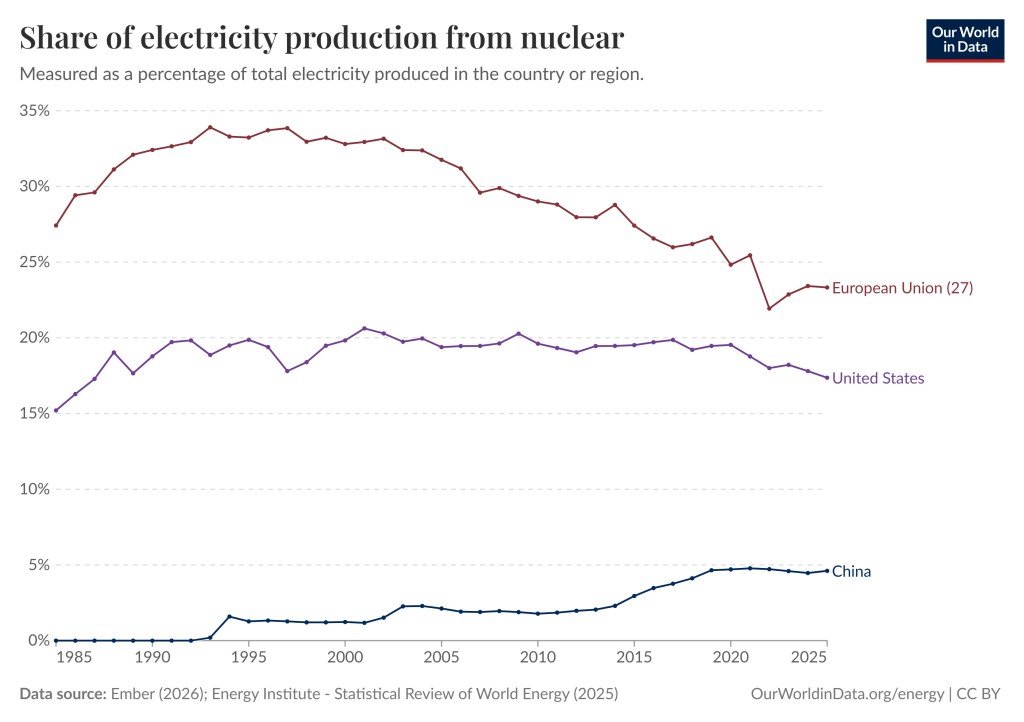
The Share of Electricity Production from Nuclear
The share of electricity production in the world from nuclear went down from 15.06% in 1985 to 8.85% in 2025, which is a significant drop. During the same time the share of electricity production from nuclear in the United States went from 15.20% in 1985 to 17.36% in 2025, for China the numbers are 0% in 1985 to 4.61% in 2025, and for EU the share of electricity production in 1985 was 27.42% and in 2025 23.32%. However, in 1993% the share of electricity production in 1993 was 33.90%.
So, nuclear has taken a big step back in EU. Germany cancelled nuclear power entirely, for better and for worse. To interact with the graphs shown below or see other (millions) related charts or maps click here, or here.
Share of electricity production from nuclear. Measured as a percentage of total electricity produced in the world’s three largest economies, the United States, EU, and China. Data source: Ember (2026): Energy Institute – Statistical Review of World Energy (2025) OurWorldinData.org/energy | CC BY
Geothermal a Promising source of Energy
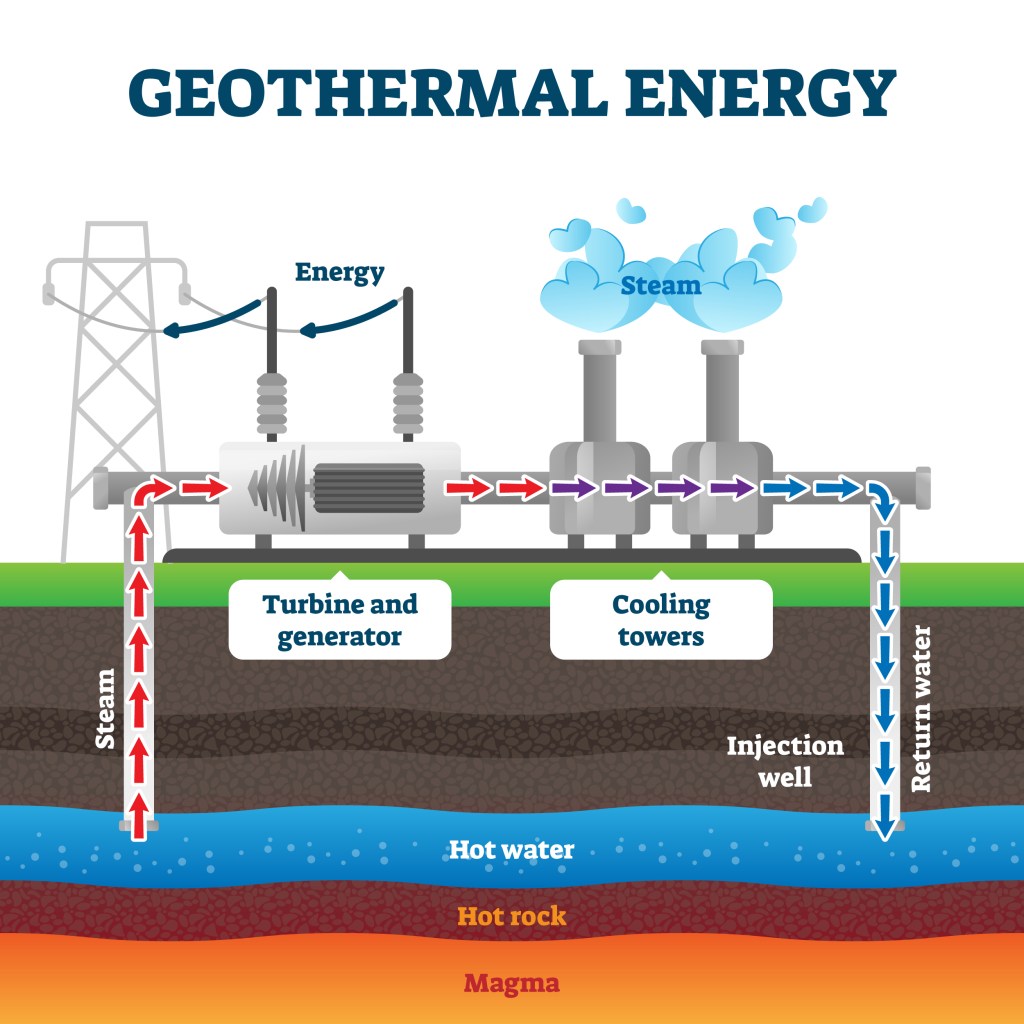
Another reason to believe that the energy transition away from fossil fuels has begun, is that in addition to fossil fuels losing share of total electricity produced, there are promising emerging renewables, such as Geothermal energy. Geothermal energy uses natural heat from deep within the Earth to generate electricity or heat buildings. Wells tap into underground hot water/steam reservoirs, forcing it up to spin turbines that power generators, after which the water is cooled and reinjected to replenish the source (see the picture below).
Geothermal energy production example diagram illustration. Industrial renewable green energy plant example. Steam flow from the underground hot water to turbine generator and cooling towers. Shutterstock Asset id: 1637621995 by VectorMine.
Just like renewables geothermal energy is low emissions energy source but unlike renewables it is not an intermittent energy source. It is as of yet not widely used and not cost effective. However, it appears that might change soon. The advanced drilling techniques needed are utilizing oil and gas expertise and could therefore provide a good transition from fossil fuels to geothermal.
Geothermal power plant from above Shutterstock Asset id: 2539157855 by Alrasyiqin
Is Fusion Power the Future ?
Fusion power is a clean, and near-limitless energy source generated by smashing light atomic nuclei together, usually hydrogen isotope, to form heavier ones. It is a form of nuclear power that releases immense heat. It replicates the process that powers the Sun. Unlike wind and solar it is not intermittent and can generate carbon-free baseload electricity without long-lived radioactive waste. However, it cannot yet be used to produce energy. That does not mean it will not work in the future.
Nuclear fusion power generator concept image, 3d rendering Shutterstock asset id: 2262106105 by MeshCube.
Conclusion
The share of fossil fuels for electricity generation is decreasing despite the fact that the share from hydro and nuclear is also decreasing. The reason is the spectacular increase in the share provided by wind and solar. In addition, EV cars are rapidly replacing internal combustion cars around the world, especially in the EU and China. There are also renewable or clean energy sources that show great promise even though they are not yet widespread. This means that fossil fuels, coal, natural gas, and oil, which are all dirty and dangerous energy sources, are finally being replaced by cleaner alternatives.