The goal of this blog is to create a list of super facts. Important facts that are true with very high certainty and yet surprising, misunderstood, or disputed by many. This blog aims to be challenging, educational, and fun, without it being clickbait. I determine veracity using evidence, data from reputable sources and longstanding scientific consensus. Prepare to be challenged (I am). Intentionally seek the truth not confirmation of your belief.
Category: Super fact
This post is about a super-fact. The goal of this blog is to create a list of facts or insights that are important and not trivia, known to be true, and yet highly surprising, shocking, amazing, or widely disputed amongst the public but not disputed among the scientists or experts in the relevant fields. However, not all of my posts are super-facts. This category distinguishes posts that are super-facts.
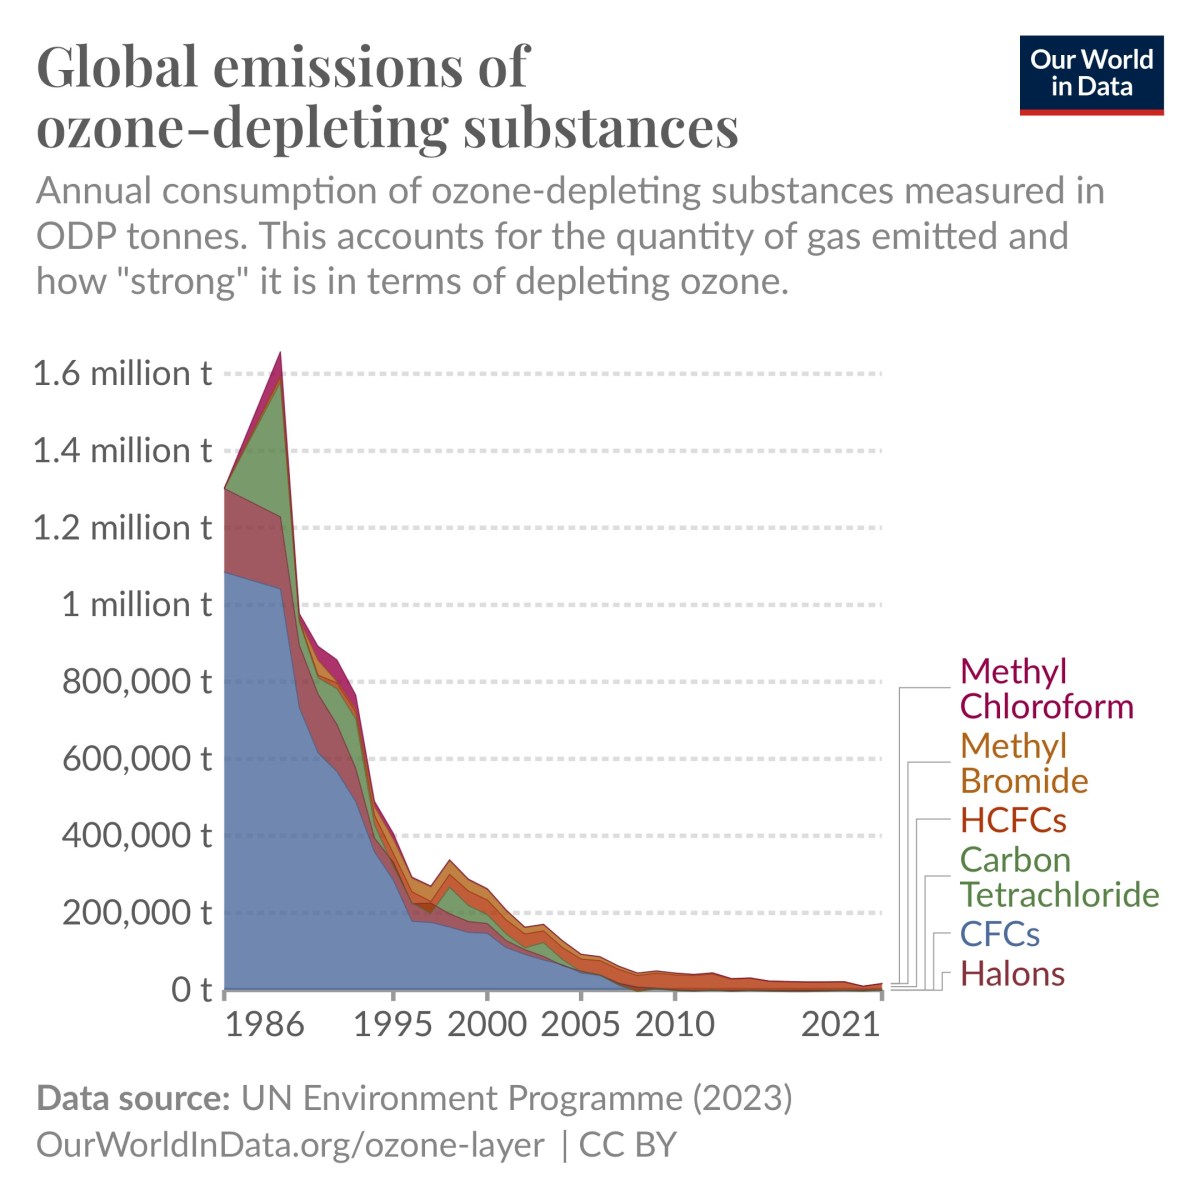
Super fact 41 : Largely thanks to the Montreal Protocol in 1987 the emissions of ozone-depleting gases have fallen by more than 99%, 99.7% to be exact, according to Our World in Data. This has resulted in halting the expansion of the ozone holes and the reduction in emissions of ozone-depleting gases is saving millions of lives every year.
This is my good news for Earth Day, and it is a super fact. It is a super fact because a lot of people believe that the issue with ozone depleting gases and Montreal protocol is bunk. They take the fact that we are not talking about it much nowadays as evidence that there was nothing to it in the first place. However, they are wrong. We typically don’t talk much about environmental problems that have been addressed successfully. The Antarctic ozone hole that we used to worry about is still there, but its worrisome expansion has been halted.
The Reduction of Ozone-Depleting Gases
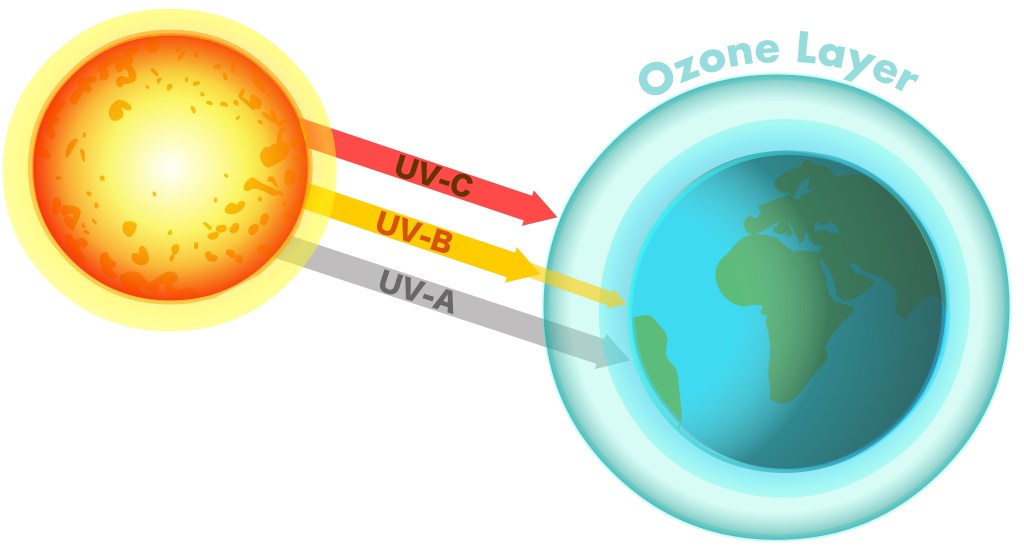
The ozone layer, located in the stratosphere, protects Earth from harmful UV radiation. Ozone (O3) is naturally created and destroyed in a balance, but ozone-depleting substances damage the ozone layer by releasing chlorine atoms that catalyze the destruction of ozone molecules.
This problem was discovered by Mario Molina and F. Sherwood Rowland in 1974. They were awarded the 1995 Nobel Prize in Chemistry, along with Paul Crutzen, for their work in atmospheric chemistry. Examples of ozone depleting gases are chlorofluorocarbons (CFCs), hydrochlorofluorocarbons (HCFCs), halons, methyl chloroform ,methyl bromide, carbon tetrachloride, hydrobromofluorocarbons, and chlorobromomethane.
Ozone layer depletion diagram. Earth’s sunscreen, shielding us from the sun’s harmful ultraviolet rays. UV A, B, C. UVA, UVB, UVC.
Ozone depletion causes a breakdown of the ozone layer around the world, including the famous Arctic and Antarctic ozone holes. This allows more UV radiation to reach Earth surface, increasing the exposure to harmful ultraviolet (UV) radiation, which can cause skin cancer, cataracts, and immune system damage.
It also harms plants and marine life, as well as climate. It should be noted that this is a different problem from climate change or if you call it global warming, even though ozone depletion to some degree influence climate change. You can read about climate change related super facts here, here and here.
The Reduction of Ozone-Depleting Gases
The good news is that we have been very successful in reducing ozone depleting gases. The Montreal protocol, a landmark international agreement signed in 1987 to protect the Earth’s ozone layer by phasing out ozone depleting gases, has been very successful.
As you can see in the diagram below from Our World in Data. We have had at least a 99% reduction in ozone depleting gases according to the NASA, the World Economic Forum and the UN Environment Program. More specifically, the reduction is 99.7% by 2018 according to Our World in Data.
The phase out of six ozone depleting gases. Data source UN Environment Program (2023).
443 million Cases of Skin Cancer Prevented
The NIH estimate that the Montreal Protocol has prevented 443 million cases of skin cancer, 2.3 million skin cancer deaths, and 63 million cases of cataracts in the United States alone. Globally, it is estimated that the Protocol has saved an estimated 2 million people from dying from skin cancer each year.
Yes, you can read that again :
Worldwide the Montreal Protocol has saved an estimated 2 million people from dying from skin cancer each year.
To read more about the Montreal Protocol and the ultimate repair job click here.
The Antarctic Ozone Hole
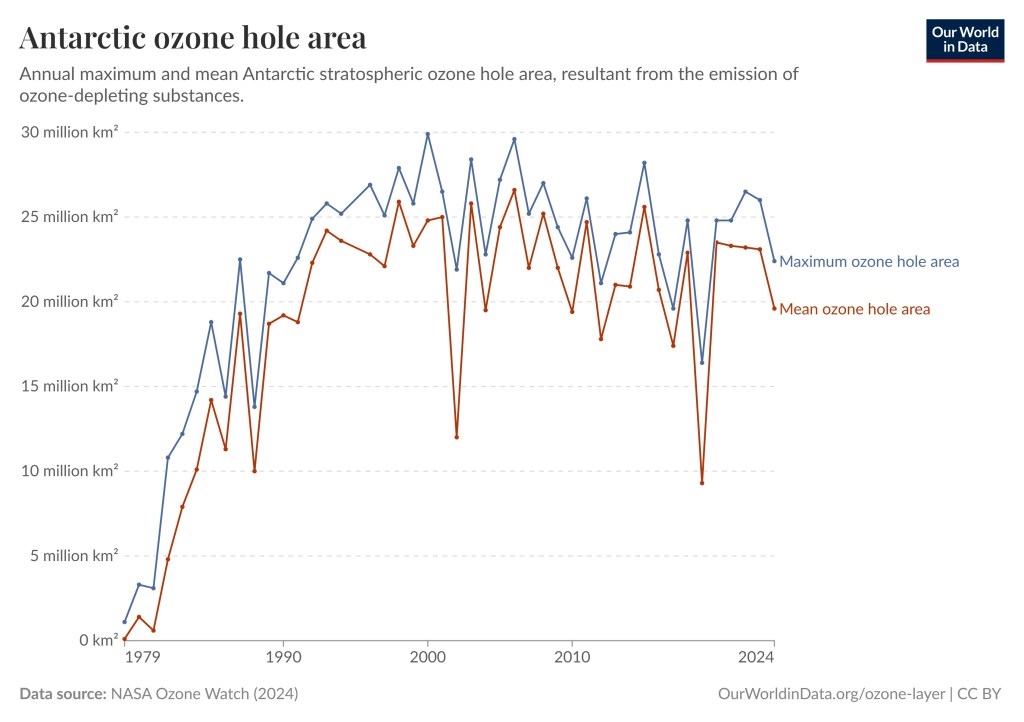
What about the Arctic and Antarctic ozone holes? Well, they are not gone but they are retreating. When there is an environmental problem, it does not entirely disappear right away even if you remove the root cause. The same is true for global warming. If we succeeded to stop all carbon emissions tomorrow it would take decades for average temperatures to stop rising and hundreds of years for them to come down to “normal”. But remember it would have been much worse without the Montreal Protocol.
The graph is from Our World in Data and data comes from NASA Ozone watch 2024.
Super fact 39 : Relativistic length contraction goes both ways. If two observers are moving compared to each other both will observe the length of the objects in the other’s system to be shorter in the direction of motion. The first observer will think that a yard stick in the second observer’s frame will be shorter whilst the second observer will think that the yard stick in the first observer’s frame is the shorter one.
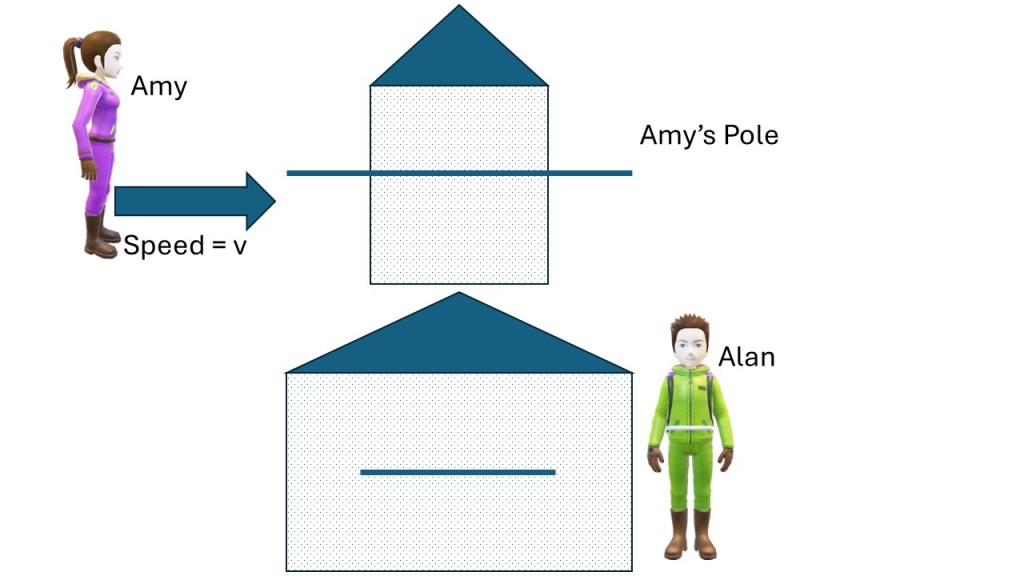
Assume a pole and a barn are of equal length when both objects are stationary. If the pole is moving (at a high speed) compared to the barn, then the pole will be shorter than the barn from the barn’s perspective but longer than the barn from the pole’s perspective. Does the pole fit inside the barn or not? This is referred to as the pole-barn paradox, or the barn-door paradox, or the ladder paradox (if a ladder is used instead of a pole).
I call this conundrum a super fact because whilst most people have heard of relativistic time dilation and perhaps length contraction, the fact that it goes both ways comes as a surprising head scratcher. The situation is analogous to my super fact post “Time Dilation Goes Both Ways” where I state:
Super fact 38 : If two observers are moving compared to each other both will observe the other’s time as being slower. In other words, both observers will observe the other’s clocks as ticking slower. Time slowing down is referred to as Time Dilation. And this post is about how time dilation goes both ways.
Both the time dilation paradox and the pole-barn paradox are solved by the non-simultaneity in relativity. However, the pole-barn paradox is more concrete and perhaps more in your face. You can easily imagine the problematic paradox.
Amy is speeding past Alan and his barn at a high speed. Amy has a pole. Because of the high-speed Amy’s pole appears shortened and will easily fit in Alan’s barn. However, to Amy it is Alan’s barn that is contracted, and her pole has the normal length and will therefore not fit in Alan’s barn.
The laws of physics are the same in all inertial frames of reference. An inertial frame is a system that moves at a constant velocity.
The speed of light in a vacuum is constant for all observers, regardless of the motion of the light source.
The first postulate is called the principle of relativity and goes all the way back to Galileo Galilei. It means that no experiment can determine whether you are at rest or moving at a constant velocity. The reciprocity of length contraction follows from this postulate. If the length of the pole in the example above is half as long as the barn in both the barn frame and the pole frame then you could tell who was standing still and who was moving from that fact, and that violates the first postulate. The first postulate demands that if the pole is half as long in the barn frame and that the barn is half as long in the pole frame.
The second postulate is the more shocking one and is special to relativity. It was discovered experimentally at the end of the 19th century but was too difficult for scientists to accept at first so various ad hoc explanations were put forth to explain it away, until the theories of relativity were created. I designated this postulate as my super fact #4 and you can read about it here.
Length Contraction
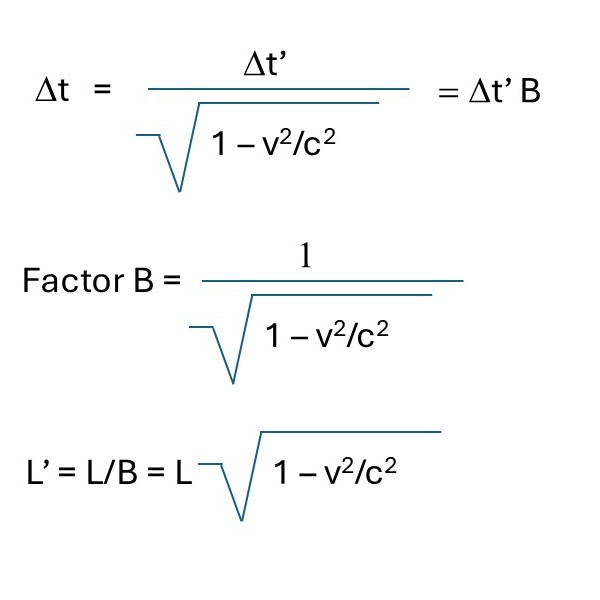
Time dilation means that a time interval between two events in a certain frame is longer by a factor B in a frame moving relative to the first frame (see picture below). Let’s imagine Amy moving at the speed v compared to Alan and his barn. Amy passes the left side of the barn at a certain time and soon after the right side. The time difference from Alan’s perspective is T and the width of the barn is L, so L = vT. From Amy’s perspective the time difference is T’ and width of the barn L’ and L’ = vT’. We denote Amy’s measurements with a prime. Note the velocity must be the same in both systems. However, Amy’s clock ticks slower (from Alan’s perspective) so T’ = BT or T = T’/B (time dilation). So, L’ = vT’ = vT/B = L/B.
If the derivation of the formulas above is confusing to you, ignore the math, and just remember that Alan measures a shorter time for the passing of the pole (because Amy’s clock is slower) from his perspective and therefore the pole must be shorter as measured from his system. If Alan measures two seconds for the passing of the pole than Amy measures maybe four seconds. It is Amy’s pole, so her longer measurement corresponds to the proper length of the pole whilst Alan’s measurement is the contracted length. Note the length contraction can only happen along the direction of motion, not perpendicular to it. To read more about length contraction click here.
The beta factor used in the formula for time dilation as well as length contraction.
Solution to the Pole-Barn Paradox
So, Amy’s pole cannot fit in Alan’s barn. The pole is moving fast so it must move in and out of the barn. Now let’s create the paradox. Imagine the barn having doors on each side that open for the moving pole and then close for a moment to entrap the pole and then they open as the pole leaves the barn. Here is the paradox, if they open and close at the same time, than the pole can be inside the barn (entrapped) from Alan’s perspective but not from Amy’s perspective. From Amy’s perspective the pole does not fit.
However, the solution to the paradox lies in “open and close at the same time”. If the doors open and close at the same time from Alan’s perspective, then they don’t open and close at the same time from Amy’s perspective.
From Amy’s perspective the door on the left side will open first and let the pole in and then after that the right door will open. After the pole has fully entered the barn and some of it is sticking out on the right-hand side then the left door will close but the door on the right will remain open until the pole is entirely outside. Relativistic non-simultaneity solves the paradox.
In Alan’s frame the doors can be closed at the same time and enclose Amy’s pole. In Amy’s frame the doors open and close to let the pole through but they don’t open and close at the same time.
Finally, below is a YouTube video that explains and solves the pole-barn / barn-door / ladder paradox simply and efficiently in a little over two minutes.
Einstein’s Miraculous Year. This book features the translations of the five famous papers that Albert Einstein wrote in 1905 including “On the Electrodynamics of Moving Bodies”, which was his paper on Special Relativity. Not for the faint of heart but very interesting.
Super fact 38 : If two observers are moving compared to each other both will observe the other’s time as being slower. In other words, both observers will observe the other’s clocks as ticking slower. Time slowing down is referred to as Time Dilation. And this post is about how time dilation goes both ways.
A lot of people know that if someone moves very fast his clocks will run slower. That’s relativity. If someone speeds through space in a rocket ship, close to the speed of light his time will slow down. When one hour passes on earth only half an hour may pass in the rocket. What comes as a shock to many people is when they find out that the converse is also true. When one hour passes in the rocket only half an hour will pass on earth.
Clearly that looks like a contradiction, but there is an explanation. I consider this a super fact because it is so strange and almost impossible for people to believe, and yet it is true.
The guy on earth says my clock (left) is ticking double as fast as the rocket man’s clock (right). The rocket man say’s my clock (right) is ticking double as fast as the clock on earth (left). Who is right? Surprisingly both of them.
The laws of physics are the same in all inertial frames of reference. An inertial frame is a system that moves at a constant velocity.
The speed of light in a vacuum is constant for all observers, regardless of the motion of the light source.
The first postulate is called the principle of relativity and goes all the way back to Galileo Galilei. It means that no experiment can determine whether you are at rest or moving at a constant velocity. The reciprocity of time dilation follows from this postulate. If the time for the rocket man in the example above was ticking at half the speed compared to the time for the guy on earth and they both agreed, then you could tell who was standing still and who was moving from that fact.
The first postulate demands that they disagree. The guy on earth thinks the rocket man’s clock is ticking at half the speed of his own clock, whilst the rocket man think it is earth man’s clock that is going slow. Therefore, you can’t tell who is standing still, which is what the first postulate requires.
The second postulate is the more shocking one and is special to relativity. It was discovered experimentally at the end of the 19th century but was too difficult for scientists to accept at first so various ad hoc explanations were put forth to explain it away, until the theories of relativity were created. I designated this postulate as my super fact #4 and you can read about it here.
In this picture Amy is traveling past Alan in a rocket. Both have a laser. Both measure the speed of both laser beams to be c = 299,792,458 meters per second. The speed of light is a universal constant.
Time Dilation
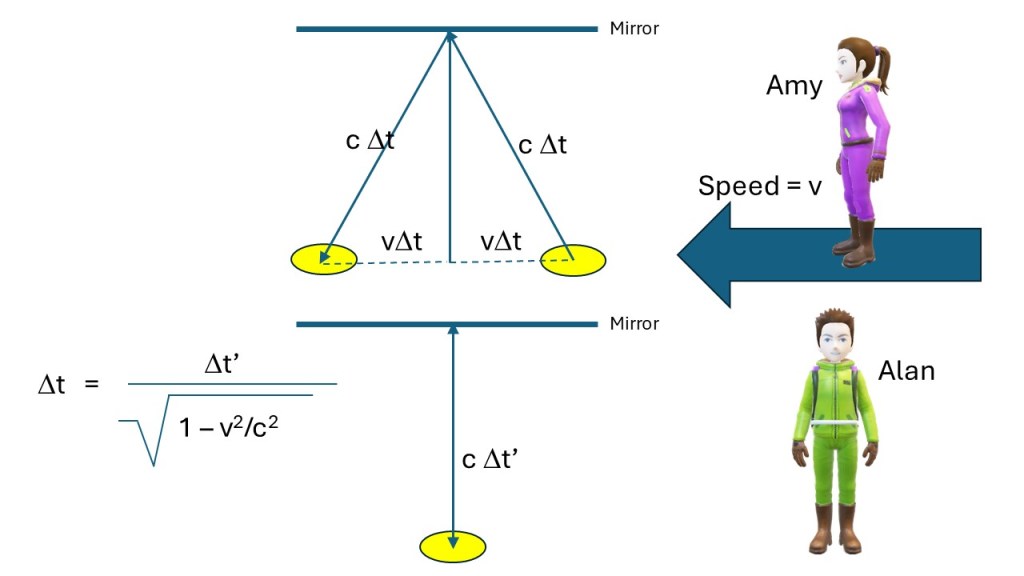
In the pictures below I am showing two rocket systems in space, Amy’s rocket and Alan’s rocket. They are travelling at a high speed compared to each other. Each rocket has a light clock that consists of a light beam bouncing up and down between a mirror in the ceiling and a mirror on the floor. The two light clocks are identical, and each bounce corresponds to a microsecond.
Amy is passing Alan at a high speed, and therefore Alan will see Amy’s light clock running slower than his because Amy’s light beam must travel further. Remember, the speed of light is identical for both light clocks (light speed is a universal constant). For those interested I am also deriving the formula for time dilation.
Alan and Amy have identical light clocks. We call the time it takes for the light beam to go from the floor to the ceiling (one clock tick) Dt in Amy’s case and Dt’ (reference frame) for Alan. Amy is speeding past Alan towards the left. From Alan’s perspective Amy’s clock is running slower. Using Pythagoras theorem, it is possible to derive the formula for time dilation shown in the lower left corner.
Since Amy moving left is the same as Amy standing still and Alan moving right you can say that Alan is the one moving fast. In this case it is Alan’s light clock that is ticking slower because from this viewpoint it is his light beam that has to travel further. From Amy’s perspective it is Alan’s clock that is going slower.
It is equally correct to say that Amy is standing still and that it is Alan that is moving fast to the right. This time (pun not intended) it is Alan’s clock that is ticking slower. Dt corresponds to Alan’s clock ticks and Amy’s clock ticks are Dt’.
This seemingly contradictory situation is resolved by the fact that Amy’s and Alan’s perspectives will drift apart as they continue their journey. They will increasingly disagree on whether events are simultaneous or not, and they will disagree in which order events occur. This is another shocking fact, or as I refer to it, super fact. It is strange but it resolves the apparent contradiction of reciprocal time dilation. I am explaining this in greater detail in this post.
The Twin Paradox
But what happens if one of Amy or Alan decides to turn around so that they meet up again. If Amy’s clock runs slower from Alan’s perspective and Alan’s clock runs slower from Amy’s perspective, how can you reconcile that when they meet up again? It turns out that whoever is turning around or accelerating or decelerating to turn back is the one who will have the least time pass. If Amy is the one turning back, then she will age less than Alan. During her acceleration she will see Alan’s clock starting to run faster and faster until he is older her.
Let say Alan’s clock is running half the speed of Amy’s clock from Amy’s perspective and Amy’s clock is running half the speed of Alan’s clock from Alan’s perspective. Let’s also say that Amy traveled to the left for 10 years before turning around.
From Alan’s perspective she would have traveled 20 years before turning around. However, from Amy’s perspective 5 years would have passed on Alan’s clock. As she turns around Alan’s clock will run faster and catch up so that when they meet up again Amy will be aged 20 years, while Alan will be aged 40 years. That is 35 years of catching up for Alan’s clock from Amy’s perspective. Alan’s clock advanced 35 years from Amy’s perspective after Amy turned around. In the end Amy will be the younger one.
Observe that the fast-forward advancement of Alan’s clock from Amy’s perspective happens only while Amy is in the process of turning around (accelerating / decelerating). Further, how fast the fast forward happens depends on the distance as well. Once Amy is traveling at a constant speed again (inertial frame) Alan’s clock will run slower again from Amy’s perspective.
A somewhat halting but OK analogy for the 35 years of catching up that happens on Alan’s clock from Amy’s perspective is when you turn a boat around on a wavy sea. As you are moving in the direction of the waves the waves will hit you much less often (if at all) but after you turn around and move against them the waves will hit your boat very frequently. Alan’s clock will run faster for Amy whilst she is turning around.
Einstein’s Miraculous Year. This book features the translations of the five famous papers that Albert Einstein wrote in 1905 including “On the Electrodynamics of Moving Bodies”, which was his paper on Special Relativity. Not for the faint of heart but very interesting.
Super fact 37: There is strong evidence for the Big Bang, and we know a lot about how the Universe evolved through time since the Big Bang.
Considering the evidence that has accumulated throughout the years for the Big Bang it is hard to deny it happened. In my experience very few people are aware of this evidence, and they are surprised to find out how much evidence there is and how many details we know about the evolution of the universe. It is easy to believe that scientists are guessing when you don’t know much about the evidence yourself. But they are not guessing. That is why I call this a super fact.
In addition, there’s a lot of misconceptions around the Big Bang as well surprising facts. A few additional things that might surprise people are that the Big Bang was not like an explosion, the Universe did not expand into something. In addition, there might be multiverses and multiple Big Bangs, and there are cyclic models, and so-called eternal inflation. There are things we know and things we don’t know.
This file is in the public domain in the United States because it was solely created by NASA. (from Wikimedia commons
The Expansion of the Universe
It used to be believed that the Universe was static. In 1929 the astronomer Edwin Hubble discovered that the universe was expanding. He made this observation by analyzing the light from distant galaxies and noticing that their light was redshifted. I am going to explain what that means next.
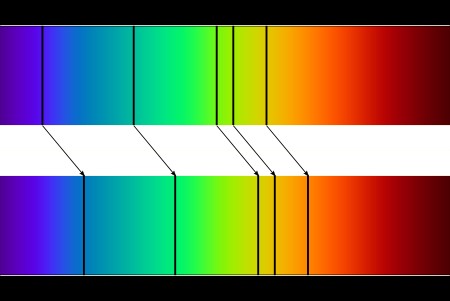
Light emitted from elements, atoms and molecules have light absorption patterns that are unique to the atom/element in question. This is called a light spectrum. This makes it possible to identify the elements in a star and their proportions. Red shifted means that the absorption lines have moved towards red because the frequency of the light has been shifted due to the motion. This is called the doppler effect.
You can notice this phenomenon for the case of sound when an ambulance is coming towards you and then speeding by you. The sound changes. Hubble was using the redshift to the determine that further away the galaxy was the faster it was moving away from us.
Visualization of redshifted absorption lines are redshifted due to velocity away from observer. Top lines are for an object at rest and in the bottom picture the object is moving away. Maxmath12, CC0, via Wikimedia Commons. This file is made available under the Creative Commons CC0 1.0 Universal Public Domain Dedication.
A natural explanation for this is that the universe is expanding, and that it once must have been much more compressed, but it is not the only explanation. However, there is more evidence.
The Cosmic Microwave Background Radiation
If you assume that the universe once was much more compact and much hotter than today, particles such as protons, neutrons and electrons would have been free and close together preventing light from freely moving around. However, as the universe kept expanding and cooling these particles eventually should have been able to form atoms allowing light or electromagnetic radiation to freely move around.
Some physicists, Alpher, Herman and Gamow predicted around 1950 that this should have left behind a detectable microwave background radiation. This radiation was detected by chance in 1964 by two physicists, Penzias and Wilson. This radiation had the expected properties and careful study of this Cosmic Microwave Background Radiation (CMBR or CMB) has given us a lot of information about our universe and may give us information about other universes (multiverses).
Its existence is strong evidence that the universe once was very compressed and much hotter, i.e., the Big Bang. An interesting fact is that in old TVs, between the channels (old people will remember this), you had this fuzz, or war of the ants as some people called it, and part of that TV fuzz is the CMBR.
This is a sky map of the cosmic background radiation from when the universe was around 380,000 years old. It was created with the help of satellite (NASA) measurements. The colors are artificial and show tiny temperature variations. NASA / WMAP Science Team, Public domain, via Wikimedia Commons.
You can watch a 4-minute video about the discovery of the CMBR narrated by Neil DeGrass Tyson on this PBS web page by clicking here.
Abundances of Light Elements
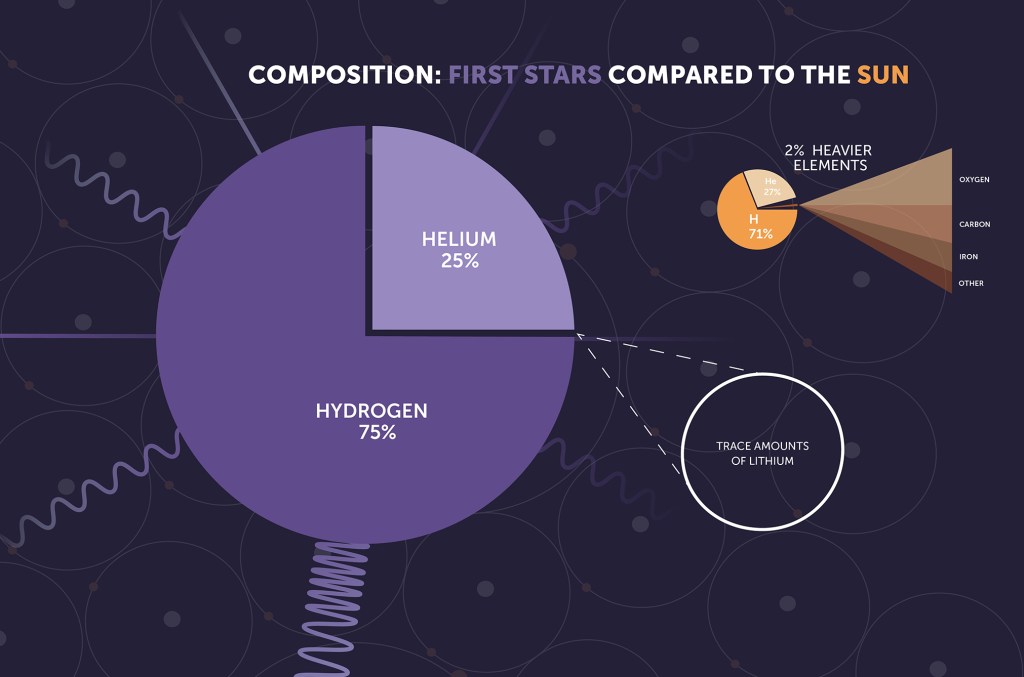
Yet another piece of evidence is the relative abundance of hydrogen and helium compared to heavier elements. The physics at the beginning of the Universe under the Big Bang tells us that initially regular matter should have consisted of 75% hydrogen and 25% helium and hardly anything else, and that is composition the oldest stars had when they were new. In addition, the oldest stars we’ve found appear to have an age just under the 13.8 billion years that we get for our Universe assuming the Big Bang theory (that’s another piece of evidence).
The first-generation stars consisted of 75% hydrogen and 25% helium and trace amounts of Lithium. A second or third generation star like our sun is still mostly hydrogen and helium but also many other elements. The rocky planets circling the sun are mainly elements heavier than hydrogen and helium. Image credit NASA, ESA, CSA, STScI
A Very Brief History of Time
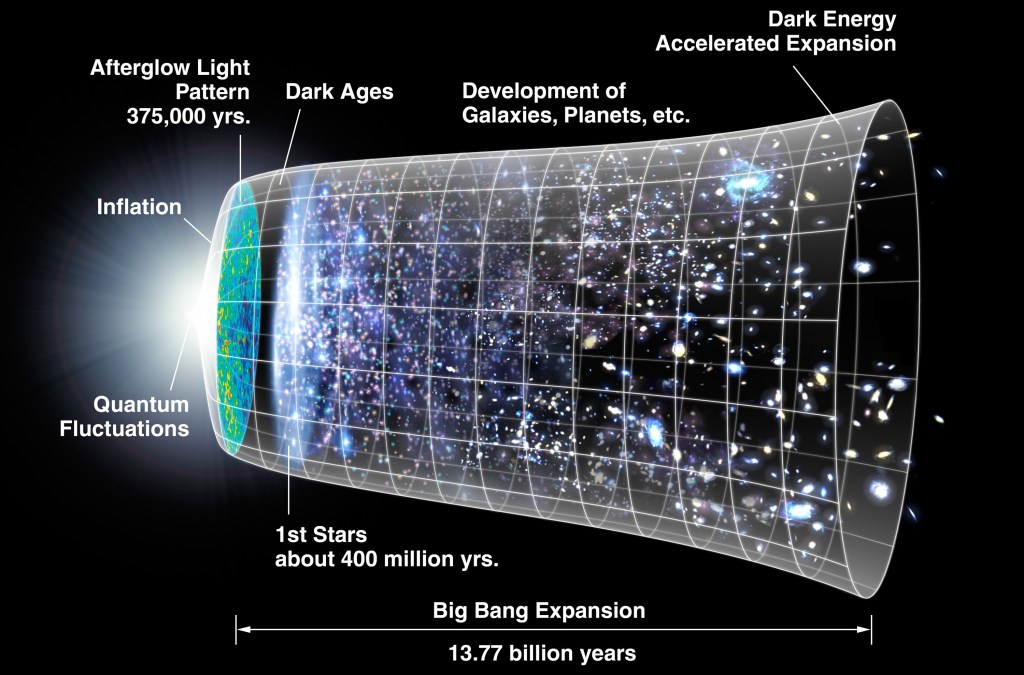
So, it all started with a quantum fluctuation. The first 0.000000000000000000000000000000001 seconds is called the inflationary period characterized by super-fast expansion, much faster than the speed of light, as we know it today. At this time the strong nuclear force becomes distinct from the weak nuclear force.
I should point out that during the first 0.0000000000001 seconds the physics laws may not have applied in a normal sense. I should also point out that this was not an explosion. An explosion explodes into something but there was nothing else outside of the universe, so this is more like superfast growth.
At a fraction of a second protons and neutrons form from quarks and after one second neutrinos came into existence and if primordial black holes exist, they were formed at this time too. After two minutes nucleus consisting of neutrons and protons are formed, and the first elements hydrogen and helium formed. After 20 minutes an opaque hot plasma forms, after 100,000 years neutral helium atoms form, and after 375,000 years CMBR is created, etc.
This is just a small sample of everything that we know happened after the Big Bang, based on the known laws of physics. You can read about all the details in books like The First Three Minutes by Steven Weinberg or A Brief History of Time by Stephen Hawking.
The proton and neutron each consist of three quarks. They are formed at a fraction of a second after the Big Bang. Asset id: 2333679305 by KRPD.
Pre–Big Bang Cosmology
So, what was there before the Big Bang, if anything? Well, that part is speculation, but there are many good ideas. A popular hypothesis speaks of quantum fluctuations setting off the Big Bang. There are models in which the whole of spacetime is finite, including the Hartle–Hawking no-boundary condition. This means that time itself came into existence with the Big Bang and therefore nothing could have preceded it. This means that the Big Bang could not have been caused or created by anything else, just like a universe that has existed eternally could not have been caused or created by anything else.
In a sense, despite being 13.8 billion years old, the universe in this scenario would have always existed. Because the concept of “always” stops at 13.8 billion years ago. Stephen Hawking used the analogy of the north pole. You can’t go further north from the north pole.
There are other models that include multiverses, for example, eternal inflation, in which universal inflation ends locally here and there in a random fashion, each endpoint leading to a bubble universe, expanding from its own big bang. You can view this model as inflation being the river of time with the various universes popping up like bubbles in the stream.
In another model inflation is due to the movement of branes in string theory and Big Bangs are the result of colliding branes. There are cyclical models, such as Nobel Prize winner Roger Penrose’s Conformal cyclic cosmology in which one universe gives rise to another universe as it dies.
Notice that Pre-Big Bang Cosmology is speculative, but the reality of the Big Bang is backed by strong evidence.
The surface of a multiverse with a lot of universes 3d rendering Asset id: 2256998119 by Dr. Norbert Lange.
Super fact 36: Every continuous symmetry of the action of a physical system with conservative forces has a corresponding conservation law. This revolutionary insight was mathematically proven in 1915 by a relatively unknown woman, Emily Noether.
It is not easy to understand what this super fact means, and therefore it is easy to miss the fact it says something fundamental about the nature of reality. It says something profound about our Universe and all possible Universes. It is arguably one of the most profound discoveries in science. Since the discovery of Noether theorem, we do physics differently and we view our physical reality differently.
In the book “The Theory of Almost Everything” the author, theoretical physicist Robert Oerter states that the standard model of elementary particles, or most of modern physics, rests on three pillars, special relativity, quantum physics, and Noether’s theorem. Which one of those three have you not heard of? I guess Noether’s theorem.
That question brings me to the second part of the super fact. Emily Noether did a lot for mathematics and physics in addition to her first theorem (stated above), and yet she is not well known. Albert Einstein said of Emily Noether : “Fräulein Noether was the most significant creative mathematical genius thus far produced since the higher education of women began”. Notice he didn’t say “woman genius”.
Why I consider Noether’s (first) theorem a super fact is because it tells us something fundamental about reality that is highly surprising and yet undisputable (mathematically proven) and not many of us know about it. The second part of the super fact, that despite being one of the greatest geniuses of the 20th century she is so unknown, is also surprising.
This picture reminded me of Emily Noether a genius and one of the greatest mathematicians in human history. This is a submission for Kevin’s No Theme Thursday.
Noether’s Theorem What Does It Mean
Noether’s theorem, says that symmetries in the universe give rise to mathematical conservation laws. One way to understand this is by using an example. That the physical laws remain the same as you translate a system in time is an example of a continuous symmetry.
If you do an experiment twice at two different times, let’s say at 8:00AM and at 9:00AM, and everything is set perfectly identical both times you are likely to get the same result. Well barring statistical/quantum uncertainty. The point is that the physical laws did not change. If the physical laws do not change between 8:00AM and 9:00AM, then you have a continuous symmetry.
Noether’s theorem says that if you have a continuous symmetry, you also have a conservation law, and the conservation law in this case is the conservation of energy/mass. If the physical laws do not change between 8:00AM and 9:00AM then mathematically the total energy / mass of the closed system must remain constant.
It follows that energy is not destroyed or increased. At first it seems like the time symmetry and energy/mass conservation have nothing to do with each other, but the symmetry gives rise to the conservation law. So, if you ask the question, why is energy / mass conserved, the answer is because physical laws don’t change with time.
There are many symmetry-conservation law pairs in nature. Translational symmetry, the fact that the laws of physics stay the same if you move to the side or forward, results in the conservation of momentum. The symmetry of laws that does not change if moving around in a circle amount to the law of conservation of angular momentum. Other symmetries result in the conservation of charge.
The converse is also true. If you find that a quantity is conserved you can find a symmetry, and if you find a symmetry that is broken you can find a quantity that is not conserved after all. There is not much in science that is more fundamental than that and in addition Noether’s theorem is very useful.
If the physical laws stay the same when translated in space then linear momentum is conserved. Conservation of momentum principle in isolated system Asset id: 2319593529 by MZinchenko.
Emily Noether
Emily Noether was born into a Jewish family in Germany March 23 in 1882. She was the daughter of the mathematician Max Noether. She studied mathematics and completed her doctorate in 1907. At the time, women were largely excluded from academic positions, but she worked at the Mathematical Institute of Erlangen without pay for seven years. She eventually gained paid positions. She made huge contributions to abstract algebra, calculus of variations, topology and other mathematical fields.
Her most important contributions are the Noether’s theorems, the first one described here. When Hitler came to power in 1933, she had to flee Germany. She got a position as a professor at Bryn Mawr in 1933. She died in 1935.
Emily Noether in 1910. Unknown author Unknown author Publisher: Mathematical Association of America [3], Brooklyn Museum [4], Agnes Scott College [5], [6], Public domain, via Wikimedia Commons.
Concluding Summary
Noether’s Theorem changes how we view the Universe and the laws of physics. For example, the conservation of energy is not just something we empirically discovered. It follows mathematically from physical laws not changing by time. It represents a paradigm shift in science that arguably is as important as quantum mechanics or relativity and yet very few people have heard of it. I find that quite shocking.