The goal of this blog is to create a long list of facts that are important, not trivia, and that are known to be true yet are either disputed by large segments of the public or highly surprising or misunderstood by many.
Super fact 84 : Modern birds are classified as part of the clade Dinosauria. They are direct descendants of small, feathered maniraptoran dinosaurs that survived the Cretaceous-Paleogene extinction event 66 million years ago. Maniraptoran dinosaurs in turn are a major subgroup of coelurosaurian theropod dinosaurs. In other words, birds are avian dinosaurs.
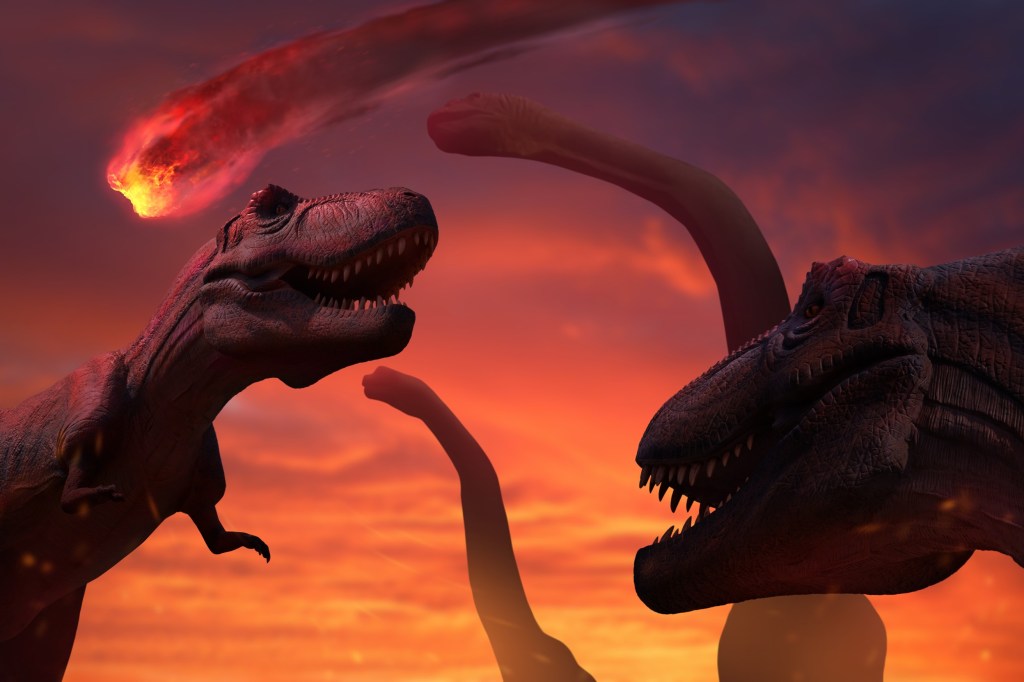
Some dinosaurs survived the Cretaceous-Paleogene extinction event 66 million years ago. Shutterstock Asset id: 2196200279 by funstarts33
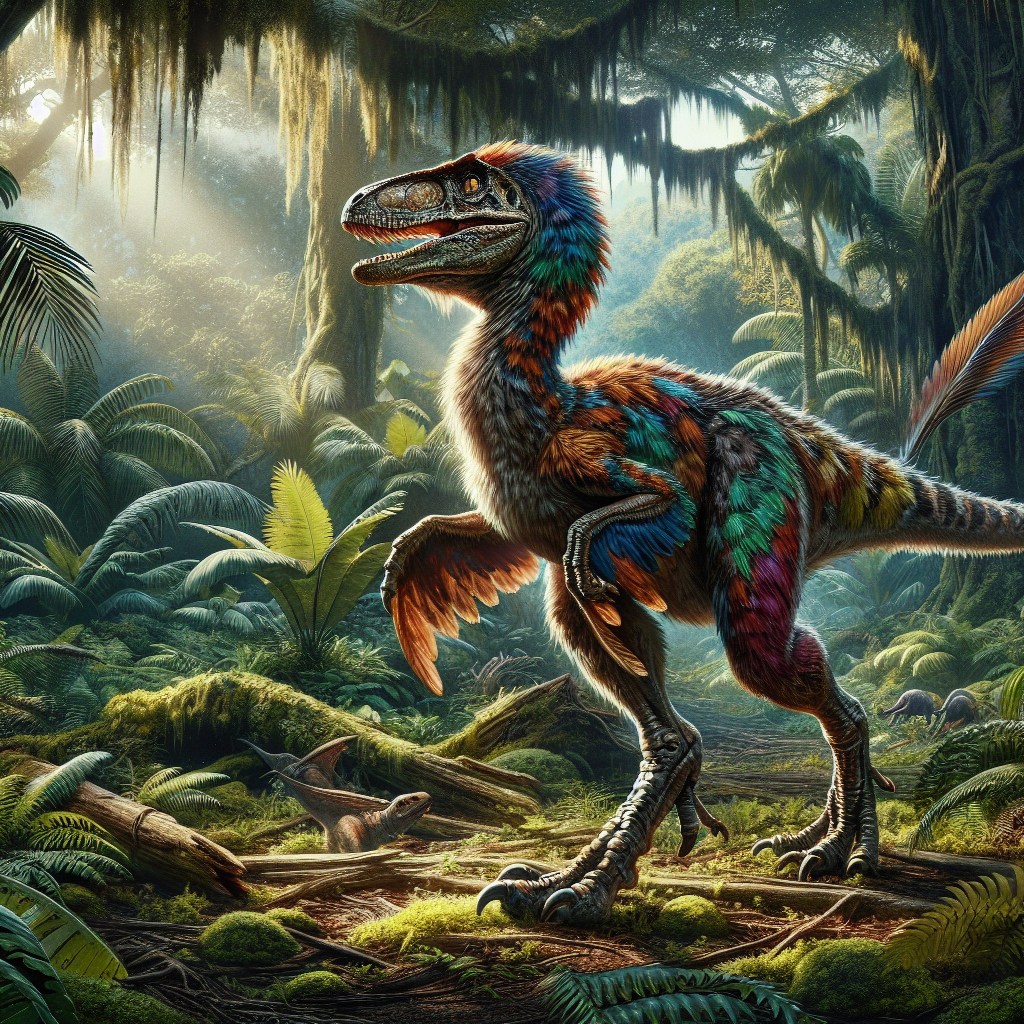
Birds are descendants of specialized maniraptoran theropod dinosaurs that survived the extinction event that killed most dinosaurs 66 million years ago. Maniraptoran dinosaurs in turn are a major subgroup of Tyrannoraptora, which include the well-known Tyrannosaurus Rex. Tyrannoraptora in turn is a major subgroup of coelurosaurian theropod dinosaurs. Both the well-known dinosaur called velociraptor, and birds belong to the group Maniraptora. Even though the velociraptor was not a bird they shared many bird-like features, including feathers, wishbones, hollow bones, and similar wrist joints.
Velociraptor with feathers (well a little bit). Shutterstock Asset id: 2636534673 by Shutterstock AI Generator
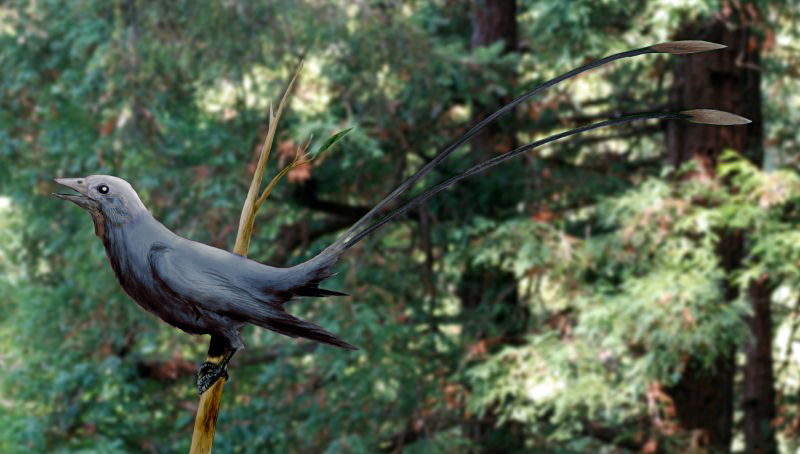
Birds evolved during the Jurassic period from two-legged, carnivorous, and often feathered dinosaurs, and are the only surviving dinosaurs. They have been classified as avian dinosaurs since the 1980’s. In other words, they are dinosaurs. Initially feathers evolved among dinosaurs for insulation, sexual display, and camouflage rather than flight. One of the early birds was Eoconfuciusornis. It lived 131 million years ago, long before the Cretaceous-Paleogene extinction event 66 million years ago. Eoconfuciusornis could fly and it had colorful feathers.
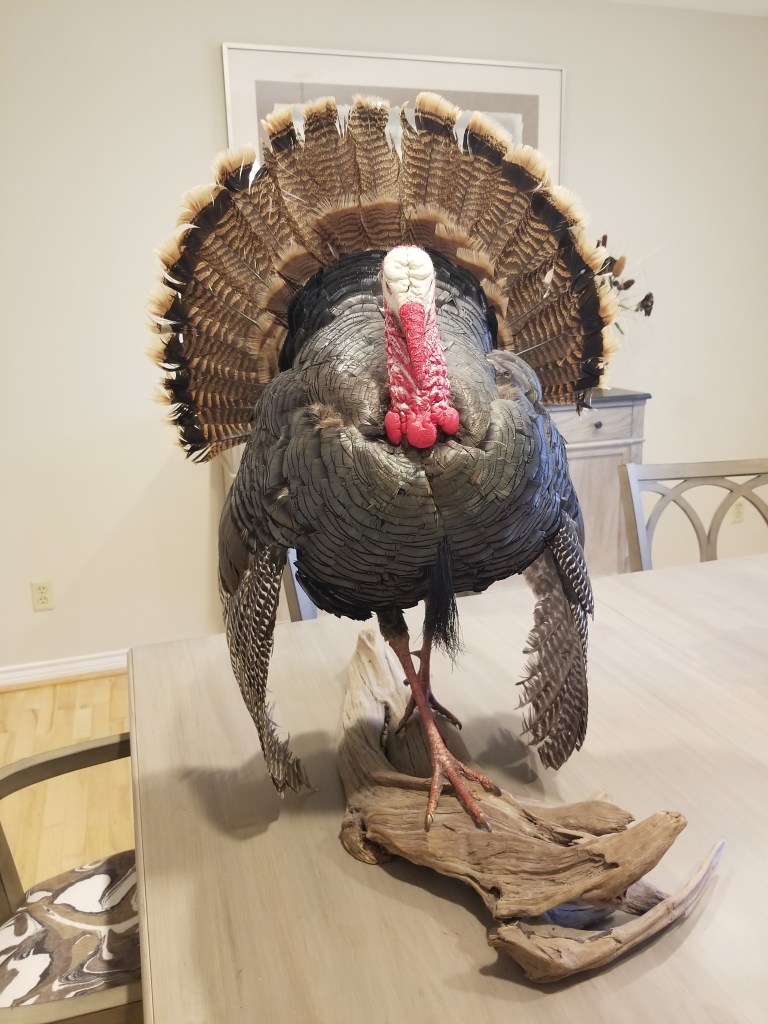
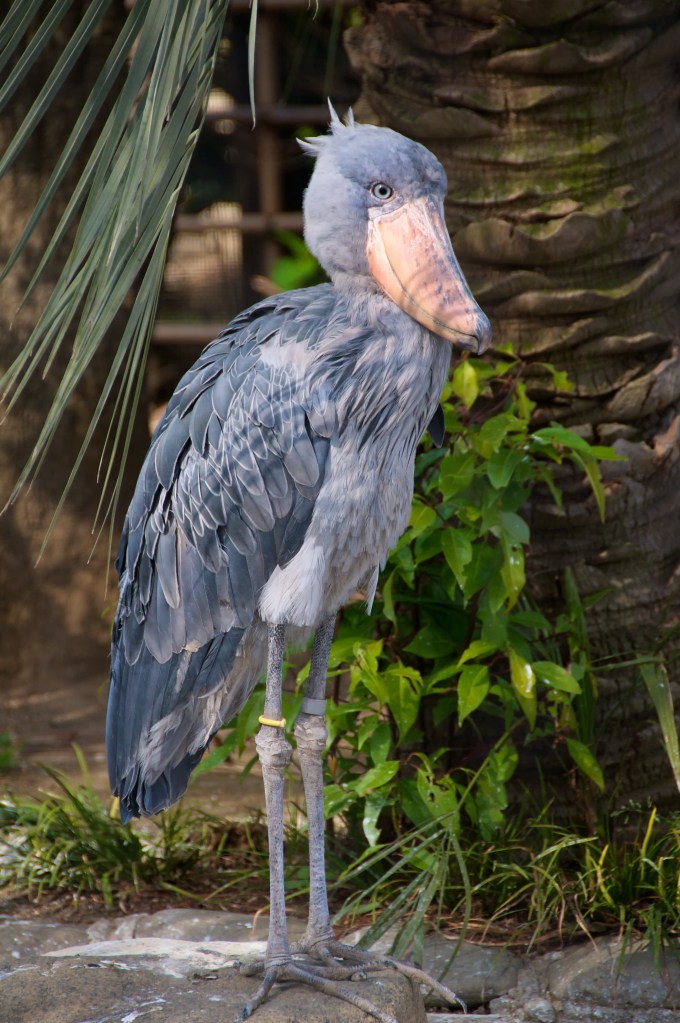
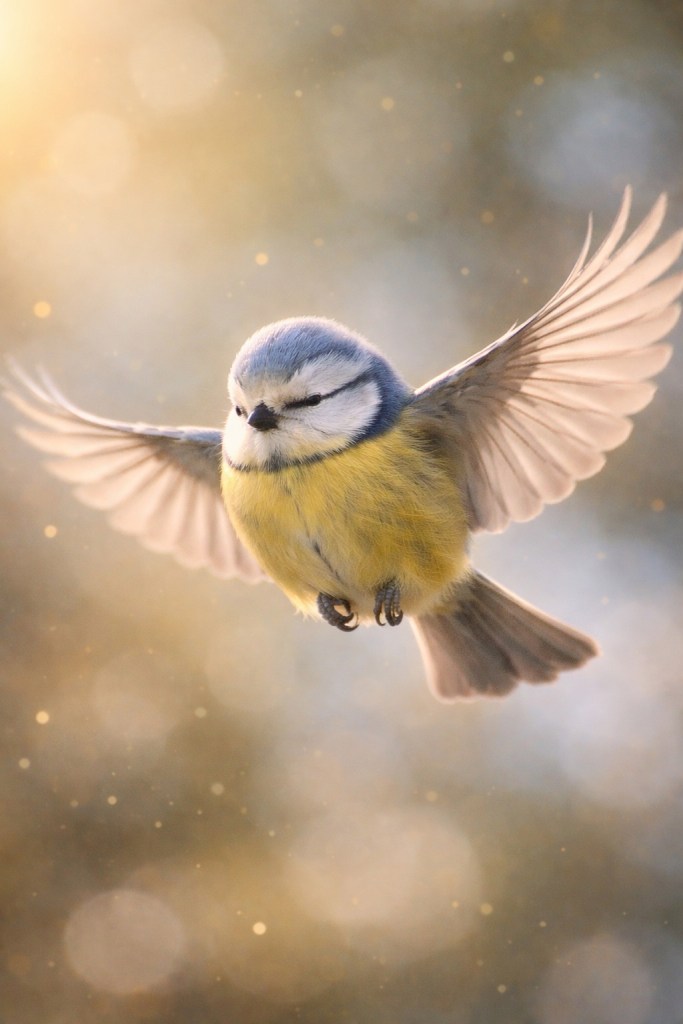
I brought up this fact in a recent post and I hinted that it was a super fact. It is true, surprising and kind of important. After all birds are all around us. In this post I am exploring the fact that birds are dinosaurs a little bit more than I did in my previous post. Below are a couple of modern birds.
A shoebill stork standing at Ueno Zoo, Tokyo, five feet tall. Bob Owen, CC BY 2.0 https://creativecommons.org/licenses/by/2.0, via Wikimedia CommonsA wild turkey in our dining room.
Feathered Dinosaurs
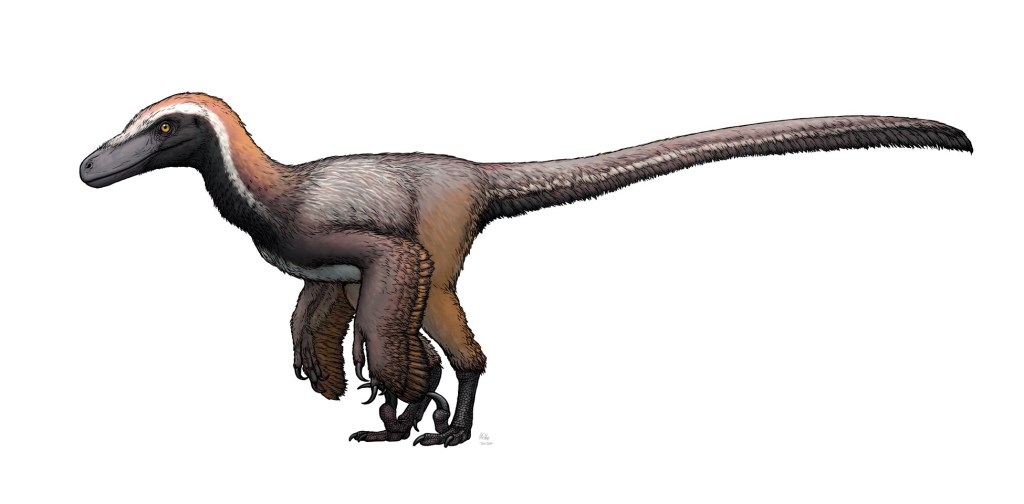
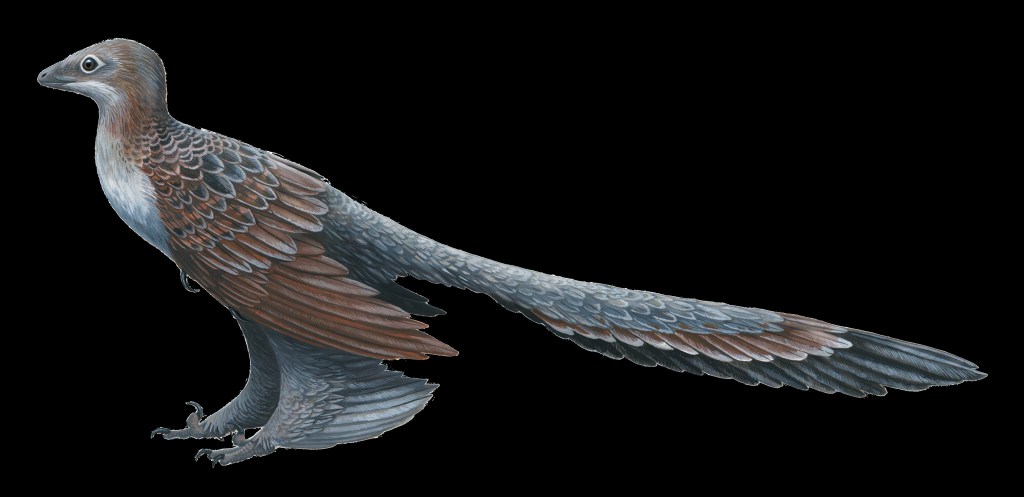
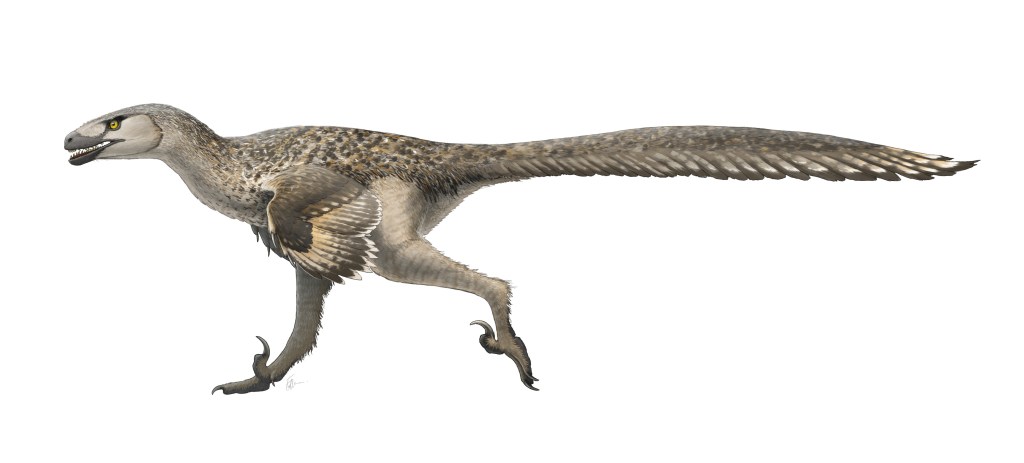
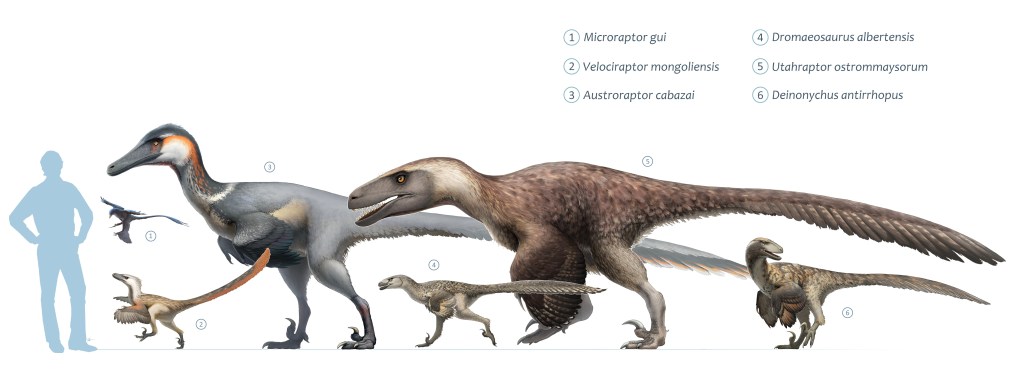
A lot of dinosaurs had feathers, and some could fly. That included many types of dinosaurs other than birds. Dinosaurs with feathers include, for example, Velociraptor, Deinonychus, Archaeopteryx (could fly), Microraptor (could fly), Rahonavis (could fly), Gallimimus, Ornithomimus, Yutyrannus huali, Psittacosaurus, Psittacosaurus, Sinosauropteryx, Sinornithosaurus, Eoconfuciusornis, Wulong, Psittacosaurus, Sciurumimus, Kulindadromeus, Caudipteryx, Utahraptor, Deinonychus, and even young T-Rex and many others. We know that at least some dinosaurs had feathers as well as colors based on fossil finds. Below are some illustrations.
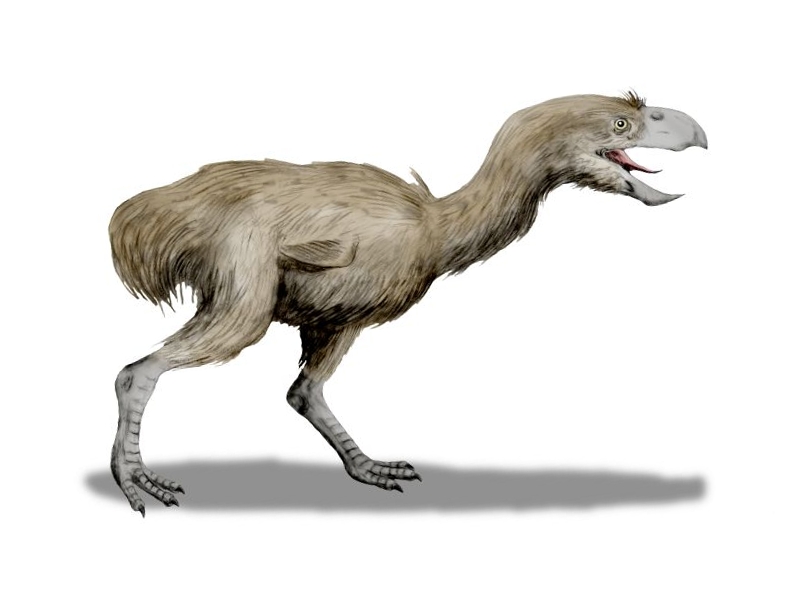
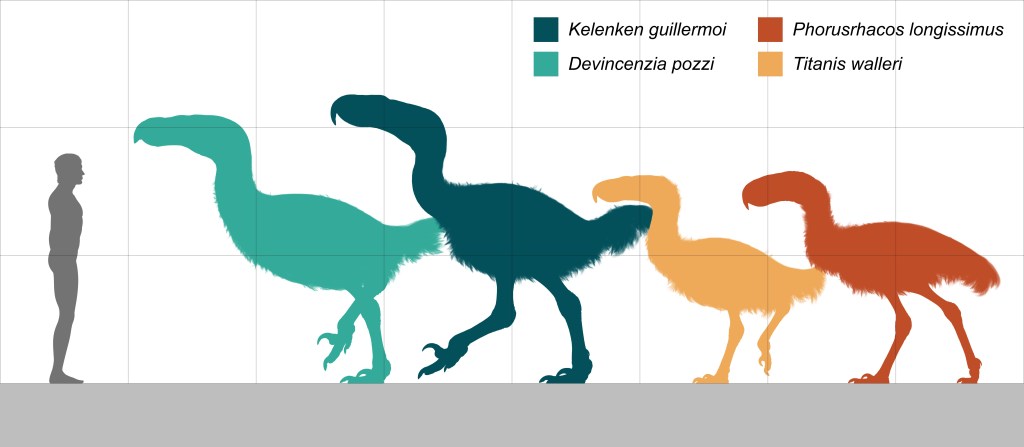
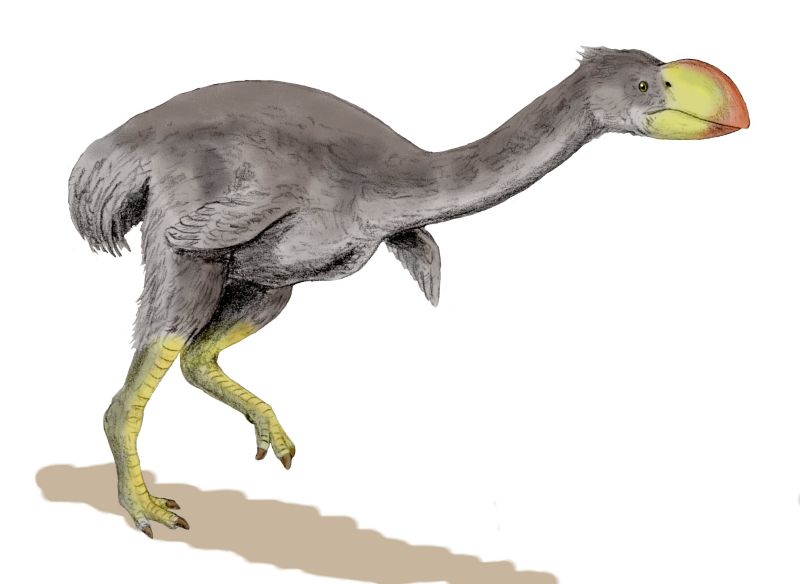
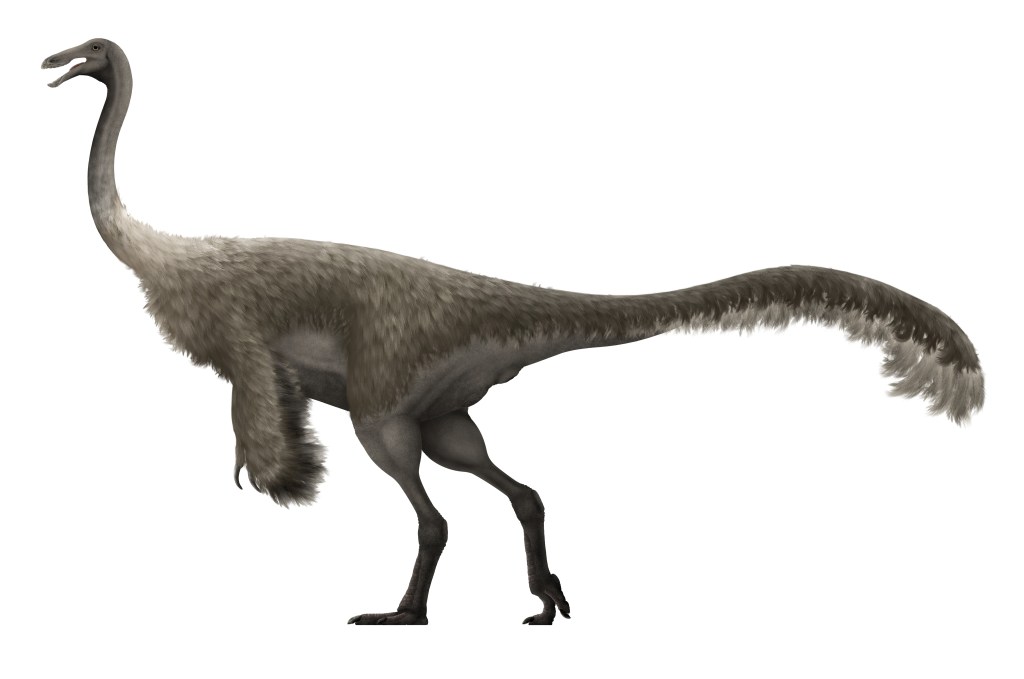
After the Cretaceous-Paleogene extinction event 66 million years ago birds continued evolving. Some of them became large standing 1 – 3 meters (3-10 feet) and weighing hundreds or even thousands of pounds. From about 53 million years ago until 100,000 years ago there were large birds that we refer to as Terror Birds. They lived at the same time as humans. However, there were other large and scary birds. Dromornis stirtoni was a flightless bird that lived 7-8 million years ago, it was over three meters in height (10 feet) and weighed 500-600 kilograms (1,100 to 1,300 pounds). Below are some illustrations.
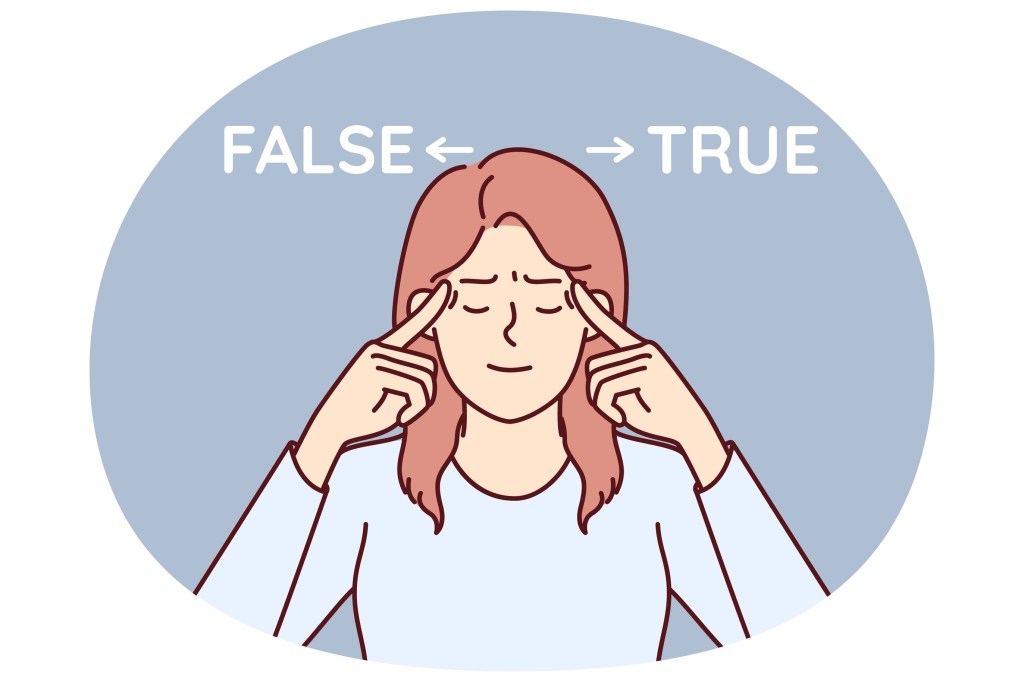
Super fact 83 : Everyone experiences false memories. They are a normal part of how human memory works and are very common. There are also false memories that are shared among large groups of people and that are often socially reinforced. This is called the Mandela effect.
Shutterstock Asset id: 717504940 by durantelallera
As I mentioned, false memories are very common. However, what may come as a surprise is that some false memories are widespread and socially reinforced. It is important to know this, and we know it is true, so it is a super fact. The effect is named after the former President of South Africa, Nelson Mandela, who died in 2013. However, a lot of people distinctly remember him dying in prison in the 1980s.
It was paranormal researcher Fiona Broome who named the effect after having a personal experience with the phenomenon. She wrongly recalled Nelson Mandela dying in the 1980s and she could even remember the news coverage of his funeral, and yet it never happened. After talking to other people, she realized that she was far from alone with her false memory.
Another example is that a lot of people remember Darth Vader in Star Wars telling Luke “Luke, I am your father”. What Darth Vader said was “No, I am your father”. Yet another movie example is that Forrest Gump did not say “Life is like a Box of Chocolates”. He said, “Life was like a box of chocolates”. Also, the Monopoly man never had a monocle, Curious George doesn’t have a tail, many remember the “Berenstein Bears” but it’s the “Berenstain Bears”. C-3PO is not all gold, he has a silver leg. You can easily find hundreds of examples of the Mandela effect online.
Shutterstock Asset id: 558350728 by Willrow Hood
People have asked me, “do you remember in the 1970’s and 1980’s when scientists were convinced that global cooling was happening”, to which I answer, “no I don’t remember that and neither do you”. In the 1970’s much less was known about the climate, but the possibility of anthropogenic warming dominated the peer-reviewed literature even then. There were a few contrarian climate scientists who claimed there was global cooling and there were some articles in popular media about global cooling, but the statement that scientists were convinced there was global cooling is simply false. You can read more about this in this book. Yet some people “remember” this. I believe this is another example of a socially reinforced Mandela Effect.
False Beliefs and False Memories
The existence of false beliefs is another phenomenon that is very common. There are hundreds of common beliefs that we know are false based on carefully vetted data, large amounts of studies, and scientific experiments. I think we all have some false beliefs. We have all been bamboozled at some point. The way to know is to check and compare the evidence and the data and papers from reputable sources. Find out what the experts in the field say. Some examples of false beliefs are:
Vaccines don’t work and are dangerous – reality: vaccines work, save millions of lives, and are in general safe.
Wind Power is not really clean energy – reality: wind power is much cleaner (by a lot) than the fossil fuels they replace.
Astrology works – reality: astrology is not science and lack predictive power.
Homeopathy works – reality: homeopathy has not been shown to work better than placebos.
We adopt false beliefs because of misinformation, propaganda (politics), social reinforcement, a wish to believe certain things, our own lack of critical thinking, etc. False memories, including collective false memories are due to the fact that memories aren’t perfect recordings, memory reconstruction, social reinforcement (also true for false beliefs), and confusion with similar events.
Shutterstock Asset id: 2593117091 by Drawlab19
Both false beliefs, false memories and the Mandela effect distort our understanding of the world. That is BTW one important inspiration for this fact finding blog – superfactful. It is difficult to accept that what you believe to be true may simply be false. We want to believe that we know better than others, not that we have been bamboozled or that we misremember things. But we need to be open to look at and compare evidence, be curious and willing to understand how things work, and be willing to change our beliefs and accept that some of our memories may be false. That is one way to grow as a human.
This is not a super fact post but a post featuring ten wind blowing facts about birds. Let me rephrase that, ten mind blowing facts about birds. Sorry for flying that pun in your face.
My super facts are true based on reputable sources, despite being surprising or disputed. A super fact is also important and educational, unlike typical trivia. I consider the last seven bird facts below to be trivia and therefore not super facts. However, I hope my ten bird facts will at least raise some eyebrows and be somewhat educational. I have listed the ten facts below and if you want to learn more about them you can read the rest of the post.
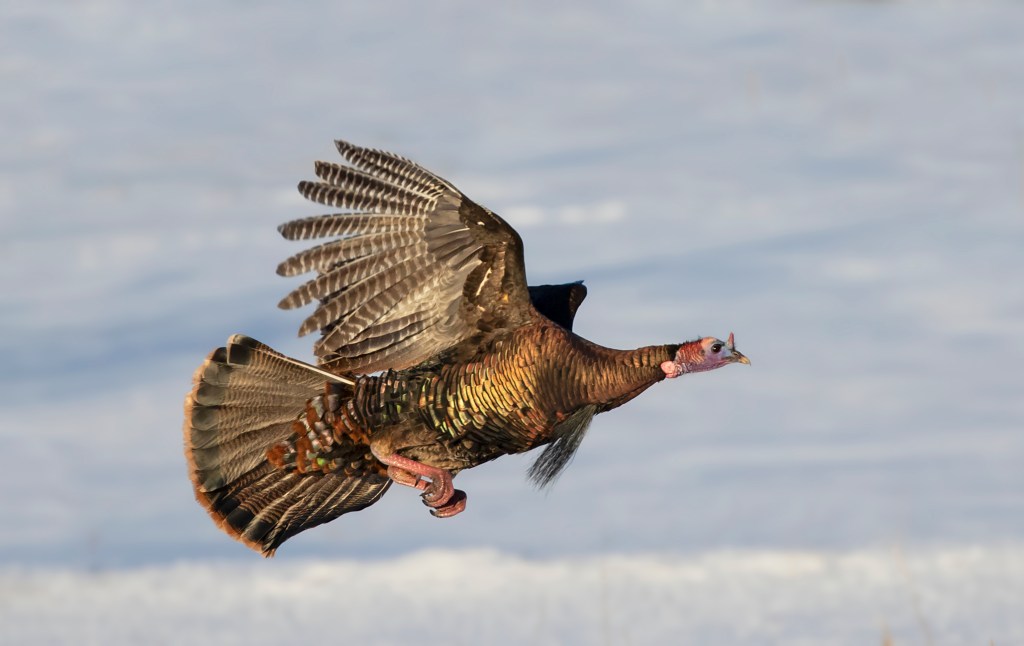
Domesticated Turkeys and Wild Turkeys are the same species, but Wild Turkeys can fly distances of more than a mile, sometimes at speeds of 55 miles per hour. I’ve seen it with my own eyes on turkey hunts. I’ve seen turkeys fly, flap their wings, take off and glide across the sky at the height of 30-50 feet. You can read more about it here and here. Below is a video showing wild Turkeys flying.
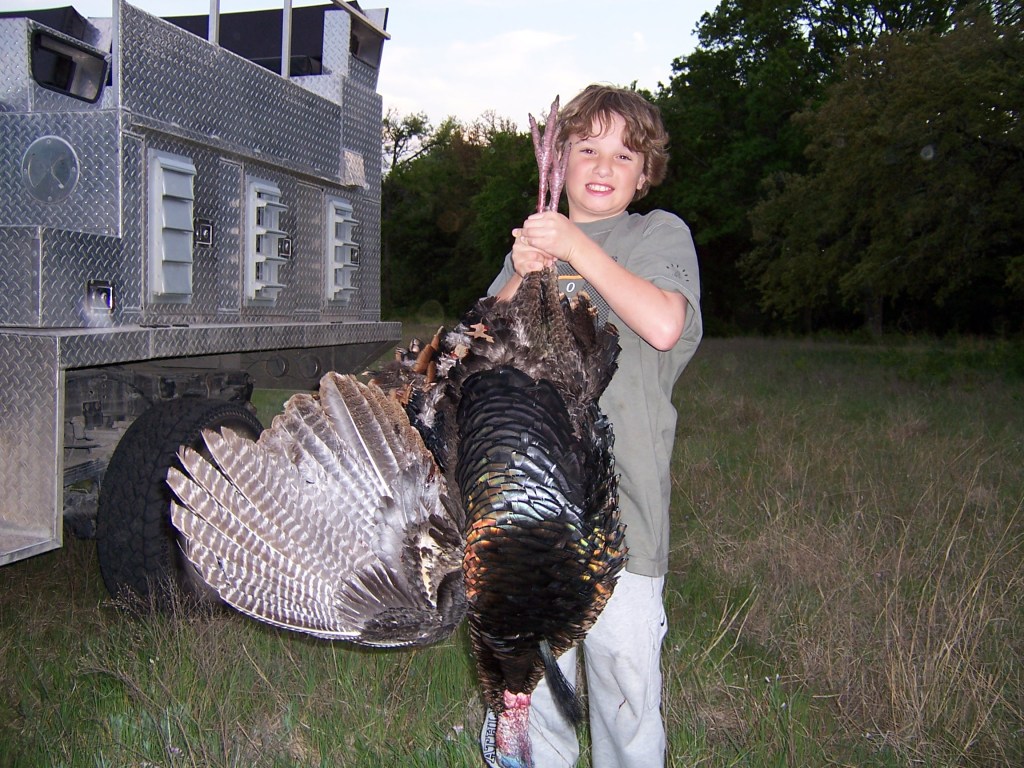
Eastern Wild Turkey Meleagris gallopavo flying over the snow in Ottawa, Canada Stock Photo ID: 1358163995 by Jim Cumming.My son holding the wild turkey he shot.
Birds Are Dinosaurs
Birds are descendants of specialized maniraptoran theropod dinosaurs that survived the extinction event that killed most dinosaurs 66 million years ago. They evolved during the Jurassic period from two-legged, carnivorous, and often feathered dinosaurs, and are the only surviving lineage of this group. They have been classified as avian dinosaurs since the 1980’s. In other words, they are dinosaurs. Initially feathers evolved among dinosaurs for insulation, sexual display, and camouflage rather than flight.
A lot of dinosaurs had feathers, and some could fly. Dinosaurs with feathers include, for example, Velociraptor (it might have been able to fly), Deinonychus, Archaeopteryx (could fly), Microraptor (could fly), Rahonavis (could fly), Gallimimus, Ornithomimus, Yutyrannus huali, Psittacosaurus, Psittacosaurus, Sinosauropteryx, Psittacosaurus, Sciurumimus, Kulindadromeus, Caudipteryx, and even young T-Rex and many others. We know dinosaurs had feathers based on fossil finds.
Life restoration showing an adult with feathers, based on those known from the related Ornithomimus. Picture is from Wikipedia. PaleoNeolitic, CC BY 4.0 https://creativecommons.org/licenses/by/4.0, via Wikimedia Commons
Remember the Velociraptors in the move Jurassic Park? In the movie they had scaly skin, but in reality, they had feathers. Also, the real velociraptors might have been able to fly. Wouldn’t that have made a better movie?
Velociraptor with feathers (well a little bit). Shutterstock Asset id: 2636534673 by Shutterstock AI Generator
Wind power saves a lot more birds than it kills
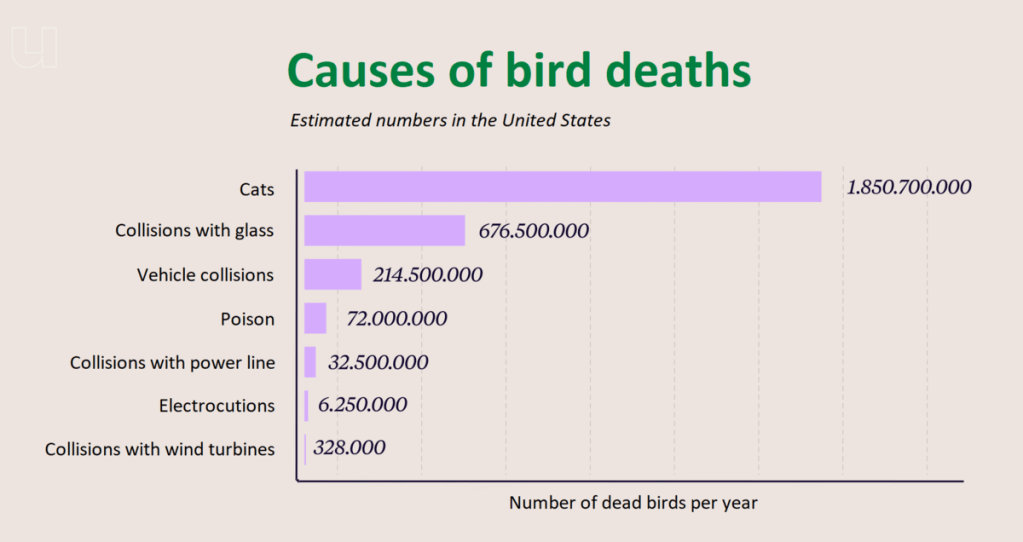
It may come as a surprise to some, but wind power is not a major cause of bird death. Wind farms are estimated to be responsible for losing less than 0.4 birds per gigawatt-hour (GWh) of electricity generated, compared to over 5 birds per GWh for fossil fueled power stations, see, for example this source. This means that replacing fossil fuels with wind power saves a lot more birds than wind power turbines take. In addition, cats, windows, cars, poison and powerlines are examples of things that kill a lot more birds than wind power does. Cats kill thousands of times more birds than wind power does, and this usually does not bother us. Note I love both dogs and cats.
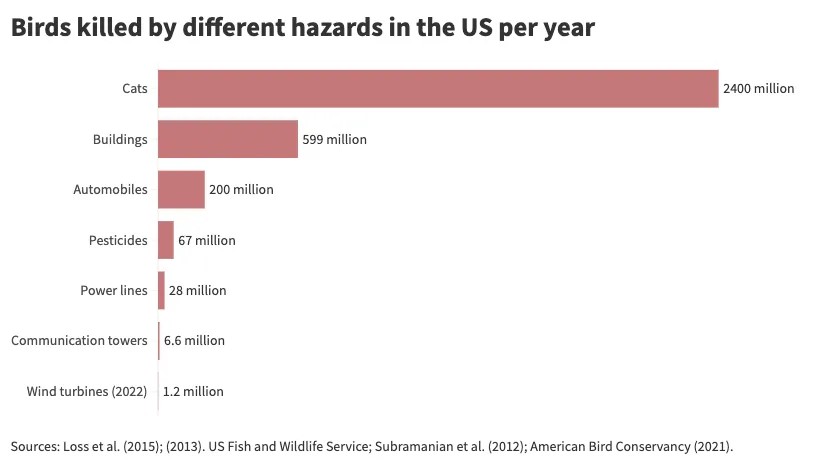
It is difficult to make exact estimates of bird deaths but below are some interesting graphs from reputable sources, confirmed by many other studies and analysis, such as this overview from MIT and this analysis by Hannah Richie. The numbers aren’t the same, but they make the same point. You can read more about this here.
From Wikipedia: Universiteit van Nederland, CC BY 3.0 https://creativecommons.org/licenses/by/3.0, via Wikimedia CommonsAn alternative graph taken from Hannah Richie / Our World in Data, using alternative sources essentially showing the same thing. Sources: Loss et al. (2015), (2013), US Fish and Wildlife Service; Subramnayan et al. (2012), American Bird Conservancy (2021).
That does not mean we shouldn’t do our best to reduce bird deaths from wind power stations. However, don’t fall for the misinformation that is trying to paint it is a big problem specifically for wind power. It is good to keep in mind that there are powerful organizations, politicians and individuals who are intentionally spreading a lot of misinformation about wind power and other renewables in an effort discredit them. One example is the series Landman which repeatedly makes demonstrably false and pretty wild claims. Landman is fiction, of course, but it is presented so it appears to be facts to unsuspecting viewers.
Birds don’t pee
Birds don’t pee liquid like mammals. They excrete waste as a white, pasty uric acid mixed with solid feces through a single opening. This means that they excrete only one type of droppings. This conserves water and keeps them lightweight for flight.
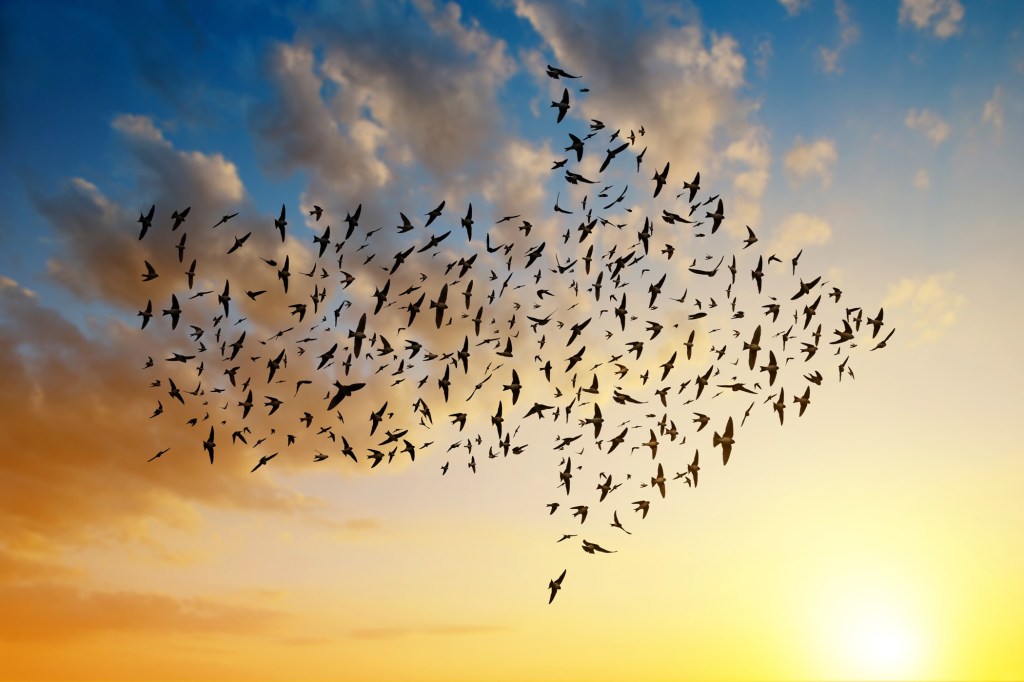
Birds can use Earth’s magnetic field to navigate
Migratory birds navigate long distances by using Earth’s magnetic field, which acts like a built-in GPS-like compass to determine direction and position. They have light-sensitive proteins called cryptochromes in their eyes, which enable them to see magnetic fields, and they can detect field intensity using magnetic crystals (magnetite) in their beaks or inner-ear cells. This enables them to know direction, inclination and position. The detection of the magnetic field is very fine and is believed to involve quantum mechanical mechanisms. You can read more about how migrating birds use quantum effects to navigate here
Silhouette of birds flying in arrow formation at sunset sky. Shutterstock Asset id: 717932599 by Vaclav Volrab
A sleeping bird flying. Picture generated with the help of ChatGPT.
Birds have hollow bones—but they’re super strong
Birds have hollow bones. They are not necessarily lighter but they’re super strong. The structure is denser and reinforced with internal struts, kind of like aerospace engineering. The bones are full of spaces for air giving them a more efficient respiratory system and allowing them to take in oxygen while both inhaling and exhaling.
Some birds use tools
New Caledonian crows craft hooks from sticks to fish insects out of holes. They carve, nibble and peel the tip of the stick until it has a hook. Striated Herons drop larvae, worms, and insects on the water to attract prey. They sometimes break sticks into pieces to use as artificial bait to attract fish. Rooks, corvid bird, drop rocks into water to raise the water level so that they can reach prey. Carrion crows use traffic to crack hard-shelled nuts.
For example, they drop walnuts on busy roads, often at pedestrian crossings, and wait for cars to crush them, then retrieving the food during red lights. Egyptian Vultures pick up stones in their beaks and throw them at large, hard-shelled eggs to break them. There are many other examples.
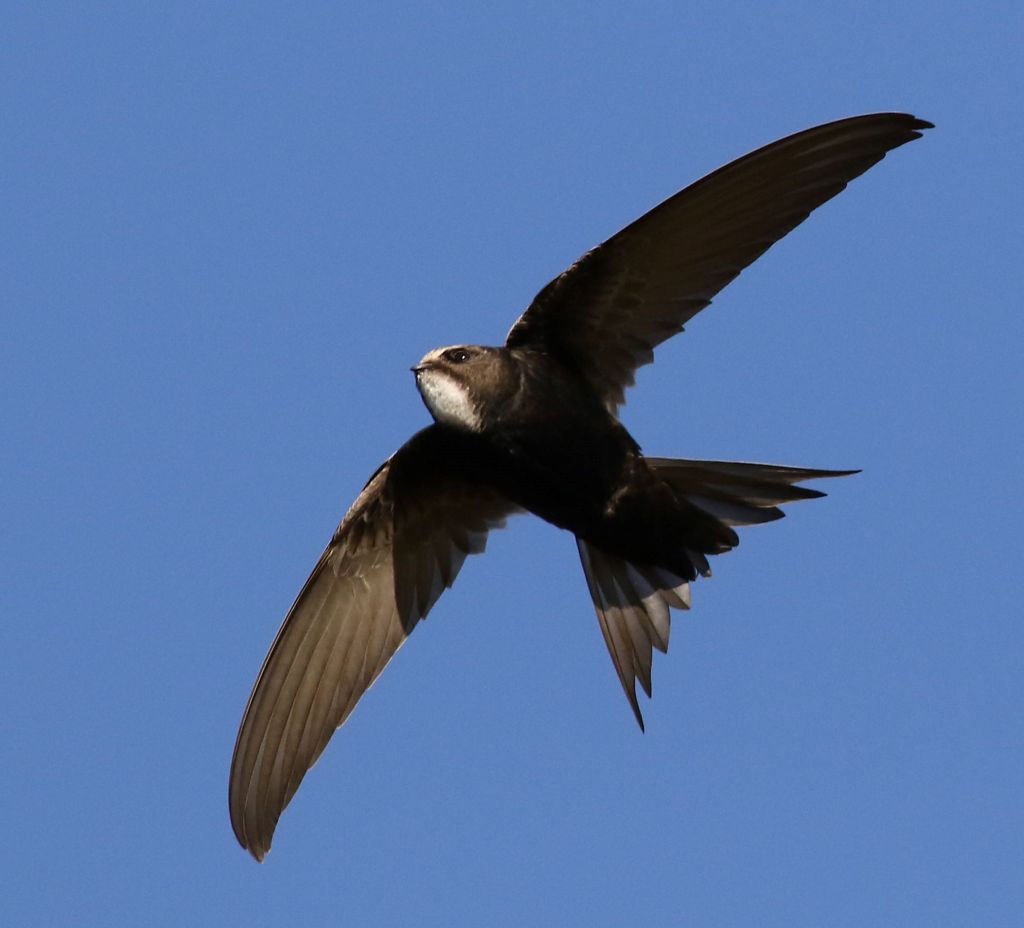
Swifts can stay airborne for 10 months
Common swifts can stay airborne for up to 10 months without landing during their non-breeding migration. They eat, drink, sleep, and even mate while in flight, only landing to nest for two months in the summer.
White-rumped swift, Apus caffer, at Suikerbosrand Nature Reserve, Gauteng, South Africa. Derek Keats from Johannesburg, South Africa, CC BY 2.0 https://creativecommons.org/licenses/by/2.0, via Wikimedia Commons.
Chickens can recognize up to 100 faces
Chickens don’t just recognize other chickens; they also recognize human faces. Chickens remember positive or negative experiences with the faces they recognize and pass that information on to members of their flocks. Let’s think about that while we chew on our chicken nuggets.
Robbie Cheadle posted the second part of my guest post on Scandinavian Folklore on LatinosUSA. LatinosUSA is an amazing and very interesting online magazine/blog featuring poetry, stories and all kinds of interesting content from around the world. She also included a kind review of my Leonberger book Le Life and Times of Le Bronco von der Löwenhöhle, and I am very grateful for that.
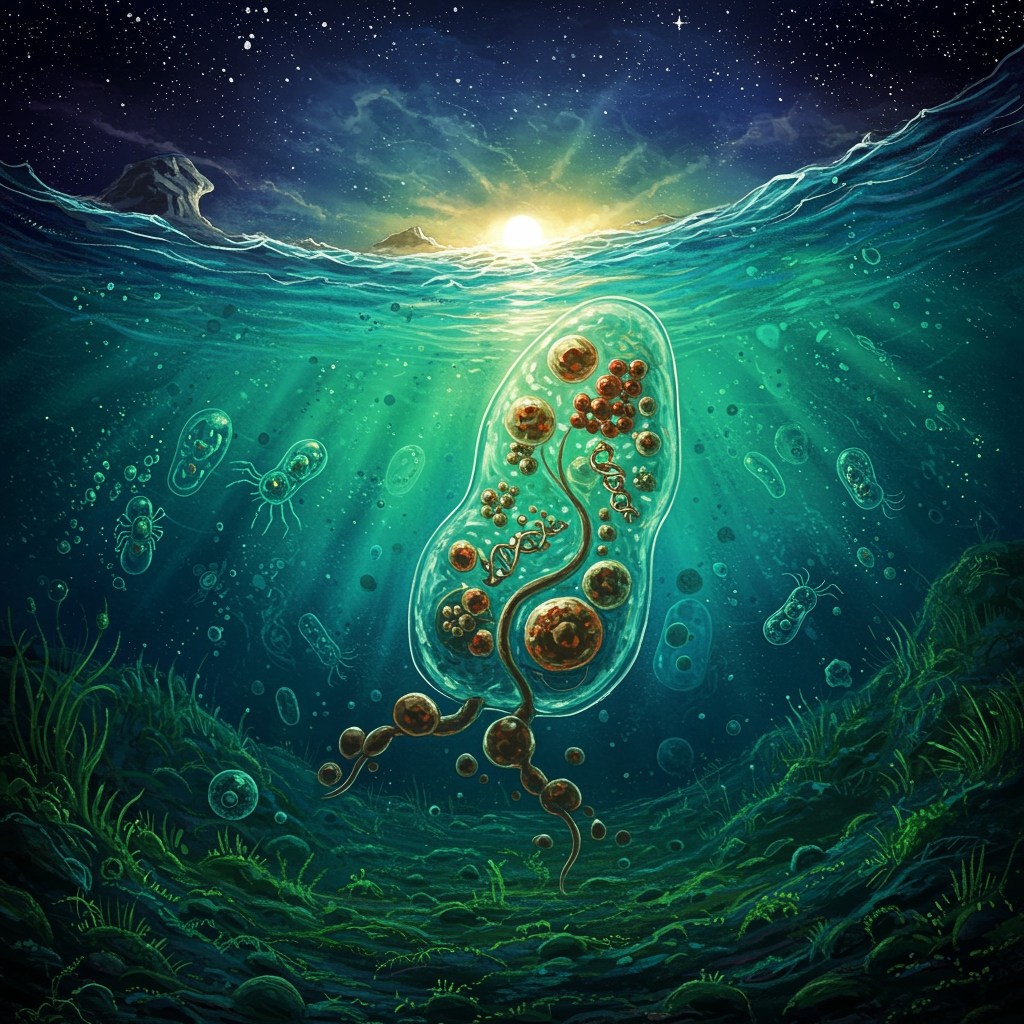
Super fact 82 : All known cellular life descends from a single Last Universal Common Ancestor (LUCA). All animals, all plants, fungi, algae, green and red algae, kelp, phytoplankton, cyanobacteria, amoebas, amoebozoa, diatoms, stramenopiles, rhizaria, hacrobia, all eukaryote, all archaea, all bacteria, all the millions of species on Earth come from one single ancestor known as the Last Universal Common Ancestor – LUCA. Viruses are an exception, but viruses are not considered life.
Last Universal Common Ancestor creation Shutterstock Asset id: 2666598705 by Shutterstock AI
The answer is genome mining. By surveying nearly 2000 genomes of modern microbes we not only know that all life has a common ancestor (LUCA), that lived roughly 4.2 billion years ago, but we also know that it thrived near hydrothermal vents as part of a larger microbial community. This is analogous to another of my posts “Humans and Chimpanzees Have a Common Ancestor”. By sequencing human DNA and chimpanzee and bonobo DNA we know that humans and chimpanzees have a common ancestor. No fossils, or other information from the past is needed. DNA is a great tool for determining relationships between species and for finding information about past life, without the need of fossils.
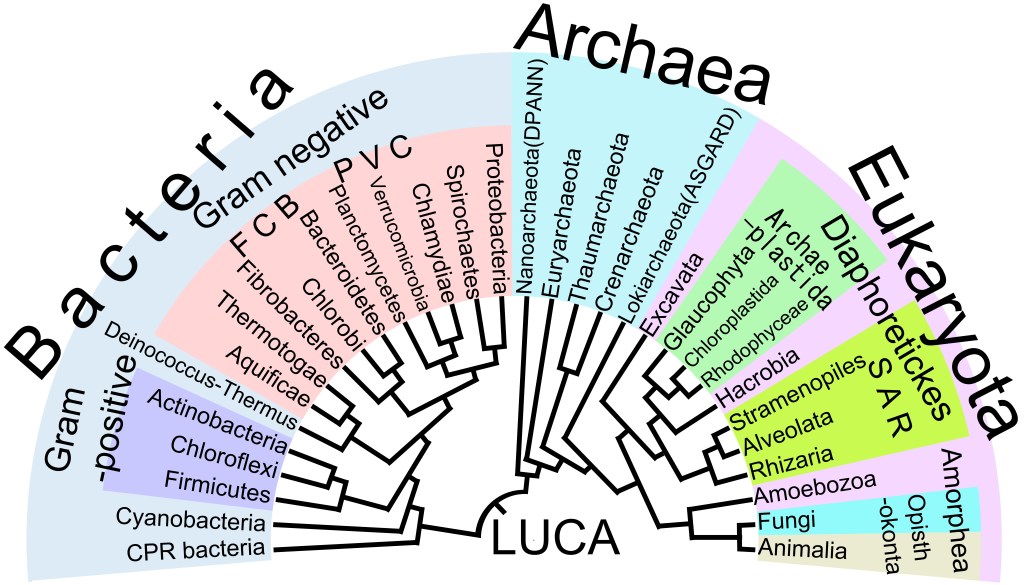
To be more specific, the detailed biochemical similarity of all current life makes the existence of LUCA widely accepted by biochemists. There is a Universal Genetic Code, which means that nearly all living things use the same DNA/RNA-based genetic code to translate genetic information into proteins. There is a shared molecular machinery, for example, all life relies on ribosomes for protein synthesis, similar energy carriers like ATP, and the same 20 amino acids. All life uses the same mirror-image form of molecules, a signature of a single, common ancestry. In addition, there is a “core” set of 355 gene families present in both modern bacteria and archaea, which were likely inherited from LUCA. Finally, we have phylogenetic mapping, protein-sequence-based phylogenetic trees converge on a single root, indicating a common ancestry for all life. See the phylogenetic tree of life below.
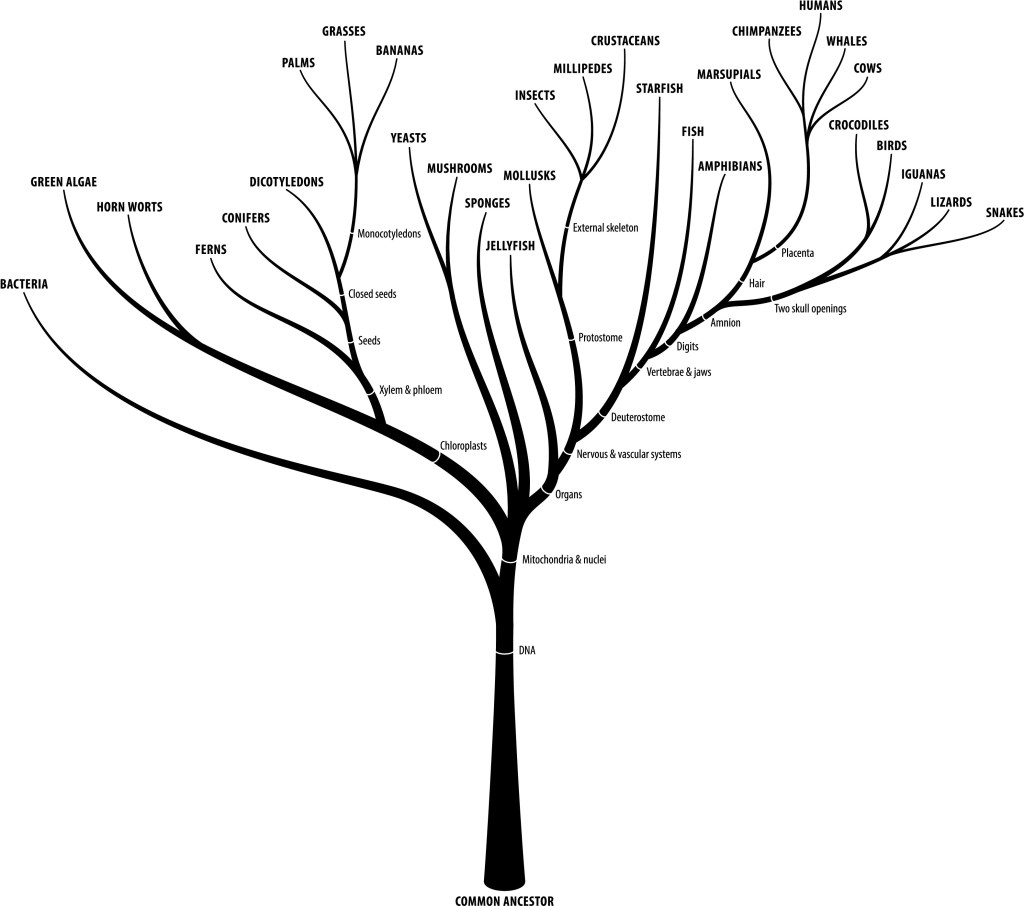
Below is another view of the diversification of life that focuses on the inventions made by life.
The evolutionary tree of life showing diversification, branching and key characteristics of each branch. Shutterstock Asset id: 228953155 by Zern Liew
It should be noted that in addition to viruses there were likely other forms of life that existed alongside LUCA or before it. There was likely non-cellular life as well as cellular life that died out, RNA-based life, self-replicating nucleic acids, etc. It should also be noted that if some of the large viruses were to be reclassified as life, or a life form not based on LUCA were to be discovered then our “current LUCA” would no longer be LUCA, but just the ancestor of “almost all life”. That would still be amazing, just slightly less so.
The existence of LUCA brings up an interesting question. What would happen if we found DNA based life on another planet and its DNA showed that it also originated from LUCA ?