The Unfolding Clean Energy Revolution

Superfact 100: The share of fossil fuels for electricity generation is decreasing and EVs are replacing internal combustion engines. The share of hydro and nuclear energy, which is clean energy,  is decreasing, but the sharp increase in the share provided by renewables such as wind and solar is more than making up for it. In addition, there are new clean energy sources that are very promising but not yet widely implemented such as geothermal energy and fusion energy. The energy landscape is changing rapidly.
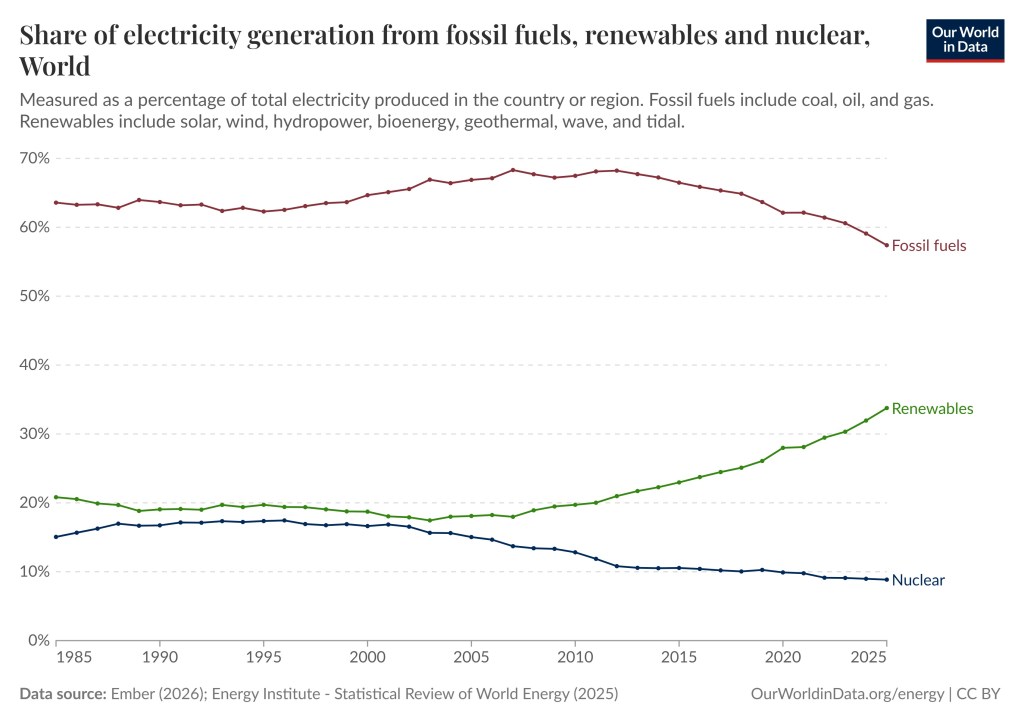
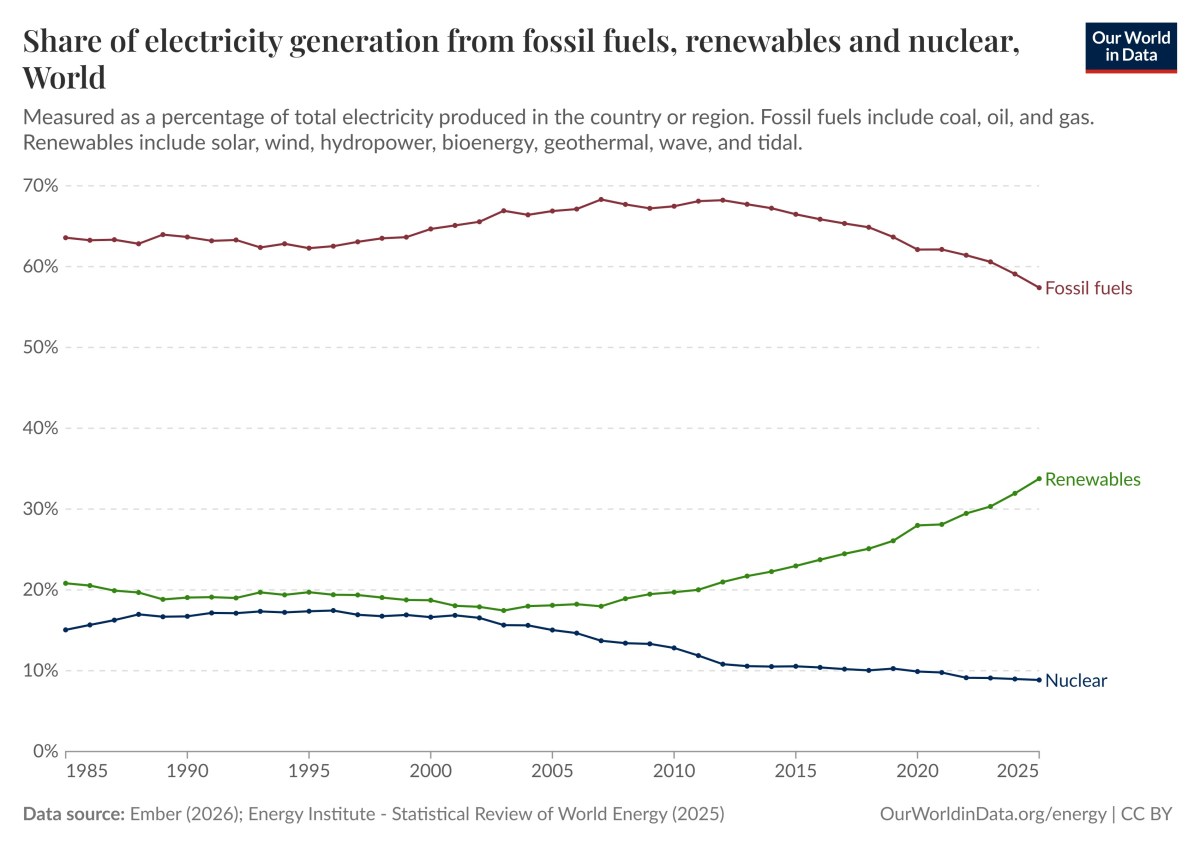
The chart includes three graphs showing the share of the world’s electricity generated by fossil fuels, nuclear and renewables from 1985 to 2025. | The Unfolding Clean Energy Revolution
Share of electricity generation from fossil fuels, renewables and nuclear, world. Measured as a percentage of total electricity produced in the world. Fossil fuels include coal, oil and gas. Renewables include solar, wind, hydropower, bioenergy, wave and tidal. Data source Ember (2026): Energy institute – Statistical Review of World Energy (2025)  OurWorldinData.org/energy | CC BY.

As can be seen in the graph above the share of electricity in the world generated by fossil fuels has gone down in recent years (from 66.48% in 2015 to 57.39% in 2025), and the share of electricity generated by nuclear has also gone down (from 10.55% in 2015 to 8.85% in 2025) whilst the share of electricity generated by renewables has increased (from 22.97% in 2015 to 33.76% in 2025). This is even though the most prominent source of renewable energy, hydro, has decreased its share substantially (from 16.2% in 2015  to 14% in 2025) as can be seen in the graph below.

What is going on is that two sources of renewable energy, wind and solar, have increased their share of electricity generated substantially (wind: from 3.5% in 2015 to 8.5% in 2025) and (solar: from 1.1% in 2015 to 8.7% in 2025), which can be seen in the graph below. It should be noted that renewable energy encompasses solar, wind, hydropower, bioenergy, geothermal, wave, and tidal sources.

To play around with the graph above and other similar graphs click here and select and look at the bottom charts. To play around with the graph below and similar graphs click here and select and look at the bottom charts.
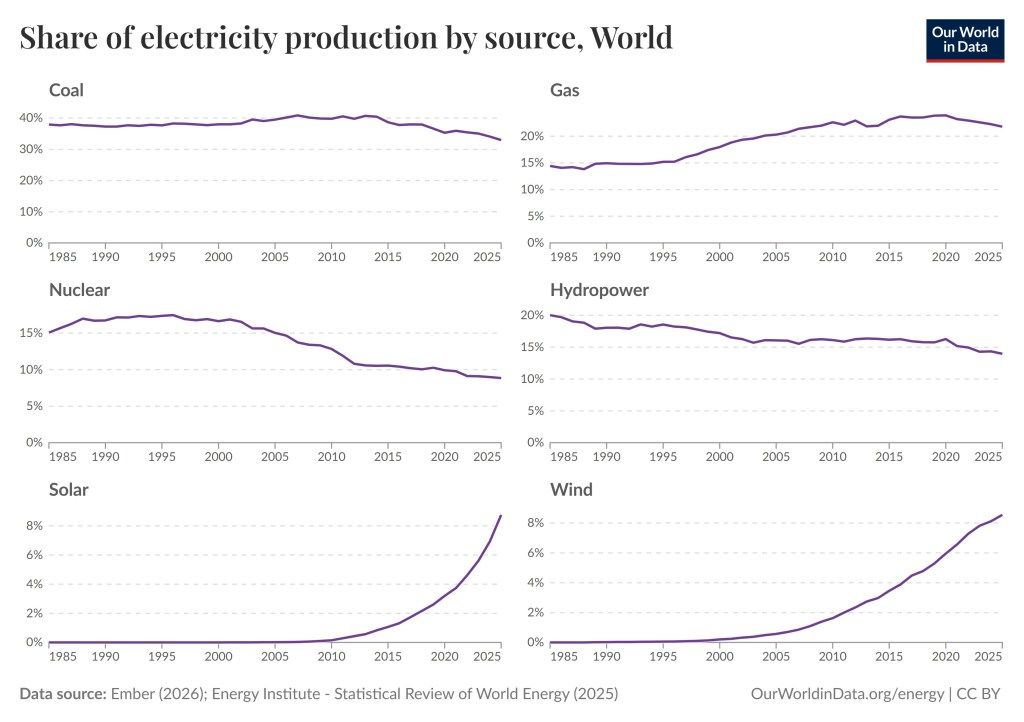
There are six graphs depicting the share of electricity production by six sources, coal, gas, nuclear, hydropower, solar and wind from 1985 to 2025. The graphs show that the share of electricity production by coal, gas, nuclear and hydropower have gone up and down but have been relatively steady with a decline over the last ten years. At the same time wind and solar have gone from almost to a sharp increase over the last 10-15 years.
Share of electricity production by source, World. Data source (2026): Energy Institute – Statistical Review of World Energy (2025)  OurWorldinData.org/energy | CC BY.

So far, I’ve been talking about the share of electricity production in the world by different energy sources. However, the world is using more and more electricity. Populations are growing, economies are growing, and the world is electrifying, for example, because of the worldwide adaption of EVs.

Just because an energy source’s share of electricity production is decreasing does not mean its total global electricity generation by that source is decreasing. In fact, as the share of electricity production by fossil fuels has decreased, the total production of electricity by fossil fuels has increased, well up until now. For the first time in history the total global electricity generation by fossil fuels went down in 2025. Note that since coal and oil decreased in the graph below fossil fuel consumption for electricity declined in 2025, despite s small increase in gas. This means that the use of fossil fuels is finally decreasing.
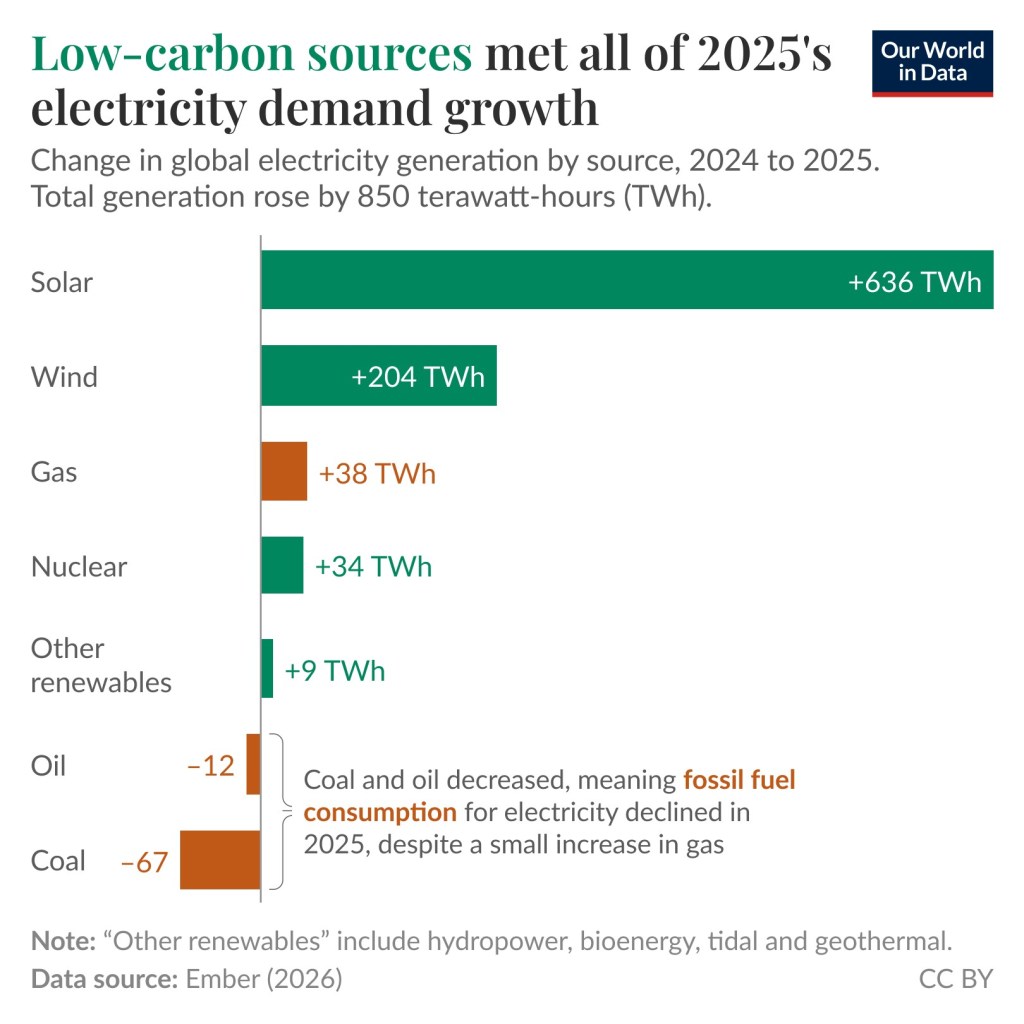
This is a bar graph showing an increase of 38TWh from gas, a decrease of 12TWh from oil, and a decrease of 67TWh from coal. The energy from wind, solar, nuclear, and other renewables increased by 850TWh. | The Unfolding Clean Energy Revolution
Low carbon sources met all of 2025’s electricity demand growth. Change in global electricity generation by source, 2024 to 2025. Total generation rose by 850 terawatt-hours (TWh). Note: “Other renewables” include hydropower, bioenergy, tidal and geothermal. Data source: Ember (2026). This graph comes from this page.

The practice of burning fossil fuels to generate electricity and for transportation is becoming less dominant. I believe this fact is surprising to many people, especially Americans since the current administration has taken a strong anti-renewable and anti-climate-science stance, and many Americans are not aware of what is happening in the rest of world in this regard. Superfact #100 is a super fact because the data is reliable, it is surprising to many people, and it is important.

It should be noted that we will likely keep using fossil fuels to produce fertilizers, plastics, medicines, and chemicals for a long time. However, this corresponds to only a few percent of our current use of fossil fuels and seems to be a lot better use of fossil fuels than burning it all up for energy. In fact, we may need the remaining fossil fuels for that purpose. In this post I am using data provided by Our World in Data which in turn got data from Ember Energy, or the International Energy Agency.

The Current Administration’s Opposition to Renewables and Climate Science

I am trying to keep politics out of my blog. However, the current administration’s strong opposition to and the misinformation they disseminate about renewables and climate science makes it difficult to discuss this renewable energy without bringing it up. It is an important piece in our understanding of what is going on. The misinformation about climate science (and other scientific topics) has bamboozled a lot of people and the actions taken to hinder the deployment of renewables have had real consequences. However, it is important to remember that the current situation here in the US is temporary and has a limited impact on the rest of the world.

Some actions that current administration has taken are:

  • Science organizations such as NOAA and NFS-NCAR have had their budgets severely cut and have been threatened to be dismantled. Websites related to climate science have been taken down. Click here to read more. NASA is also threatened to have its science programs severely cut (by 47%), as well as other programs, but it has not yet been implemented. Click here to read more.
  • Restricting or ordering the freezing of permits for renewables, canceling tax credits and investment credits for renewables, ordering the cancelation of renewables under construction, for additional information click here, or here.
  • In 2009 the EPA found that atmospheric concentrations of greenhouse gases endanger both current and future generations, enabling EPA to regulate greenhouse gases. This, so called endangerment finding was overturned in February 2026 by the administration. This article explain why there is no Scientific justification to revoke the endangerment finding.
  • The administration paid one billion dollars to France’s TotalEnergies in exchange for not developing windfarms on the east coast (kind of a bribe).
  • Pentagon has frozen permitting since last August halting more than 250 onshore wind projects, including those on private land, which is not only preventing us from meeting our energy needs, but is indirectly a violation of private property rights.
  • The United States is the only country to have withdrawn from the Paris Agreement (January 27, 2026). Three other countries, Iran, Libya, and Yemen, did not join.
  • 95,000 employees, including 10,000+ with PhD’s, at government science agencies (more than a third of them) have either been laid off / fired, or left, as a result of current policies. This effects CDC, NIH (National Institute of Health), and especially anything related to climate science. Many scientists have left the US for Europe.

There is not wonder many in the United States incorrectly believe clean energy is on its way out. I should say that even though support for solar and wind has declined in the US, solar and wind remain the sources of energy that most people want the federal government to encourage over any other source of energy, according to this Pew Research article.

Important Climate and Energy Facts

As I said, the misinformation about climate science has bamboozled a lot of people. As an example. We know that climate change / global warming is happening. We have also known for several decades that the current climate change / global warming is not natural. It is caused by us, chiefly due to the burning of fossil fuels. The scientific evidence is conclusive. It includes satellites directly measuring our greenhouse gases trapping heat, the upper troposphere is cooling whilst the lower atmosphere is warming, showing that the heating is from greenhouse gases, the unnatural speed of the warming, isotope studies, climate models, etc. How many people know about this? I believe very few people do. Below are eleven related super facts.

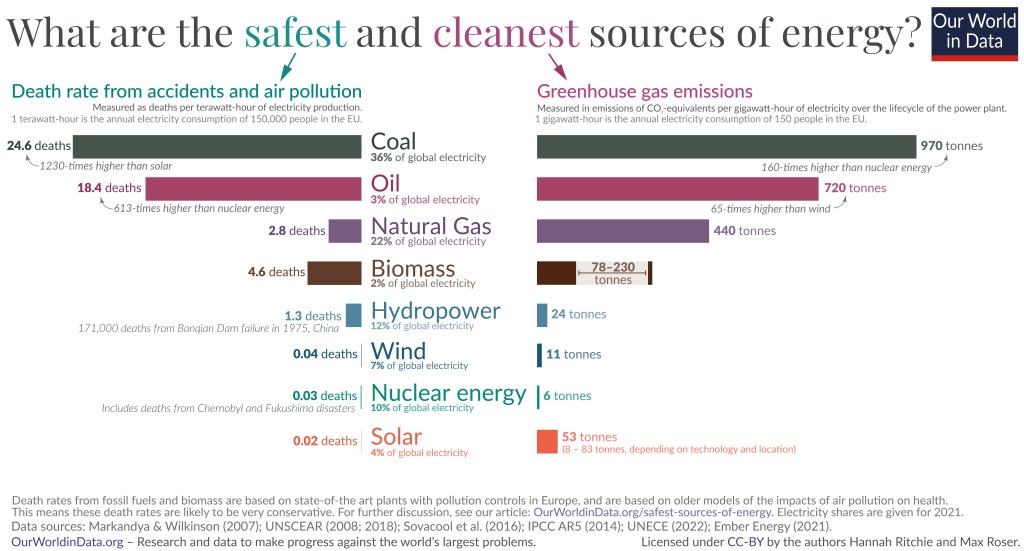
The graph depicts death rates and greenhouse gas emissions per unit for different energy sources including coal, oil, natural gas, biomass, hydropower, wind, nuclear power, and solar.
Greenhouse gas emissions and death rates from various sources of energy. Fossil fuels and biomass are based on state-of-the art plants with pollution control in Europe and are based on older models of the impacts of air pollution on health. This means that these death rates are likely to be very conservative. The graph shows that renewables and nuclear are the cleanest and safest forms of energy. For further discussion see the article: OurWorldinData.org/safest-sources-of-energy. Electricity shares are given for 2021. Data sources: Markandya & Wilkinson (2007); UNSCEAR (2008: 2018); Sovacol et al. (2016); IPCC AR5 (2014); UNECE (2022); Ember Energy (2001). OurWorldinData.org – Research and data to make progress against the world’s largest problems. Licensed under CC-BY by the authors Hannah Ritchie and Max Roser. Citation : Hannah Ritchie (2020) – “What are the safest and cleanest sources of energy?” Published online at OurWorldinData.org. Retrieved from: ‘https://archive.ourworldindata.org/20260202-100556/safest-sources-of-energy.html’ [Online Resource] (archived on February 2, 2026).

The Share of EVs

Another phenomenon that results in less burning of fossil fuels than we otherwise would have is that electric cars and plug-in hybrid are becoming more common in the world. Going from nearly non-existent in 2010 electric cars (EVs) are now starting to show up around the world. The share of electric cars on the roads in 2024 was in the United States was 2.7%, in the world 4.5%, in China 11%, in Sweden 13% and in Norway 32%.

What matters more (for the future) is the sale of new EVs and plug-in hybrids. The share of new cars that are electric was 22% for the world, 10% in the United States, 21% in the EU, 28% in the United Kingdom, 48% in China, 58% in Sweden, 92% in Norway. In 2025 the share of new cars that were electric was 98% in Norway according to this website. To see more EV statistics and play around with various graphs visit this link.

One thing that might be surprising to Americans is that EVs are quite common in many other countries including EU, the Scandinavian countries, and China. Another is that EVs are indeed significantly cleaner than internal combustion engines, even when charged from a relatively dirty grid. See this super fact (29) EV Cars Indeed Emit Less Carbon Pollution.
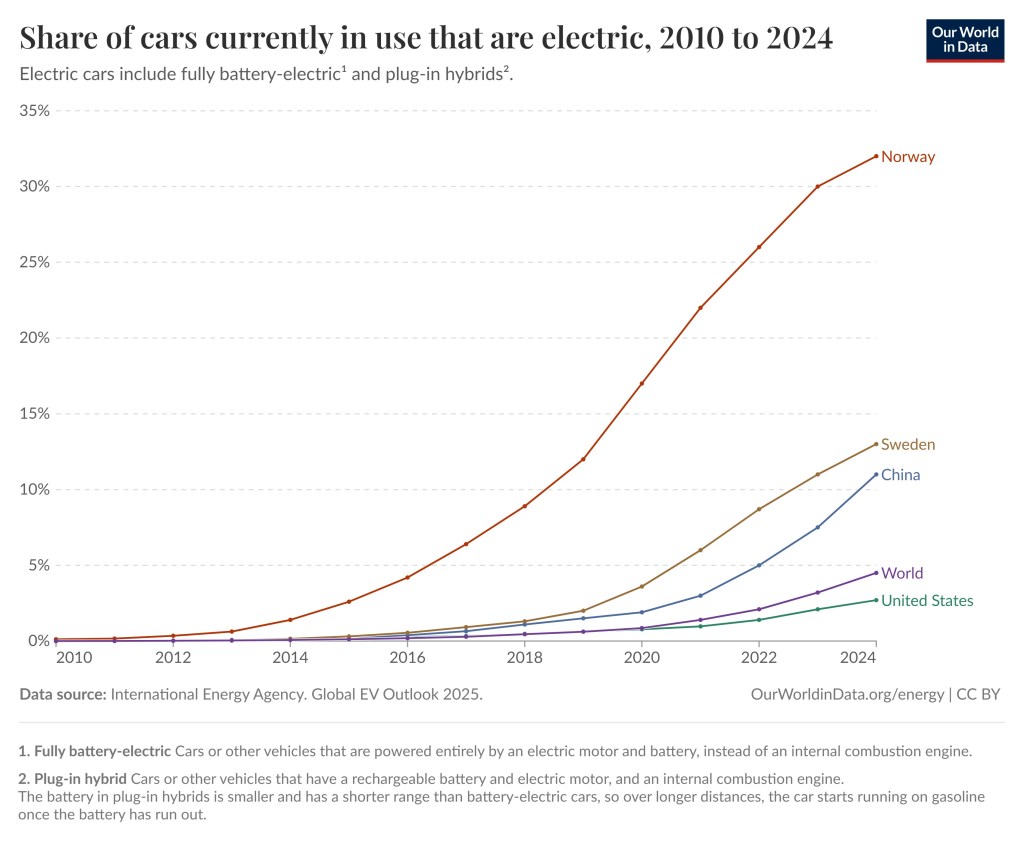
The graph shows the share of cars currently in use that are electric for the world, the United States, China, Sweden and Norway.
Share of cars currently in use that are electric, 2010 to 2024. Electric cars include fully battery-electric and plug-in hybrids. With battery-electric cars is meant cars or other vehicles that are powered entirely by an electric motor and battery, instead of an internal combustion engine. With plug-in hybrid is meant cars or other vehicles that have a rechargeable battery and electric motor, and an internal combustion engine. The battery in plug-in hybrids is smaller and has a shorter range than battery-electric cars, so over longer distances, the car starts running on gasoline once the battery has run out.
Data source: International Energy Agency Global EV Outlook 2025.   OurWorldinData.org/energy | CC BY
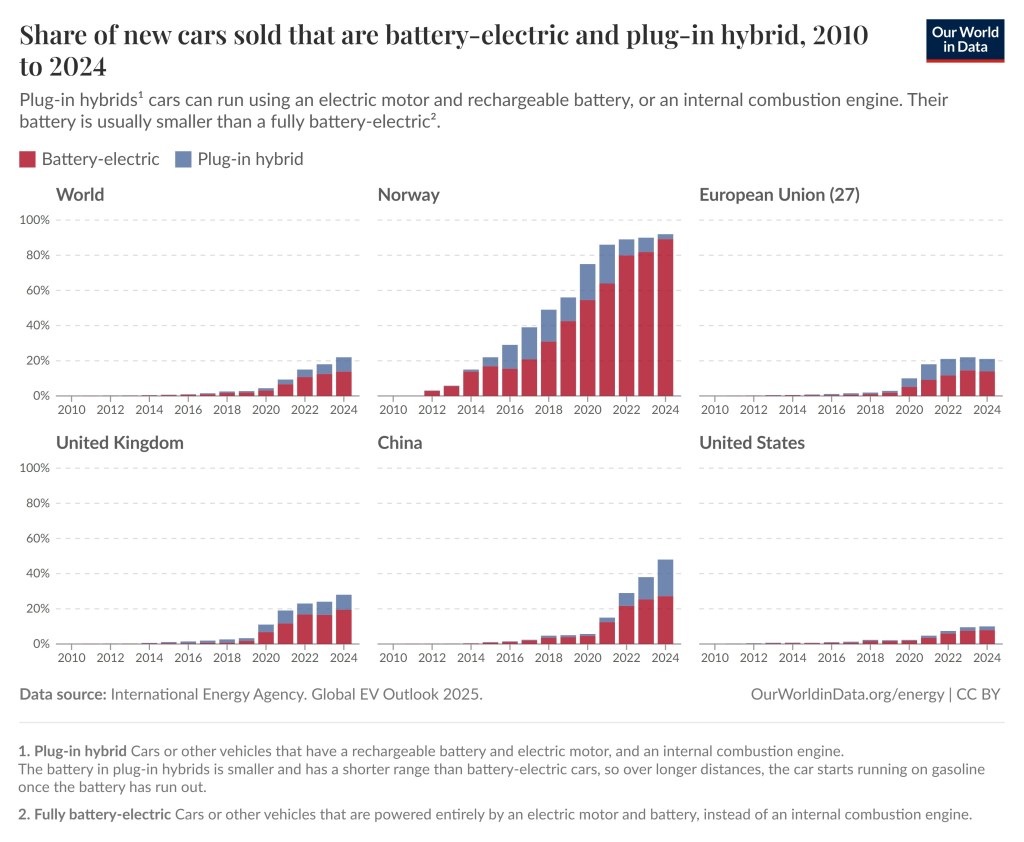
Share of new cars sold that are battery-electric (in brown) and plug-in hybrid (in blue), 2010 to 2024, for six countries and regions, including the world, United States, United Kingdom, China, Norway and the European Union. | The Unfolding Clean Energy Revolution
Battery-electric cars are depicted with brown and plug-in hybrid in blue. Share of new cars sold that are battery-electric and plug-in hybrid, 2010 to 2024. Plug-in hybrids cars can run using an electric motor and rechargeable battery, or an internal combustion engine. Their battery is usually smaller than a fully battery-electric. Data source: International Energy Agency Global EV Outlook 2025.   OurWorldinData.org/energy | CC BY
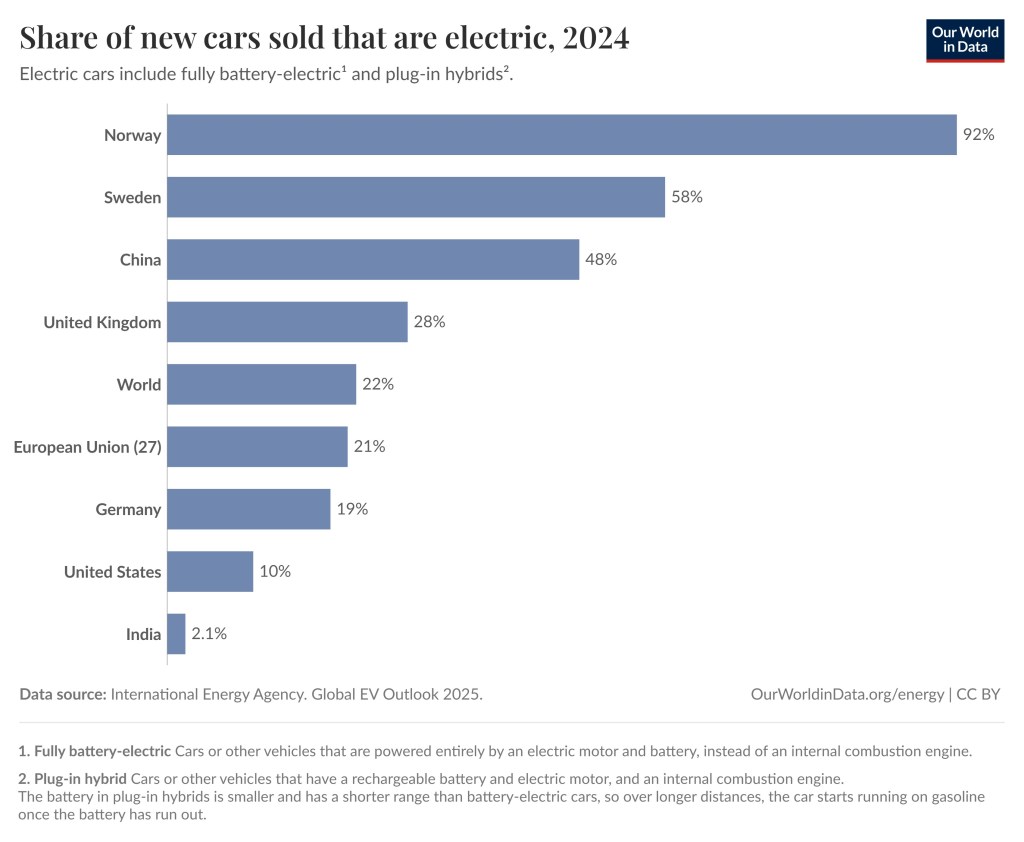
The bar graph shows the share of new cars sold that are electric in 2024 for the world and 8 countries. The numbers are India 2.1%, the United States 10%, Germany 19%, European Union 21%, United Kingdom 28%, China 48%. Sweden 58%, Norway 92%, and the World 22%
Share of new cars sold that are electric, 2024. Electric cars include fully battery-electric and plug-in hybrids. Data source: International Energy Agency  Global EV Outlook 2025.  OurWorldinData.org | CC BY

Share of electricity production by source EU, US, China

The first graph in this post depicted the share of electricity production by source for the world. The graph below breaks it up to show the share of electricity production by source for the three largest economies in the world, the United States, China and the EU. Again, the share of energy from coal, nuclear and hydro is decreasing whilst the share from wind and solar is going up for all three markets. One notable difference from the top graph is that gas keep increasing for the United States.
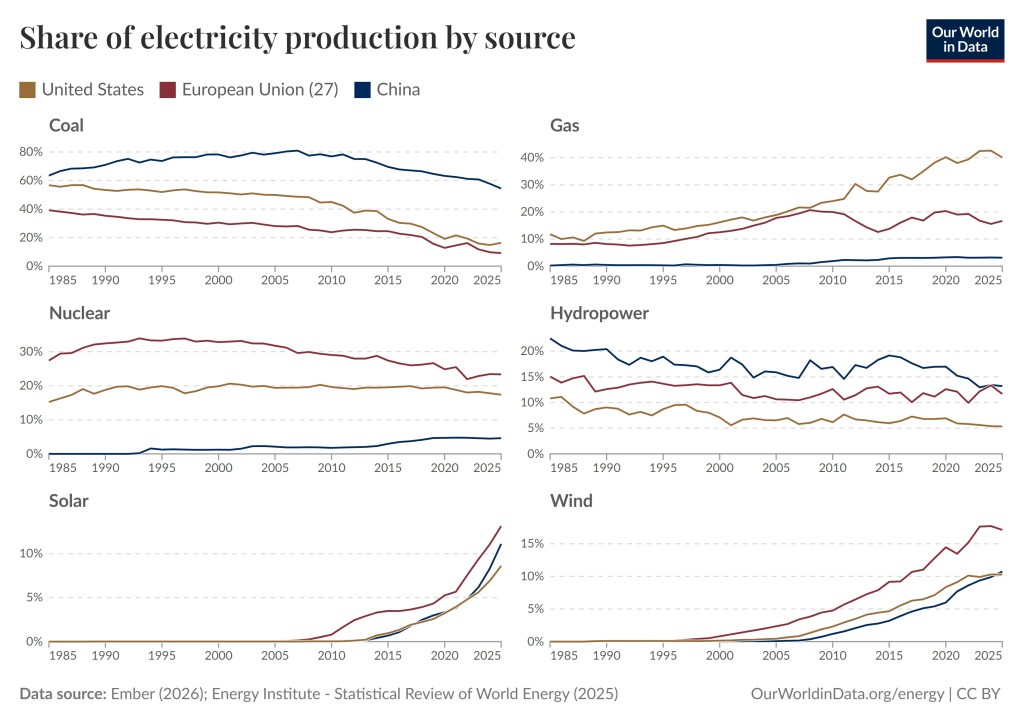
There are six charts in the picture depicting share of electricity production by coal, gas, nuclear, hydro, solar and wind. Each charts show three graphs in different colors representing the United States, the European Union, and China. | The Unfolding Clean Energy Revolution
Share of electricity production by source, United States, European Union, and China. Data source: Ember (2026): Energy Institute – Statistical Review of World Energy (2025)     OurWorldData.org/energy | CC BY

The Share of Electricity Production from Wind

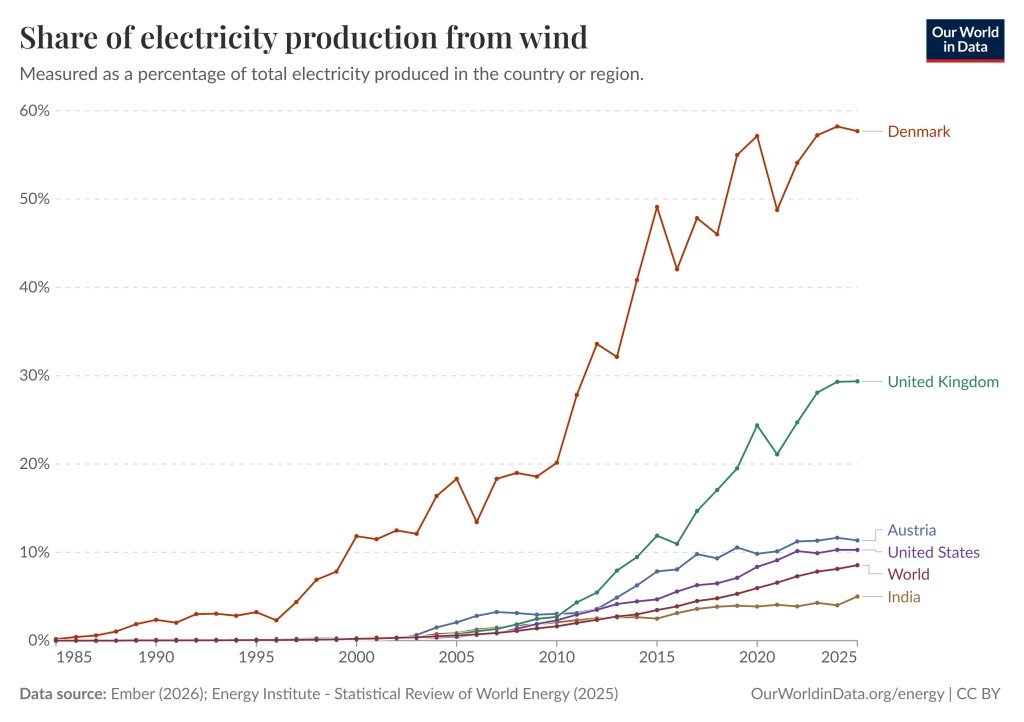
Below are a few charts depicting the share of electricity production from wind. The first graph is already included in the second chart from the top (above). However, this is a close up. The second graph depicts the share of electricity production from wind for multiple countries. It should be noted that Denmark and the United Kingdom are prominent users of wind power. For Denmark the share of electricity production from wind is almost 60%. By clicking here you can play around with the graphs and generate as many different graphs as you wish.
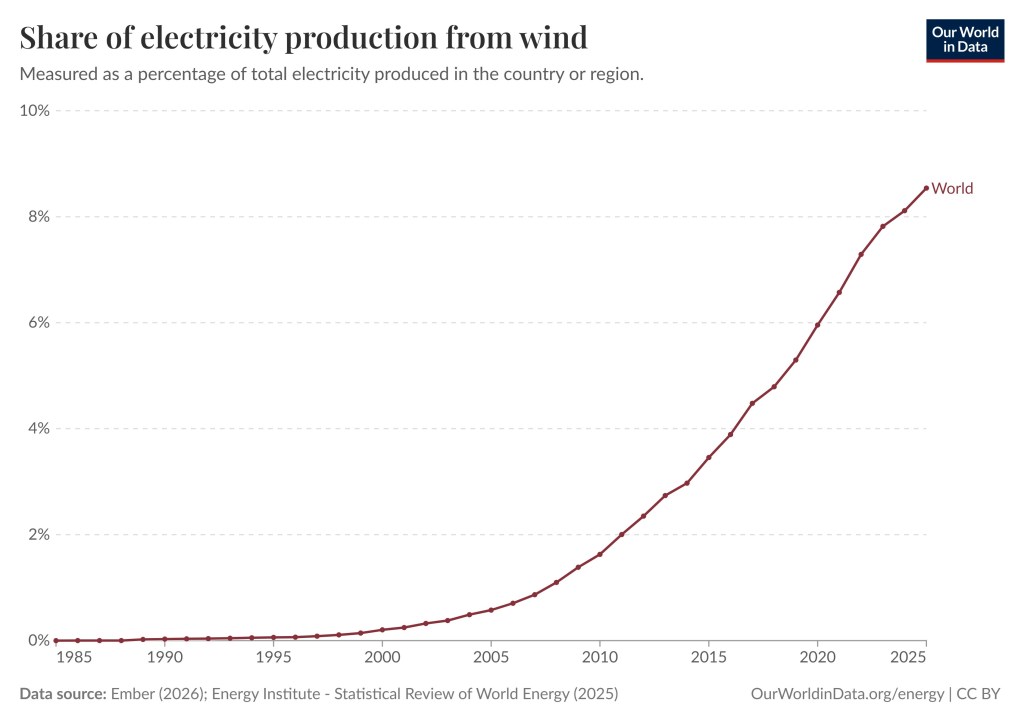
This graph shows the share of electricity production from wind for the world. In 1985 it is 0%, in the year 2000 it is 0.2%, in 2010 it is 1.6%, in 2015 3.5%, in 2020 4.0%, and in 2025 8.5%.
Share of electricity production from wind. Measured as a percentage of total electricity produced in the world. Data source: Ember (2026): Energy Institute – Statistical Review of World Energy (2025)   OurWorldinData.org/energy | CC BY
This graph shows the share of electricity production from wind for the world and for five selected countries, India, United States, Austria, United Kingdom, and Denmark. Denmark uses the most wind power at 57.7%.
Share of electricity production from wind. Measured as a percentage of total electricity produced in the country or region. Data source: Ember (2026): Energy Institute – Statistical Review of World Energy (2025)   OurWorldinData.org/energy | CC BY
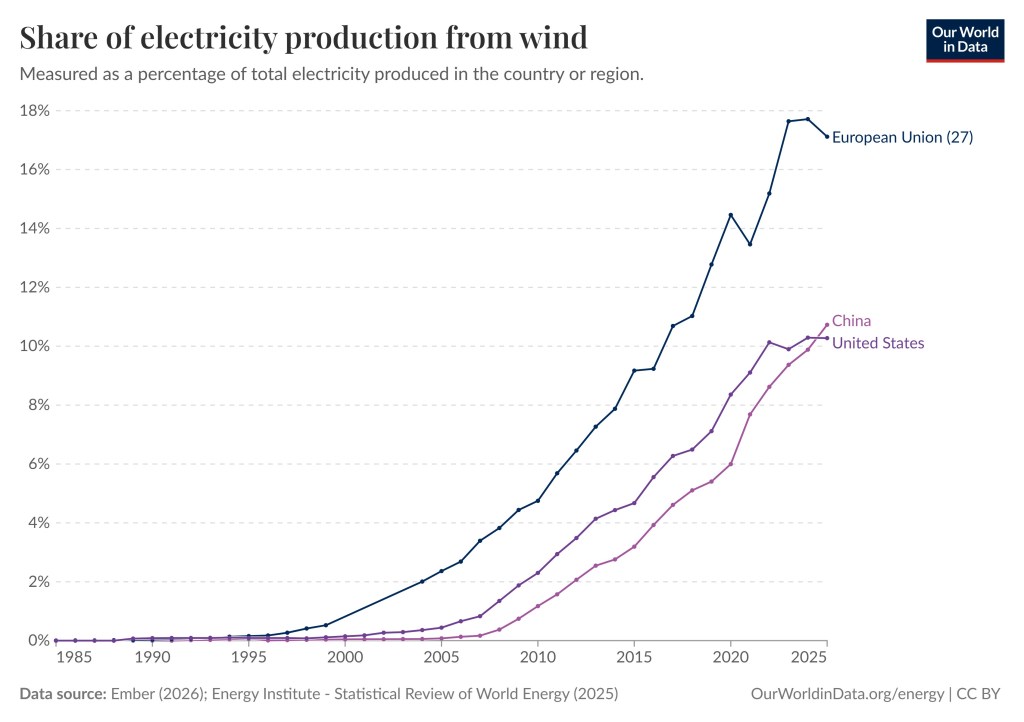
The graph shows the share of electricity production from wind for the United States (dark blue), China (purple), and the European Union (blue).
Share of electricity production from wind. Measured as a percentage of total electricity produced in the United States, China and the European Union. Data source: Ember (2026): Energy Institute – Statistical Review of World Energy (2025)   OurWorldinData.org/energy | CC BY

The Share of Electricity from Solar

The share of electricity from Solar for the world has grown from essentially 0% in the year 2000 to 3.19% in 2020 to 8.75% in 2025. For solar, the United States follows the rest of the world closely. Some countries have a higher percentage, such as the Cook Islands – 50%, Luxembourg – 30.52%, Chile – 25.06%. If you wish you can take a look here, or here, and you can play around with the different graphs. You can create millions of scenarios at your pleasure.
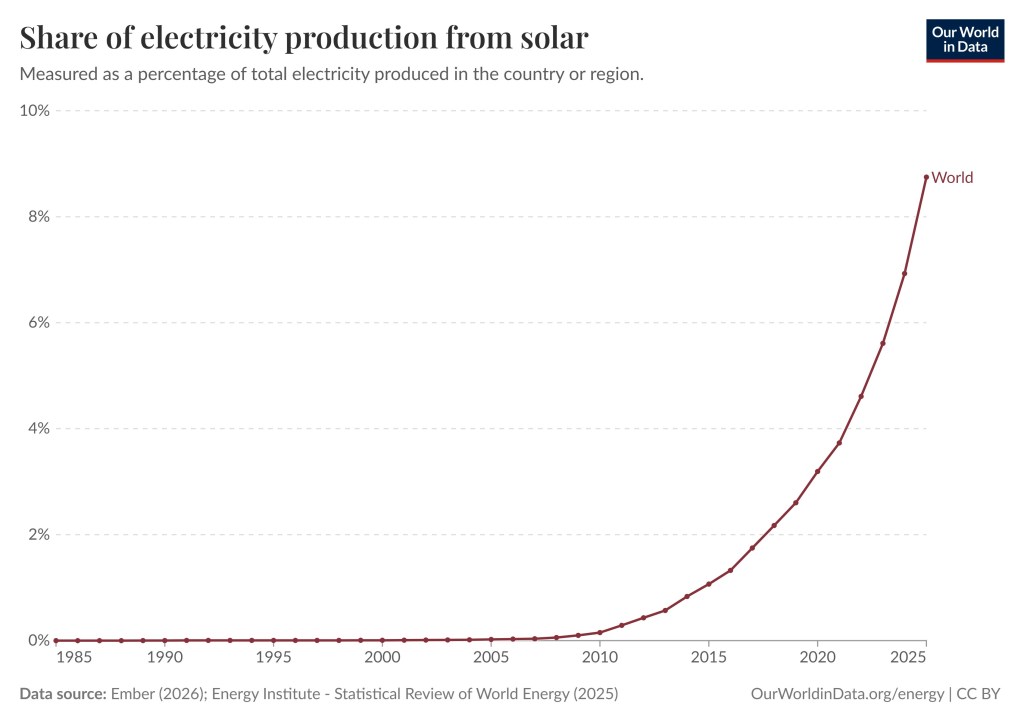
The graphs shows that the share of electricity from Solar remained nearly zero until the very recent sharp increase. | The Unfolding Clean Energy Revolution
Share of electricity from Solar. Measured as a percentage of total electricity produced in the country or region. Data source: Ember (2026): Energy Institute – Statistical Review of World Energy (2025)    OurWorldinData.org/energy | CC BY

The Share of Electricity Production from Hydropower

Hydro is a renewable energy source but its share of electricity production in the world has gone down. Unlike solar and wind, hydro is not an intermittent source of energy, so that is not necessarily something to celebrate. The intermittency of solar and wind can be mitigated using batteries, or energy sources that are not intermittent, preferably clean energy sources such as hydro and nuclear. Hydro is still the world’s most popular renewable energy source but that is changing quickly.

The graph below shows that the share of electricity production from hydropower for the world is 13.96%, USA 5.35%, Bhutan 100%, Norway 90.03%, Brazil 51.78%, Sweden 39.97%. If you wish you can take a look here, or here, and you can play around with the different graphs. You can create millions of scenarios at your pleasure.
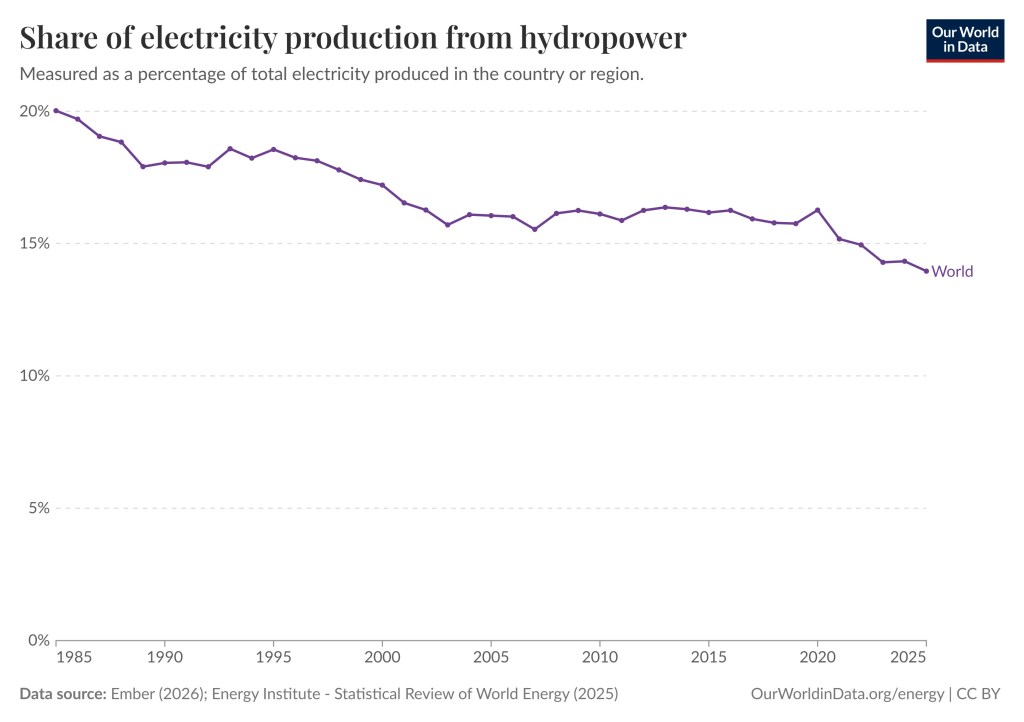
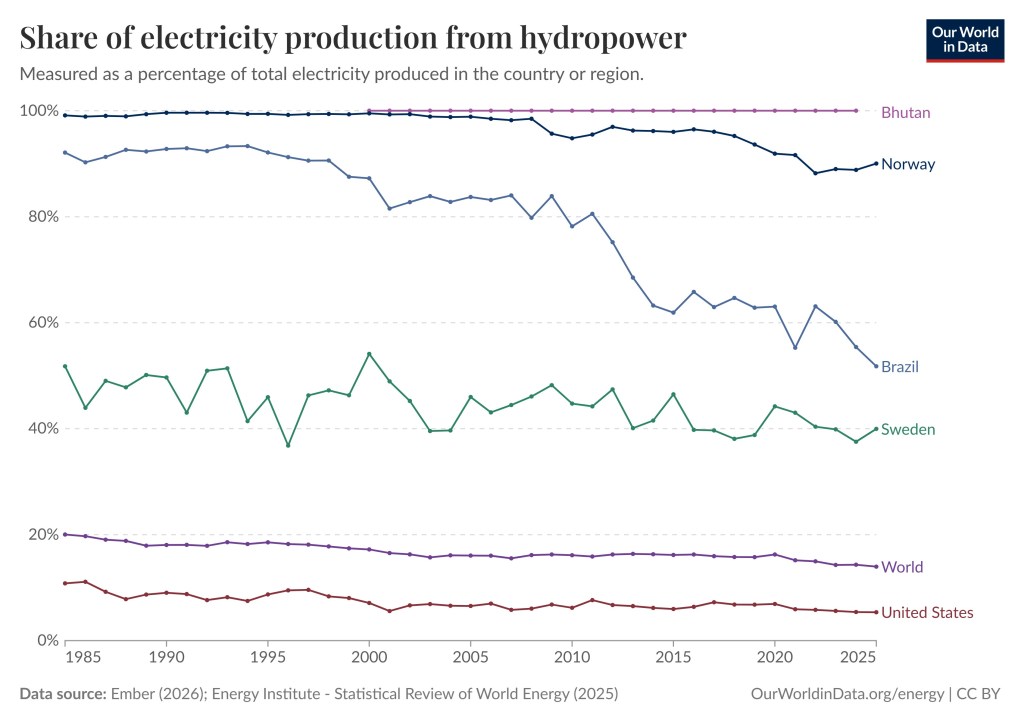
There is only one graph in the chart and that is for the share of electricity production from hydropower. It has slowly been going down from 1985 (20.02%) to 2025 (13.96%).
Share of electricity production from hydropower. Measured as a percentage of total electricity produced in the world. Data source: Ember (2026): Energy Institute – Statistical Review of World Energy (2025)    OurWorldinData.org/energy | CC BY
The chart shows six colored graphs going from 1985 to 2025. The graphs correspond to the world, Bhutan, Norway, Brazil, Sweden, and the United States. | The Unfolding Clean Energy Revolution
Share of electricity production from hydropower. Measured as a percentage of total electricity produced in the world and five countries (Bhutan, Norway, Brazil, Sweden, United States). Bhutan remains at 100% hydro, Norway went from 99.12% in 1985 to 90.03% in 2025, Brazil went from 92.10% hydro in 1985 to 51.78% in 2025, Sweden went from 51.76% hydro in 1985 to 39.97% in 2025, the United States went from 10.81% hydro in 1985 to 5.35% in 2025. The world went from 20.02% hydro in 1985 to 13.96% in 2025. Data source: Ember (2026): Energy Institute – Statistical Review of World Energy (2025)    OurWorldinData.org/energy | CC BY

The Share of Electricity Production from Nuclear

The share of electricity production in the world from nuclear went down from 15.06% in 1985 to 8.85% in 2025, which is a significant drop. During the same time the share of electricity production from nuclear in the United States went from 15.20% in 1985 to 17.36% in 2025, for China the numbers are 0% in 1985 to 4.61% in 2025, and for EU the share of electricity production in 1985 was 27.42% and in 2025 23.32%. However, in 1993% the share of electricity production in 1993 was 33.90%.

So, nuclear has taken a big step back in EU. Germany cancelled nuclear power entirely, for better and for worse. To interact with the graphs shown below or see other (millions) related charts or maps click here, or here.
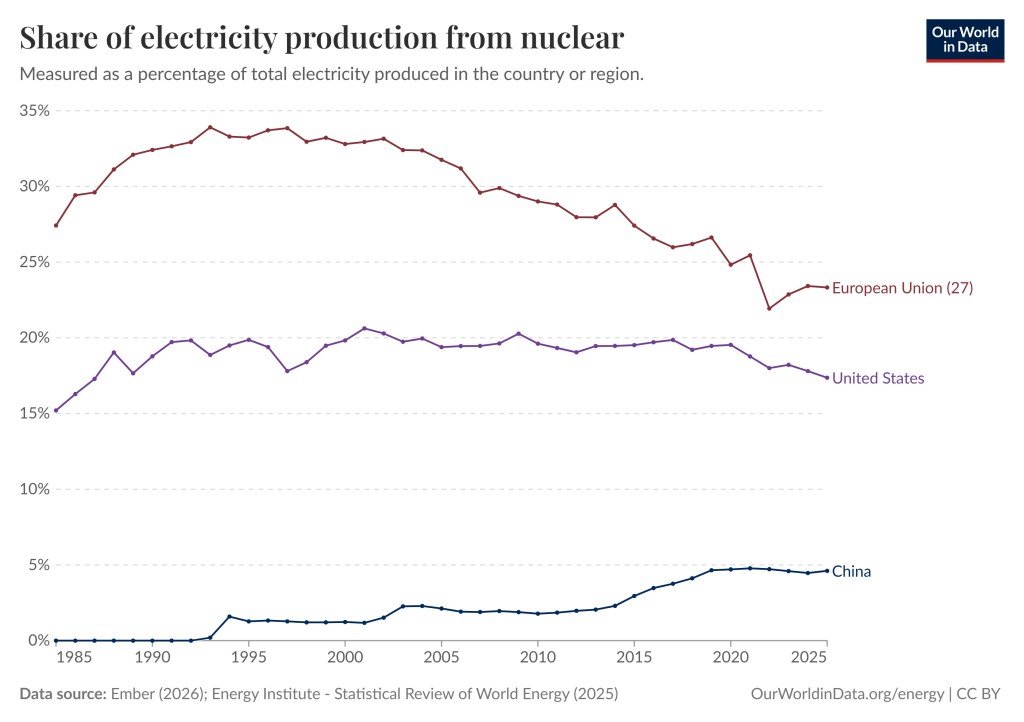
This chart features three graphs corresponding to the United States, EU, and China. The share of electricity production from nuclear has gone up in both the United States and China while the share has gone down in the EU after a record high in 1993.
Share of electricity production from nuclear. Measured as a percentage of total electricity produced in the world’s three largest economies, the United States, EU, and China. Data source: Ember (2026): Energy Institute – Statistical Review of World Energy (2025)    OurWorldinData.org/energy | CC BY

Geothermal a Promising source of Energy

Another reason to believe that the energy transition away from fossil fuels has begun, is that in addition to fossil fuels losing share of total electricity produced, there are promising emerging renewables, such as Geothermal energy. Geothermal energy uses natural heat from deep within the Earth to generate electricity or heat buildings. Wells tap into underground hot water/steam reservoirs, forcing it up to spin turbines that power generators, after which the water is cooled and reinjected to replenish the source (see the picture below).
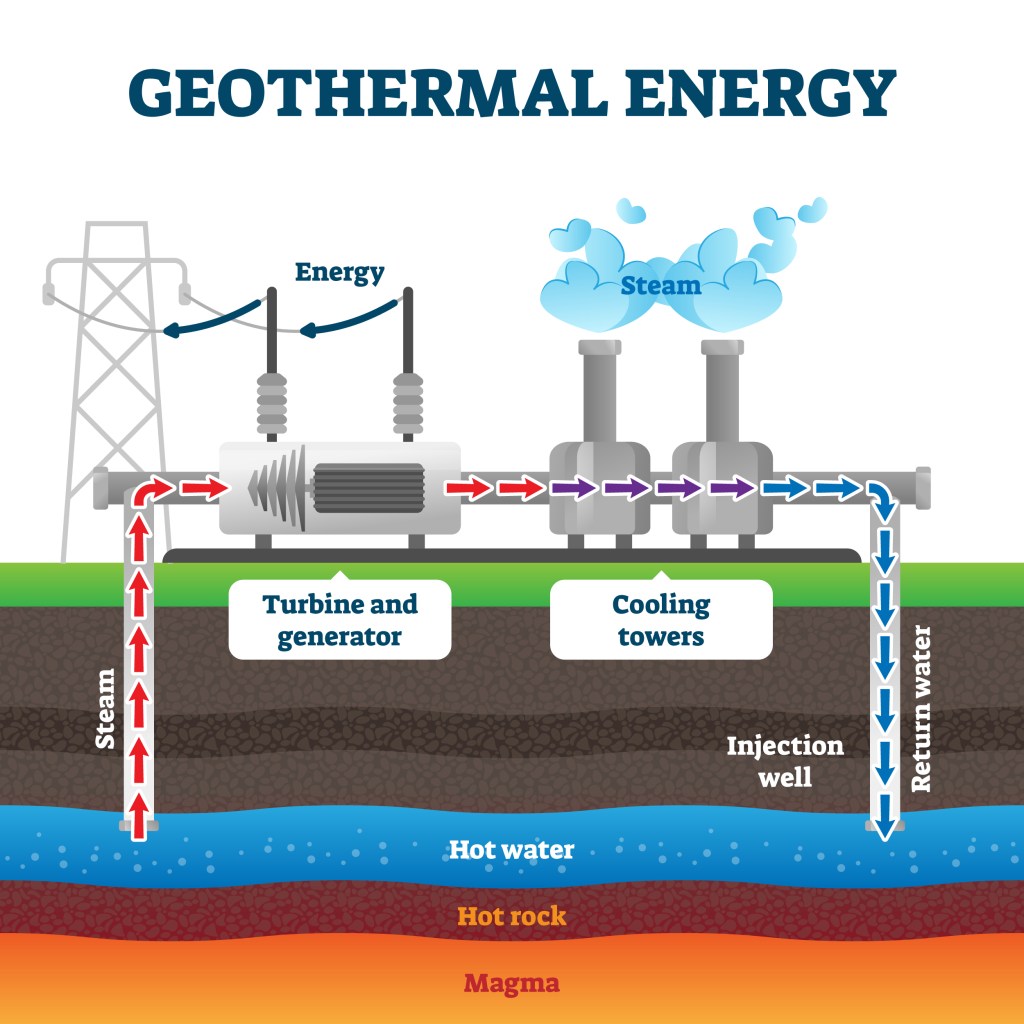
The illustration shows hot steam from hot water deep underground flowing up to earth’s surface and driving a turbine generating electricity. Then the steam is cooled and pushed back down into the ground.
Geothermal energy production example diagram illustration. Industrial renewable green energy plant example. Steam flow from the underground hot water to turbine generator and cooling towers. Shutterstock Asset id: 1637621995 by VectorMine.

Just like renewables geothermal energy is low emissions energy source but unlike renewables it is not an intermittent energy source. It is as of yet not widely used and not cost effective. However, it appears that might change soon. The advanced drilling techniques needed are utilizing oil and gas expertise and could therefore provide a good transition from fossil fuels to geothermal.
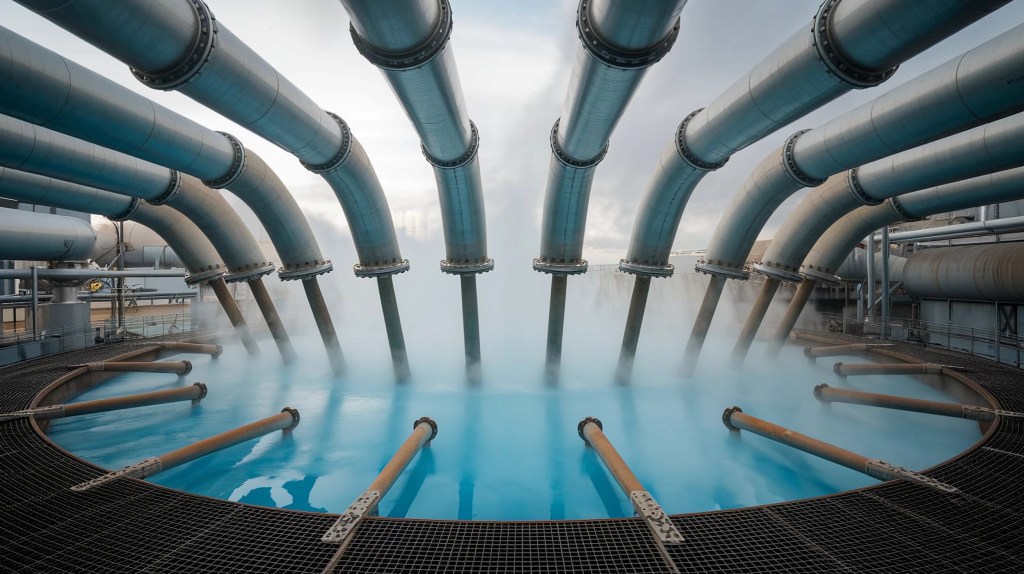
A geothermal plant. There are pipes going into a circular pool. | The Unfolding Clean Energy Revolution
Geothermal power plant from above Shutterstock Asset id: 2539157855 by Alrasyiqin

Is Fusion Power the Future ?

Fusion power is a clean, and near-limitless energy source generated by smashing light atomic nuclei together, usually hydrogen isotope, to form heavier ones. It is a form of nuclear power that releases immense heat. It replicates the process that powers the Sun. Unlike wind and solar it is not intermittent and can generate carbon-free baseload electricity without long-lived radioactive waste. However, it cannot yet be used to produce energy. That does not mean it will not work in the future.

The inside of a nuclear fusion plant. | The Unfolding Clean Energy Revolution
Nuclear fusion power generator concept image, 3d rendering Shutterstock asset id: 2262106105 by MeshCube.

Conclusion

The share of fossil fuels for electricity generation is decreasing despite the fact that the share from hydro and nuclear is also decreasing. The reason is the spectacular increase in the share provided by wind and solar. In addition, EV cars are rapidly replacing internal combustion cars around the world, especially in the EU and China. There are also renewable or clean energy sources that show great promise even though they are not yet widespread. This means that fossil fuels, coal, natural gas, and oil, which are all dirty and dangerous energy sources, are finally being replaced by cleaner alternatives.




To see the other Super Facts click here

10 Wind Blowing Facts About Birds

10

Esther’s writing prompt: February 4 : Flying

Click here or here  to join in.

This is not a super fact post but a post featuring ten wind blowing facts about birds. Let me rephrase that, ten mind blowing facts about birds. Sorry for flying that pun in your face.

My super facts are true based on reputable sources, despite being surprising or disputed. A super fact is also important and educational, unlike typical trivia. I consider the last seven bird facts below to be trivia and therefore not super facts. However, I hope my ten bird facts will at least raise some eyebrows and be somewhat educational. I have listed the ten facts below and if you want to learn more about them you can read the rest of the post.

  • There are flying Turkeys
  • Birds are Dinosaurs
  • Wind power saves a lot more birds than it kills
  • Birds don’t pee
  • Birds can use Earth’s magnetic field to navigate
  • Some birds sleep while flying
  • Birds have hollow bones, but they’re super strong
  • Some birds use tools
  • Swifts can stay airborne for 10 months
  • Chickens can recognize up to 100 faces
A shoebill stork is a large gray-blue bird with a huge beak. | 10 Wind Blowing Facts About Birds
A shoebill stork standing at Ueno Zoo, Tokyo, five feet tall. Bob Owen, CC BY 2.0 <https://creativecommons.org/licenses/by/2.0&gt;, via Wikimedia Commons

There are flying Turkeys

Domesticated Turkeys and Wild Turkeys are the same species, but Wild Turkeys can fly distances of more than a mile, sometimes at speeds of 55 miles per hour. I’ve seen it with my own eyes on turkey hunts. I’ve seen turkeys fly, flap their wings, take off and glide across the sky at the height of 30-50 feet. You can read more about it here and here. Below is a video showing wild Turkeys flying.

The photo shows a male turkey in the middle of flight. | 10 Wind Blowing Facts About Birds
Eastern Wild Turkey Meleagris gallopavo flying over the snow in Ottawa, Canada Stock Photo ID: 1358163995 by Jim Cumming.
My son is standing next to truck holding a dead turkey by the legs.
My son holding the wild turkey he shot.

Birds Are Dinosaurs

Birds are descendants of specialized maniraptoran theropod dinosaurs that survived the extinction event that killed most dinosaurs 66 million years ago. They evolved during the Jurassic period from two-legged, carnivorous, and often feathered dinosaurs, and are the only surviving lineage of this group. They have been classified as avian dinosaurs since the 1980’s. In other words, they are dinosaurs. Initially feathers evolved among dinosaurs for insulation, sexual display, and camouflage rather than flight.

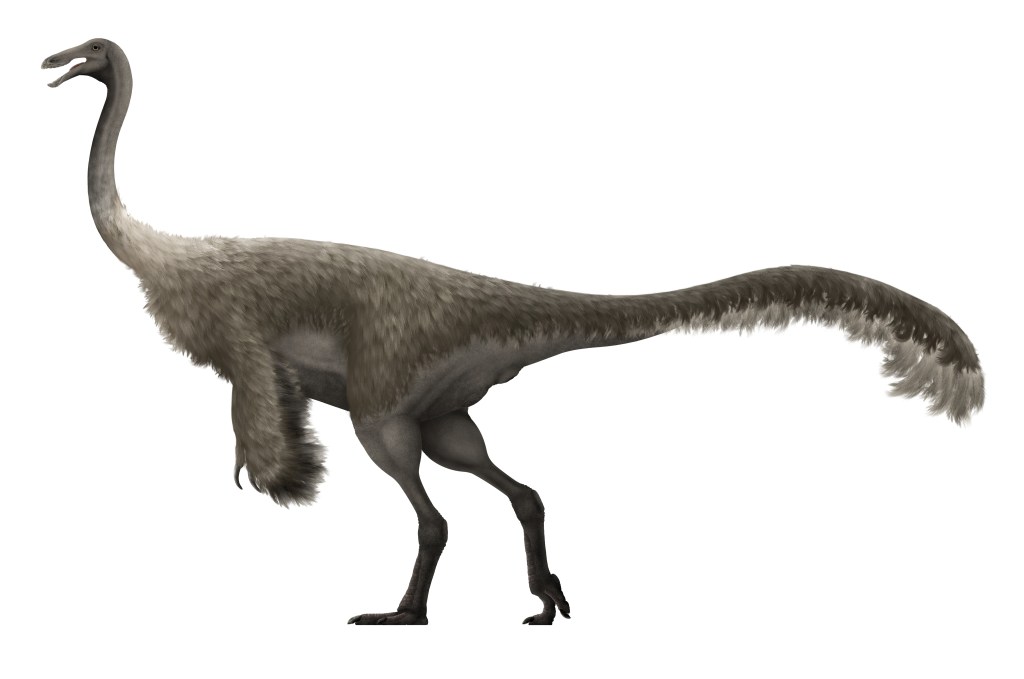
A lot of dinosaurs had feathers, and some could fly. Dinosaurs with feathers include, for example, Velociraptor (it might have been able to fly), Deinonychus, Archaeopteryx (could fly), Microraptor (could fly), Rahonavis (could fly), Gallimimus, Ornithomimus, Yutyrannus huali, Psittacosaurus, Psittacosaurus, Sinosauropteryx, Psittacosaurus,  Sciurumimus, Kulindadromeus, Caudipteryx, and even young T-Rex and many others. We know dinosaurs had feathers based on fossil finds.

A Gallimimus dinosaur covered in hair and feathers.
Life restoration showing an adult with feathers, based on those known from the related Ornithomimus. Picture is from Wikipedia. PaleoNeolitic, CC BY 4.0 https://creativecommons.org/licenses/by/4.0, via Wikimedia Commons

Remember the Velociraptors in the move Jurassic Park? In the movie they had scaly skin, but in reality, they had feathers. Also, the real velociraptors might have been able to fly. Wouldn’t that have made a better movie?

A colorful velociraptor covered in feather. It does not look like it could fly. | 10 Wind Blowing Facts About Birds
Velociraptor with feathers (well a little bit). Shutterstock Asset id: 2636534673 by Shutterstock AI Generator

Wind power saves a lot more birds than it kills

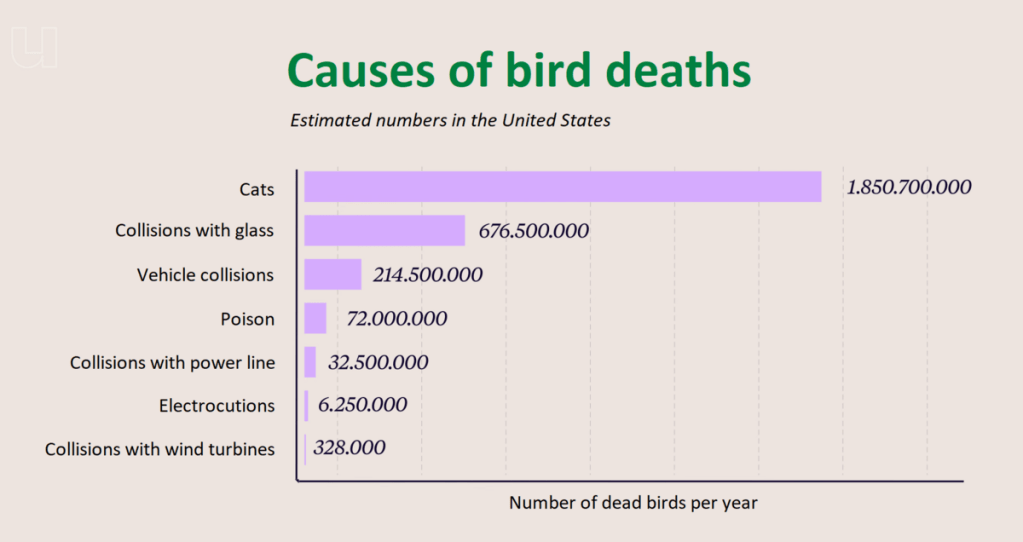
It may come as a surprise to some, but wind power is not a major cause of bird death. Wind farms are estimated to be responsible for losing less than 0.4 birds per gigawatt-hour (GWh) of electricity generated, compared to over 5 birds per GWh for fossil fueled power stations, see, for example this source. This means that replacing fossil fuels with wind power saves a lot more birds than wind power turbines take. In addition, cats, windows, cars, poison and powerlines are examples of things that kill a lot more birds than wind power does. Cats kill thousands of times more birds than wind power does, and this usually does not bother us. Note I love both dogs and cats.

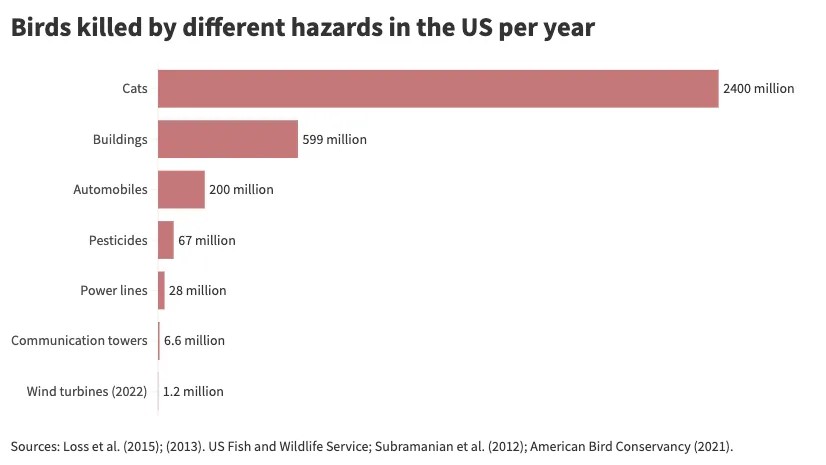
It is difficult to make exact estimates of bird deaths but below are some interesting graphs from reputable sources, confirmed by many other studies and analysis, such as this overview from MIT and this analysis by Hannah Richie. The numbers aren’t the same, but they make the same point. You can read more about this here.

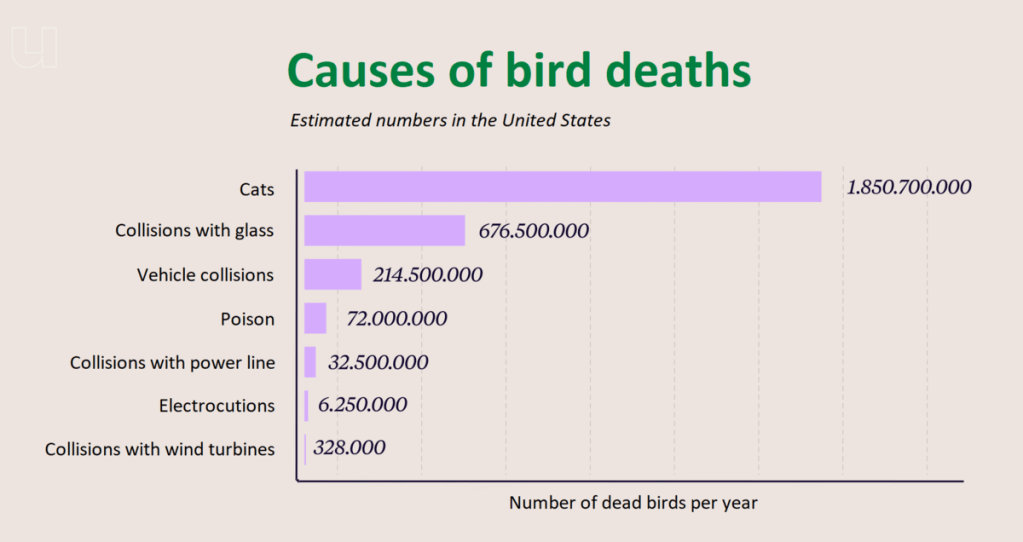
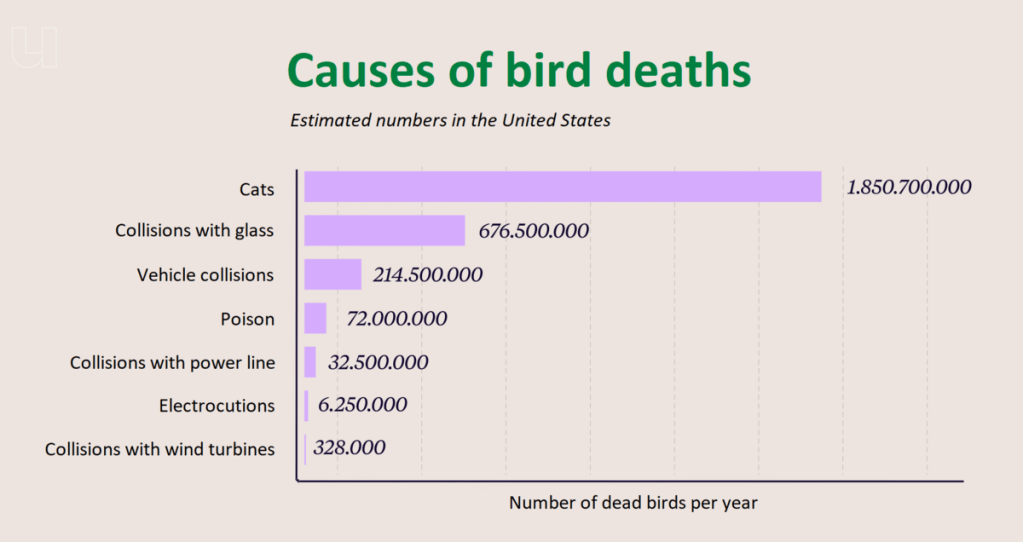
The graph shows that Wind Turbines kill 328,000 birds per year in the US, Electrocutions kill 6,250,000 birds, Collisions with powerlines kill 32,500,000 birds, Poison kills 72,000,000 birds, Vehicle collisions kill 214,500,000 birds, Collisions with glass kill 676,500,000 birds, and cats kill 1,850,700,000 birds per year in the US.
From Wikipedia: Universiteit van Nederland, CC BY 3.0 https://creativecommons.org/licenses/by/3.0, via Wikimedia Commons
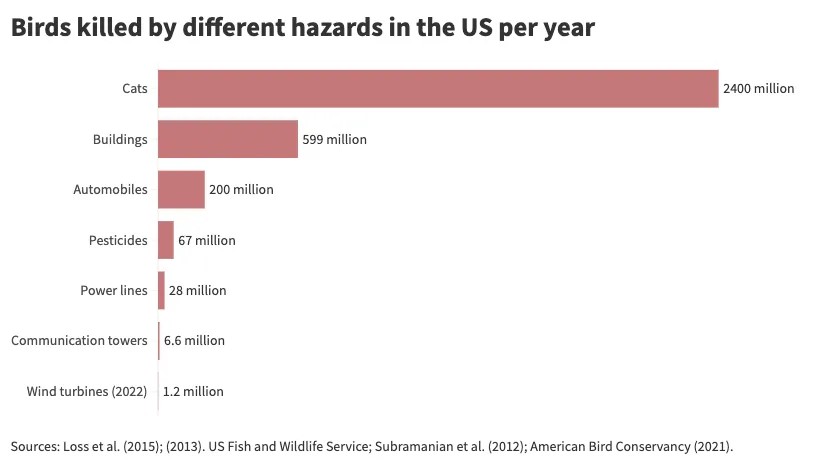
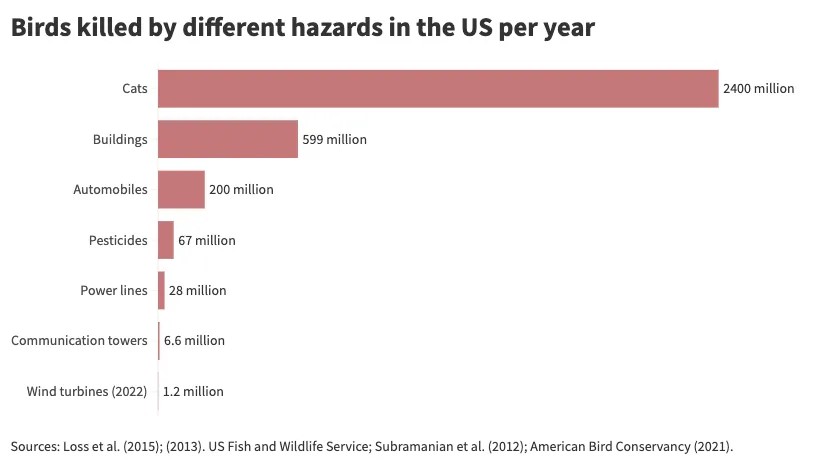
Bar graph showing cats killing an estimated 2,400 million birds per year, buildings killing an estimated 599 million birds per year, automobiles killing an estimated 200 million birds per year, pesticides killing an estimated 67 million birds per year, powerlines killing an estimated 28 million birds per year, communication towers killing an estimated 6.6 million birds per year, and wind turbines killing an estimated 1.2 million birds per year. | 10 Wind Blowing Facts About Birds
An alternative graph taken from Hannah Richie / Our World in Data, using alternative sources essentially showing the same thing. Sources: Loss et al. (2015), (2013), US Fish and Wildlife Service; Subramnayan et al. (2012), American Bird Conservancy (2021).

That does not mean we shouldn’t do our best to reduce bird deaths from wind power stations. However, don’t fall for the misinformation that is trying to paint it is a big problem specifically for wind power. It is good to keep in mind that there are powerful organizations, politicians and individuals who are intentionally spreading a lot of misinformation about wind power and other renewables in an effort discredit them. One example is the series Landman which repeatedly makes demonstrably false and pretty wild claims. Landman is fiction, of course, but it is presented so it appears to be facts to unsuspecting viewers.

Birds don’t pee

Birds don’t pee liquid like mammals. They excrete waste as a white, pasty uric acid mixed with solid feces through a single opening. This means that they excrete only one type of droppings. This conserves water and keeps them lightweight for flight.

Birds can use Earth’s magnetic field to navigate

Migratory birds navigate long distances by using Earth’s magnetic field, which acts like a built-in GPS-like compass to determine direction and position. They have light-sensitive proteins called cryptochromes in their eyes, which enable them to see magnetic fields, and they can detect field intensity using magnetic crystals (magnetite) in their beaks or inner-ear cells. This enables them to know direction, inclination and position. The detection of the magnetic field is very fine and is believed to involve quantum mechanical mechanisms. You can read more about how migrating birds use quantum effects to navigate here

Birds flying in an arrow formation in a sky with clouds and fuzzy sun.
Silhouette of birds flying in arrow formation at sunset sky. Shutterstock Asset id: 717932599 by Vaclav Volrab

Some birds sleep while flying

Many birds, especially long-distance migrants like Albatrosses, swifts and frigatebirds, sleep while flying by using one half of the brain at a time. They usually sleep while ascending at higher altitudes and just for one hour.

Tweety bird flying with eyes closed | 10 Wind Blowing Facts About Birds
A sleeping bird flying. Picture generated with the help of ChatGPT.

Birds have hollow bones—but they’re super strong

Birds have hollow bones. They are not necessarily lighter but they’re super strong. The structure is denser and reinforced with internal struts, kind of like aerospace engineering. The bones are full of spaces for air giving them a more efficient respiratory system and allowing them to take in oxygen while both inhaling and exhaling.

Some birds use tools

New Caledonian crows craft hooks from sticks to fish insects out of holes. They carve, nibble and peel the tip of the stick until it has a hook. Striated Herons drop larvae, worms, and insects on the water to attract prey. They sometimes break sticks into pieces to use as artificial bait to attract fish. Rooks, corvid bird, drop rocks into water to raise the water level so that they can reach prey. Carrion crows use traffic to crack hard-shelled nuts.

For example, they drop walnuts on busy roads, often at pedestrian crossings, and wait for cars to crush them, then retrieving the food during red lights. Egyptian Vultures pick up stones in their beaks and throw them at large, hard-shelled eggs to break them. There are many other examples.

Swifts can stay airborne for 10 months

Common swifts can stay airborne for up to 10 months without landing during their non-breeding migration. They eat, drink, sleep, and even mate while in flight, only landing to nest for two months in the summer.

A swift flying on a blue background. Photo taken from below. | 10 Wind Blowing Facts About Birds
White-rumped swift, Apus caffer, at Suikerbosrand Nature Reserve, Gauteng, South Africa. Derek Keats from Johannesburg, South Africa, CC BY 2.0 https://creativecommons.org/licenses/by/2.0, via Wikimedia Commons.

Chickens can recognize up to 100 faces

Chickens don’t just recognize other chickens; they also recognize human faces. Chickens remember positive or negative experiences with the faces they recognize and pass that information on to members of their flocks. Let’s think about that while we chew on our chicken nuggets.


My Other Responses to Esther’s Prompts


To see the Super Facts click here

Landman Lies

Super fact 77 : The TV series Landman portrays several falsehoods about clean energy. Since these claims are mostly unchallenged, appear to be information, and are also very easy to look up and debunk, they are deliberate lies.

“Lies” may be a strong word but if you make a very one sided presentation and you don’t fact check your claims even though that would take less than 30 seconds to do, especially since you are a large company with lots of resources, then you are clearly intentionally deceiving your audience, which is lying. I consider the claim above (in bold) a super fact because it is true, and it is important because it is a popular series and based on the reaction the Landman series has deceived a lot of people.

I got the idea for this super fact yesterday as we were watching a few episodes of Landman. Since I know a little bit about this topic the misinformation was obvious to me. The Landman series is fiction but the way the information was presented made it appear as facts. It appeared as if it was trying to teach us something rather than being the delusional rants of an oilman.

In addition, the misinformation is not minor. It consists of big bold whoppers. Imagine a movie promoting us taking Greenland from Denmark claiming that the Danes attacked Pearl Harbor, acquired a nuclear bomb, and used chemical weapons on Los Angeles. Whatever your opinion on the Greenland situation is, these big whoppers would likely make it harder for you to watch the movie, at least if you know some history. If most people’s knowledge of history was so bad that they’d believe it, then it would also create problems. There is a lot of confusion and misinformation regarding clean energy, and it is a poorly understood topic, so telling big lies does damage.

Photo of a row of wind turbines. | Landman Lies
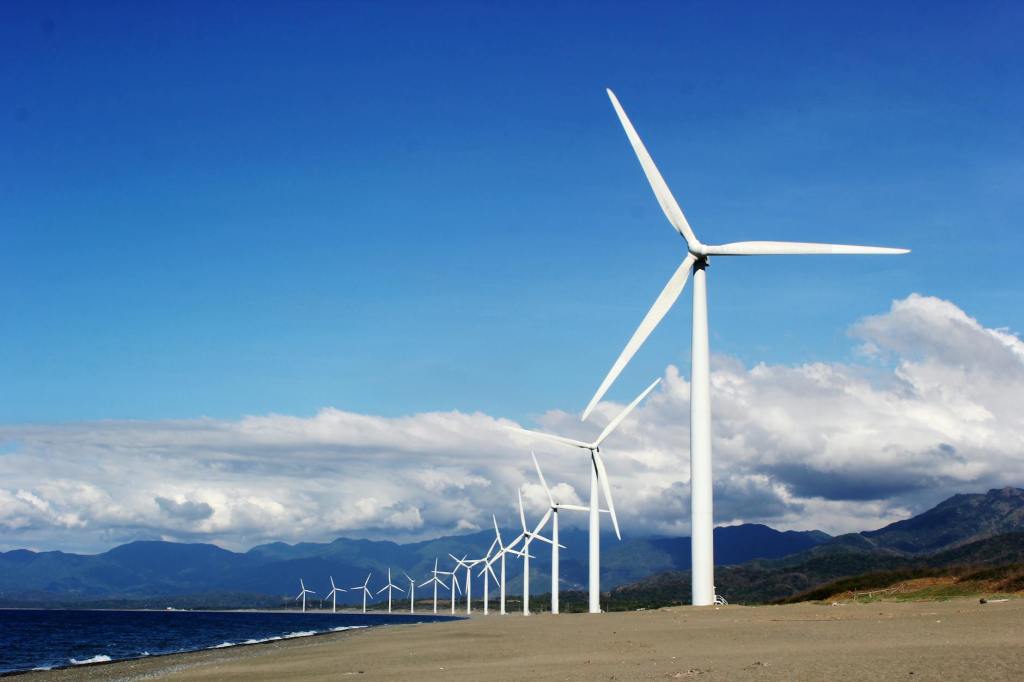
Wind turbines from pexels.com

It may come as a surprise to many that Paramount plus would deliberately mislead their audience. However, clean energy, climate science, evolution, vaccines, and any science that is inconvenient to some people have been undermined by false information for quite a while. It is just more of it than usual right now. That the executive branch is at war with clean energy might have something to do with it.

Misleading information about clean energy is often spread on social media via fake memes, non-reputable sources, comments by people who do not know what they are talking about, conspiracy theories, small groups of contrarian agenda driven scientists making youTube videos with false information, bots, deep fakes, etc., but now it has also shown up in a major Hollywood Production.

It is more important than ever to be skeptical of claims you hear, especially if they seem to support your own political, ideological, religious, or philosophical views, because that’s how you get bamboozled. Questioning other people’s views does not require much effort. I speak from experience. Intentionally seek the truth not confirmation of your belief. Verify all claims before you take them seriously. Be a realist.

Truth: Windpower and Solar are Much Cleaner than Fossil Fuels

The false claim in the series is that “there is nothing clean about clean energy, that renewables require too much fossil fuel to build to be considered clean.” I am using the true statement as the title of this section because our memories often mix up the false and true statements as time goes by, so highlighting the true statement helps.

Manufacturing, transporting, and building infrastructure for wind power currently involve fossil fuels and so do fossil fuel plants. However, this is only an initial stage. Once wind and solar facilities are built, they generate power without direct emissions, unlike fossil fuel plants which continue to burn fuel and emit CO2 during their entire operational lives. For example, the lifetime emissions of gas-powered generation are estimated to be around 20 to 40 times higher than those of renewables. You can read more here or here.

This is a 3 minute video

Truth: Wind turbines typically offset their carbon footprint within a year

The demonstrably false claim is that “wind turbines do not offset their carbon footprint within their lifespan.” According to energy researchers, for example, the National Renewable Energy Laboratory, a wind turbine typically offsets the carbon emissions from its manufacturing, transport, and installation within six months to one year of operation. In other words, wind turbines offset their carbon footprint quickly. The average lifespan of a wind turbine is over 25 years.

Truth: Solar and Wind Are Cheaper than Gas, Coal and Nuclear

The false claim in Landman is that “solar and wind energy are significantly more expensive than natural gas.” While wind and solar can have higher upfront installation costs, their operational costs are very low as they do not require fuel. Therefore, they can provide electricity very cheaply, making them competitive with and often cheaper than natural gas over their full lifespan.

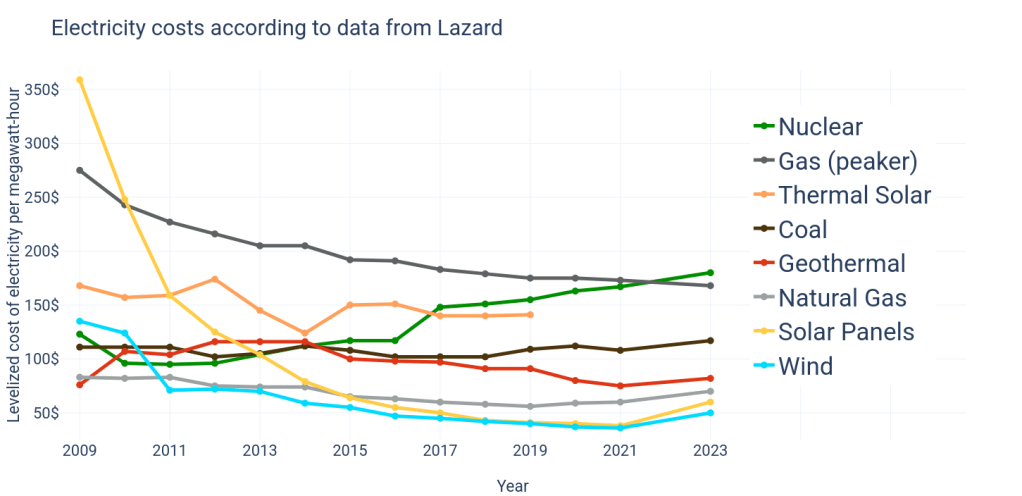
However, all energy sources are subsidized, and fossil fuels have a long history of government subsidies. Below is the average unsubsidized levelized cost of energy in the United States according to Lazard. Levelized means that construction costs, land rent, and other costs not directly caused by electricity generation are taken into consideration. Notice how cheap wind is (blue line). This is for the United States not just Texas. I don’t have any numbers, but I’ve heard that for Texas solar is the cheapest .

The image shows 8 graphs representing the price of Nuclear, Gas (peaker), Thermal Solar, Coal, Geothermal, Natural Gas, Solar Panels, and Wind. Today Wind is the cheapest.
Average unsubsidized levelized cost of energy. Notice that the light blue line indicates that wind power is pretty cheap. Mir-445511, CC BY-SA 4.0 <https://creativecommons.org/licenses/by-sa/4.0&gt;, via Wikimedia Commons.

The free market based Texas (my state) grid ERCOT provides an excellent example of how wind and solar effectively compete with other energy sources. ERCOT provides a minute by minute update for the fuel mix percentages. This is a fun website.

Truth: Fossil Fuels are Worse for the Environment than lithium batteries and solar panels

The false claim in Landman is that “Lithium batteries and solar panels are worse for the environment than fossil fuels.” Solar panels typically offset the emissions from their production and installation within 1 to 4 years. Battery technology is continuously improving, and current systems are highly recyclable (90-95%). While the mining of materials like lithium has environmental impacts, the overall lifetime emissions of renewables and associated storage systems are vastly lower than those of fossil fuels.

Truth: Fossil fuels kill a lot more birds than Wind Power per Giga Watt

Tommy Norris (played by Billy Bob Thornton) implies in a rant that “Wind turbines are a major ecological disaster for birds, disrupting patterns and causing mass deaths.” While wind turbines kill some birds it is minor compared to the impacts of the oil and gas industry or other common human activities. This study estimates that wind farms and nuclear power stations are responsible each for between 0.3 and 0.4 fatalities per gigawatt-hour (GWh) of electricity while fossil-fueled power stations are responsible for about 5.2 fatalities per GWh. These articles from MIT provide additional information and reiterate that fossil fuels are lot more deadly to birds than wind power stations. You can read more on this topic here, here, here or here.

The graph shows that Wind Turbines kill 328,000 birds per year in the US, Electrocutions kill 6,250,000 birds, Collisions with powerlines kill 32,500,000 birds, Poison kills 72,000,000 birds, Vehicle collisions kill 214,500,000 birds, Collisions with glass kill 676,500,000 birds, and cats kill 1,850,700,000 birds per year in the US. | Landman Lies
From Wikipedia: Universiteit van Nederland, CC BY 3.0 <https://creativecommons.org/licenses/by/3.0&gt;, via Wikimedia Commons
Bar graph showing cats killing an estimated 2,400 million birds per year, buildings killing an estimated 599 million birds per year, automobiles killing an estimated 200 million birds per year, pesticides killing an estimated 67 million birds per year, powerlines killing an estimated 28 million birds per year, communication towers killing an estimated 6.6 million birds per year, and wind turbines killing an estimated 1.2 million birds per year.
An alternative graph taken from Hannah Richie / Our World in Data, using alternative sources essentially showing the same thing. Sources: Loss et al. (2015), (2013), US Fish and Wildlife Service; Subramnayan et al. (2012), American Bird Conservancy (2021).

Truth: There is no evidence that Offshore Wind Kills Whales

The false claim in Landman is that “offshore wind development, including site characterization surveys, is responsible for a spike in whale deaths”. The primary cause of human-caused threats to large whales are vessel strikes and entanglement in fishing gear but not offshore wind. According to NOAA there are no known links between large whale deaths and ongoing offshore wind activities. You can read more on this topic here, here, or here.


To see the other Super Facts click here

ERCOT Fuel Mix

This is not a super fact but just interesting information about ERCOT. ERCOT or the Electric Reliability Council of Texas is the organization that manages the state’s electricity grid, ensuring reliability and it operates the competitive wholesale electricity market for 90% of Texas’s electric load. There are a few things that are important to remember about ERCOT.

  • The ERCOT grid is located solely within the state of Texas and is not interconnected to the rest of the United States. In addition to Texans being independent, this is a way of avoiding federal regulation. ERCOT is regulated by the Texas Public Utility Commission while the rest of the country is regulated by the Federal Energy Regulatory Commission (FERC).
  • ERCOT is an ISO (independent system operator), meaning it’s a non-profit organization that manages the electricity grid independently of any single utility company.
  • When companies sell their energy (to ERCOT) it works like a continuous auction. The one with the lowest price is picked first and allowed to contribute with whatever they are able to and also, of course, considering what the grid-powerlines can carry safely.
A power grid. The sun is setting in the background | ERCOT Fuel Mix
The power grid carries the power and if not sufficient it can be a major bottle neck. Photo by Pixabay on Pexels.com

Renewables are successful in Texas

One thing that surprises many people is that renewable energy, for example, wind and solar, is quite successful in Texas. Fossil fuels is important in Texas, and there are many powerful oil and gas billionaires in Texas who fight the expansion of renewables. Texas politicians work hard to create laws that punish renewables with discriminatory permitting requirements.

For example, a recent bill in the Texas Senate SB819 adds a lot of requirements on renewables and battery storage that does not apply to fossil fuel-based energy sources. An example is the requirement in SB819 that wind turbines must be at least half a mile away from the property line of any neighboring property whilst, for example, oil rigs can be built up to the property line. There are a lot more regulations in SB819 that are discriminatory, contrary to free market principes, and even violations of private property rights.

Despite all the obstacles set up against renewable energy in Texas renewable energy is on the march in Texas. The reason is that ERCOT is ultimately a price competitive free market-based system and renewables are cheap. Solar and wind are the cheapest even considering subsidies and the cost of construction, land rent, disposal, and other costs not directly caused by electricity generation are taken into consideration disposal. Click here for details. The graph below shows the evolution of different energy sources in Texas. The graph is taken from this link provided by Dr. Joshua Rhodes, a research scientist at UT Austin.

The graph shows the average annual mix for natural gas, coal, wind, nuclear, solar, and other sources. Natural has roughly remained around 40-50%, coal has shrunk from 37% to 13%, wind has grown from 2% to 24%, nuclear has shrunk from 14% to 8%, and solar has grown from nothing to 10% over the last five years | ERCOT Fuel Mix
The ERCOT fuel mix from 2006 to 2024. Notice the expansion of wind power and notice that solar has gone from nothing to 10% of the average fuel mix in five years. The graph is taken from this link.

You can read more about the evolution of renewable energy in Texas by clicking here.

Watching the ERCOT Fuel Mix in Real Time

Finally, what I think is the most interesting portion of this post, the real-time ERCOT Fuel Mix. It includes a couple of energy sources not mentioned earlier in this post, hydro and power storage.

Hydro is very small in Texas and power storage is a new item that is not a true energy source but a feature that can be called upon when energy is suddenly needed somewhere. It is still not widely used but it reached 10% of the mix at one point in 2024. It is likely an energy source that will keep growing as it is instant and scalable. It is the most dispatchable energy source of all. I can add that there is a lot of misinformation spread about renewable energy, especially about wind power. To read more about that click here.

Last evening and today I took several screen shots of the real time ERCOT fuel mix (see below). A couple of things to note are that solar does not contribute at night and wind contributes more at night. It was a very cloudy and rainy day today so solar contributed less than normal during daytime, but not a lot less. It is not much less than the typical sunny day of 20%. It is true that wind and solar are intermittent, but it does not matter a whole lot because wind contributes more at night when solar does not contribute and battery storage, the most dispatchable energy source of all, is growing in importance.

Click here to watch the real-time ERCOT Fuel Mix minute by minute anytime you like. (highly recommended).

Wind is 40.5%, Natural Gas 38.8%, Power Storage 2.5% | ERCOT Fuel Mix
Fuel Mix on April 3rd 2025 at 8:00PM
Wind is 38.4%, Natural Gas 40.3%, Power Storage 0.7%
Fuel Mix on April 3rd 2025 at 10:00PM
Wind is 41.9%, Natural Gas 34.2%, Power Storage 0.4%
Fuel Mix on April 4th 2025, at 1:15AM
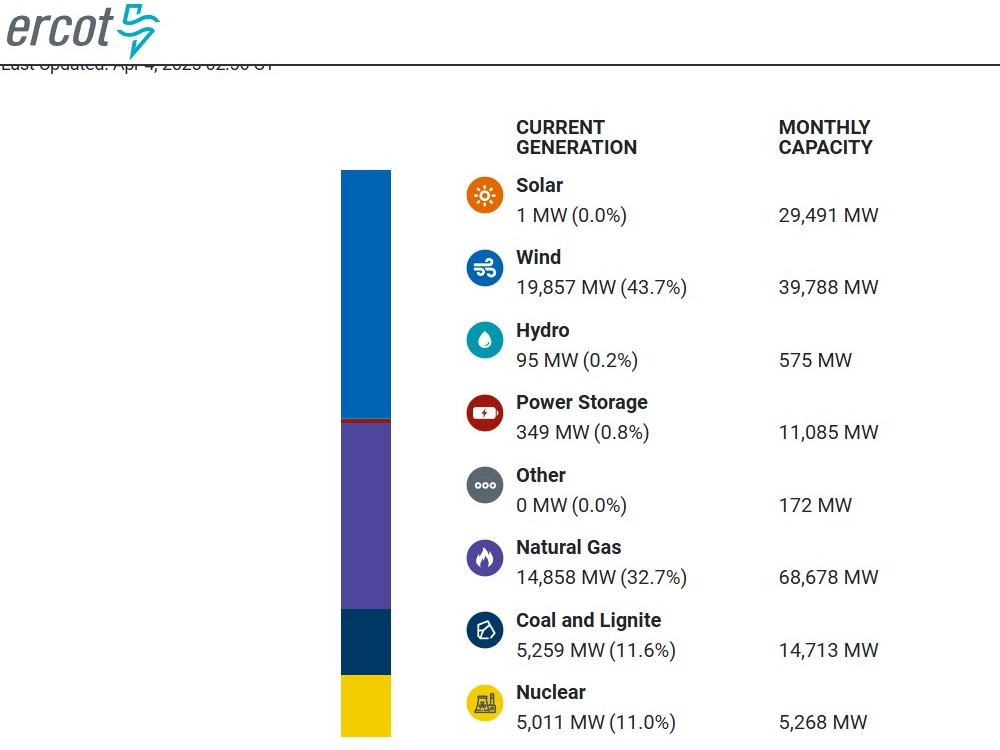
Wind is 43.7%, Natural Gas 32.7%, Power Storage 0.8% | ERCOT Fuel Mix
Fuel Mix on April 4th 2025, at 3:00AM
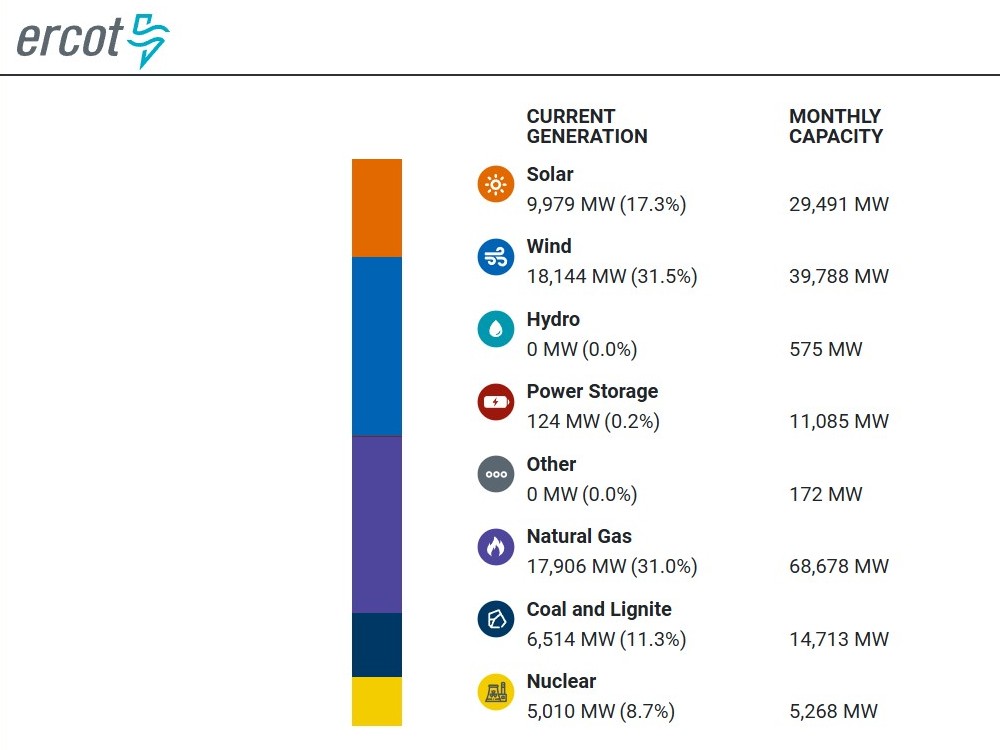
Wind is 31.5%, Natural Gas 31.0%, Power Storage 0.2%
Fuel Mix on April 4th 2025, at 12:35PM
Wind is 31.7%, Natural Gas 31.2%, Power Storage 0.2%
Fuel Mix on April 4th 2025, at 2:00PM
Wind is 32.7%, Natural Gas 34.3%, Power Storage 1.1%
Fuel Mix on April 4th 2025, at 4:00PM
Wind is 32.6%, Natural Gas 36.8%, Power Storage 0.8% | ERCOT Fuel Mix
Fuel Mix on April 4th 2025, at 5:30PM
Wind is 41.1%, Natural Gas 37.4%, Power Storage 0.2% | ERCOT Fuel Mix
Fuel Mix on April 4th 2025, at 9:30PM
Wind is 49.9%, Natural Gas 29.0%, Power Storage 0.0% | ERCOT Fuel Mix
Fuel Mix on April 4th 2025, at midnight
To see the Super Facts click here

Wind power is not a major cause of bird death

Superfact 17: Fossil fuels kill a lot more birds per gigawatt hour than wind power does. Cats, windows, cars, poison and powerlines are examples of things that kill a lot more birds than wind power does. Wind power killing birds is not the huge environmental problem it is often made out to be.

Wind power killing birds is often mentioned as a slam dunk environmentally based argument against wind power and evidence for the hypocrisy of environmentalists. This is misguided. Wind power killing birds is a real problem and it should be addressed, and it is being addressed. No energy source comes without environmental problems. However, wind turbines account for only a small fraction of overall bird deaths compared to other human causes. It is not a good argument against wind power, and it does not demonstrate any hypocrisy by environmentalists. In fact, a study made in 2012 (overview here) concluded that fossil fuels killed 24 million birds per year in the US, which correspond to 35 times more birds per GWh than wind power kills according to this study. Even though this study and other similar studies are estimates based on assumptions that are far from perfect, they are good indicators that replacing fossil fuels with wind power likely saves birds rather than kills them.

Photo by Pixabay on Pexels.com

In any case, as this Wikipedia article states, collisions with wind turbines are a minor source of bird mortality compared to other human causes. According to the graph below cats kill 5,600 times more birds than wind power and collisions with powerlines kills 99 times more birds than wind power, and yet we rarely discuss these problems. Even though these numbers are estimates they are mostly confirmed by other studies and analysis, as this overview from MIT and this analysis by Hannah Richie shows. The numbers aren’t the same, but they make the same point. FYI Hannah Richie is the deputy editor and lead researcher at Our World in Data. Our World in Data is a scientific online publication that focuses on large global problems. They are associated with Oxford University and is one of the most respected statistics, analysis and research organizations in the world.

The graph shows that Wind Turbines kill 328,000 birds per year in the US, Electrocutions kill 6,250,000 birds, Collisions with powerlines kill 32,500,000 birds, Poison kills 72,000,000 birds, Vehicle collisions kill 214,500,000 birds, Collisions with glass kill 676,500,000 birds, and cats kill 1,850,700,000 birds per year in the US.
From Wikipedia: Universiteit van Nederland, CC BY 3.0 <https://creativecommons.org/licenses/by/3.0&gt;, via Wikimedia Commons
Bar graph showing cats killing an estimated 2,400 million birds per year, buildings killing an estimated 599 million birds per year, automobiles killing an estimated 200 million birds per year, pesticides killing an estimated 67 million birds per year, powerlines killing an estimated 28 million birds per year, communication towers killing an estimated 6.6 million birds per year, and wind turbines killing an estimated 1.2 million birds per year.
An alternative graph taken from Hannah Richie / Our World in Data, using alternative sources essentially showing the same thing. Sources: Loss et al. (2015), (2013), US Fish and Wildlife Service; Subramnayan et al. (2012), American Bird Conservancy (2021).

Wind power has been on the receiving end of false claims, nonsense, and strange rumors for quite some time. It is not the only energy source maligned by false information, but it is an interesting case study in misinformation regarding energy sources. To read about nonsense and rumors about wind power click here.

Photo by Athena Sandrini on Pexels.com


To see the other Super Facts click here