I started this blog, superfactful, in August of 2024. The goal of my blog is to create a list of facts that are important, not trivia, and that are known to be true yet surprising, shocking or disputed by large segments of the public. I determine what is true by evaluating the evidence I find in reliable reputable sources and if a longstanding scientific consensus is available that certainly helps. In some cases, I have expertise in the subject myself, which also helps. Whether a fact is important and surprising or disputed is a judgment call. In some cases, there are polls to help me determine how surprising or disputed the fact is. I am trying to avoid trivia and click bait, and I am only focusing on what is true, important and mindboggling.
It is a project I hope to learn a lot from, and I hope others will also learn something from reading it. We are all drowning in misinformation, false beliefs and unsubstantiated assumptions. We often know and understand less than we think. I have been bamboozled in the past and I am pretty sure you have too. If this blog can spread a little bit of light, I am happy.
In 2024 I posted 25 super facts and in 2025 I posted 53. I am hoping to one day to have collected 200 super facts. I have also made 64 other kinds of posts on this blog such as book reviews for educational books as well as other fact related posts. Below are ten selected super facts from 2025. To read the full post click the links.
That Earth is round was well known long before Columbus
Super fact 28: That Earth is round, or spherical (or closely spherical) had been known for at least a couple of thousand years by the time Columbus set sail. Columbus did not set sail to prove that earth was round, and he knew it was round.
I’ve realized that this comes as a surprise to some. To read the post click here.

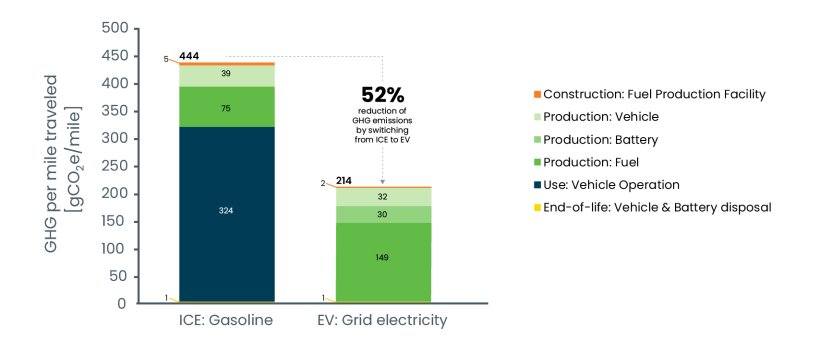
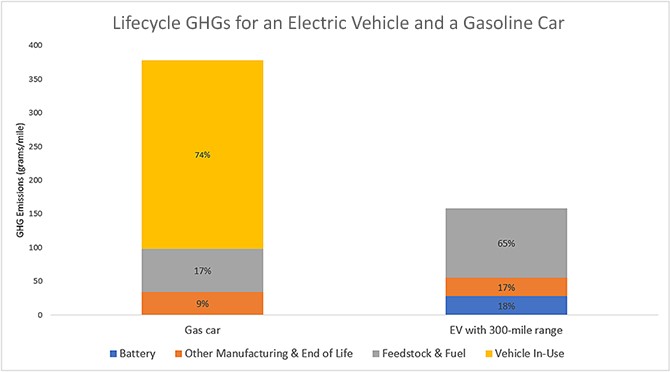
EV Cars Indeed Emit Less Carbon Pollution
Super fact 29: EV Cars emit less pollution than Internal Combustion Engine, even considering manufacturing, disposal and EV Cars being charged by dirty grids.
There is a lot of misinformation about EVs including that EVs are not better for the environment. To read the post click here.
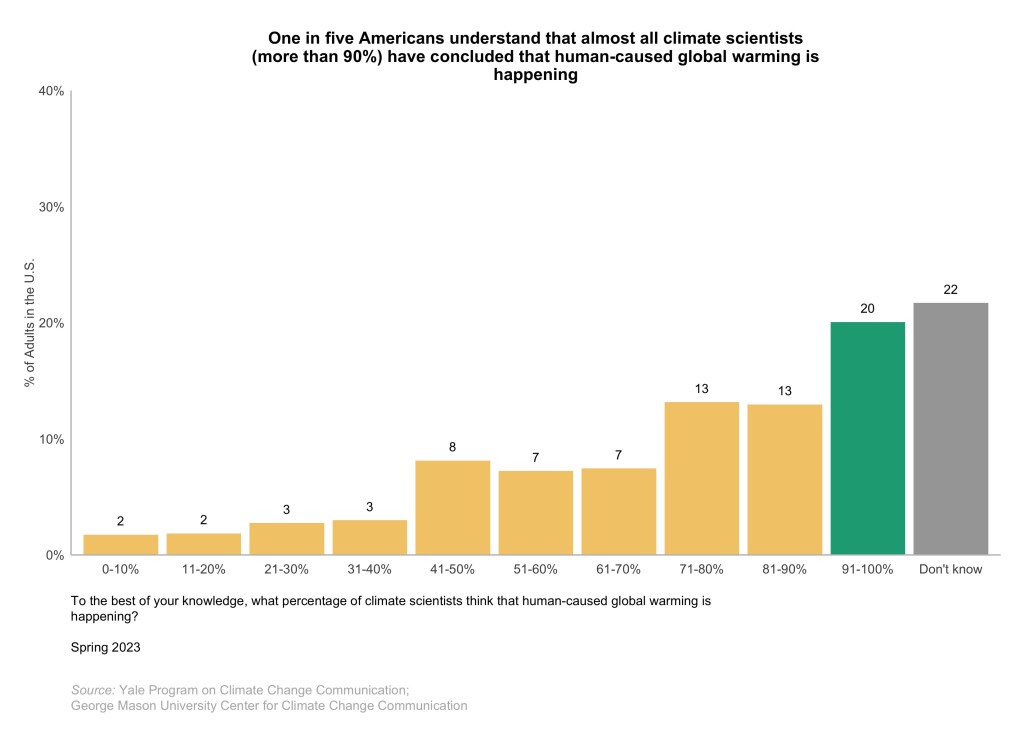
Scientists Agree that Global Warming is happening and that we are the Cause
Super fact 34: Climate Scientists agree that Global Warming or if you call it Climate Change is happening, and that it is caused by us primarily because of our burning of fossil fuels. There is a long-standing scientific consensus on these two facts because the evidence is conclusive. Typically, studies show an agreement of at least 97% or 98% among climate scientists.
Polls show that most American are unaware of the consensus among climate scientists. To read the post click here.
There is almost total agreement among climate scientists that global warming, or climate change, is happening and is caused by us. To understand why, you need to know a little bit about the impressive evidence, which for all practical purposes is conclusive. Take a look at this post “Global Warming is Happening and is Caused by us”
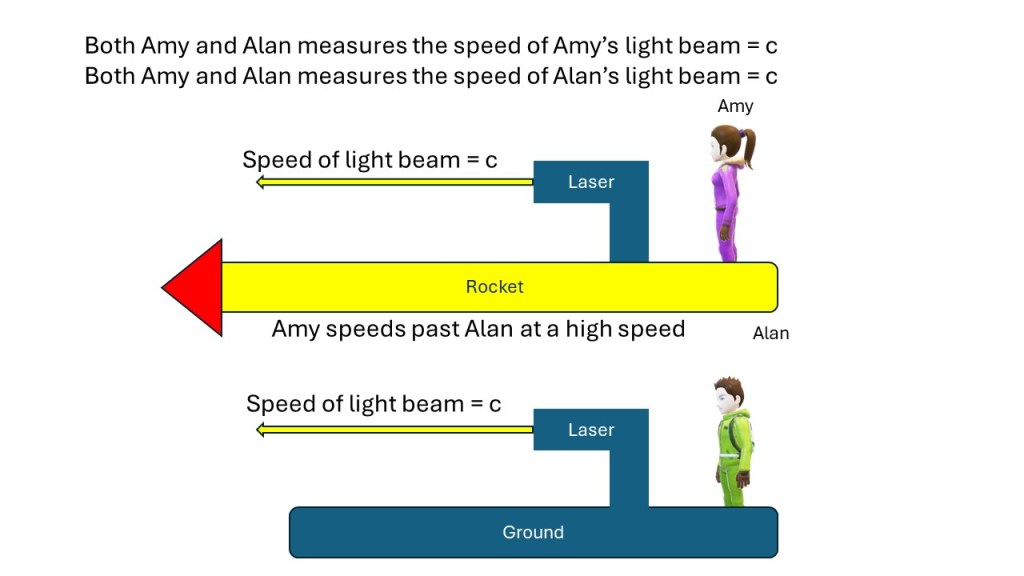
Time Dilation Goes Both Ways
Super fact 38 : If two observers are moving compared to each other both will observe the other’s time as being slower. In other words, both observers will observe the other’s clocks as ticking slower. Time slowing down is referred to as Time Dilation.
Clocks slow down as you travel at high speeds. However, the person travelling think they are standing still. It is the other person who is travelling. This is confusing. To understand it click here.
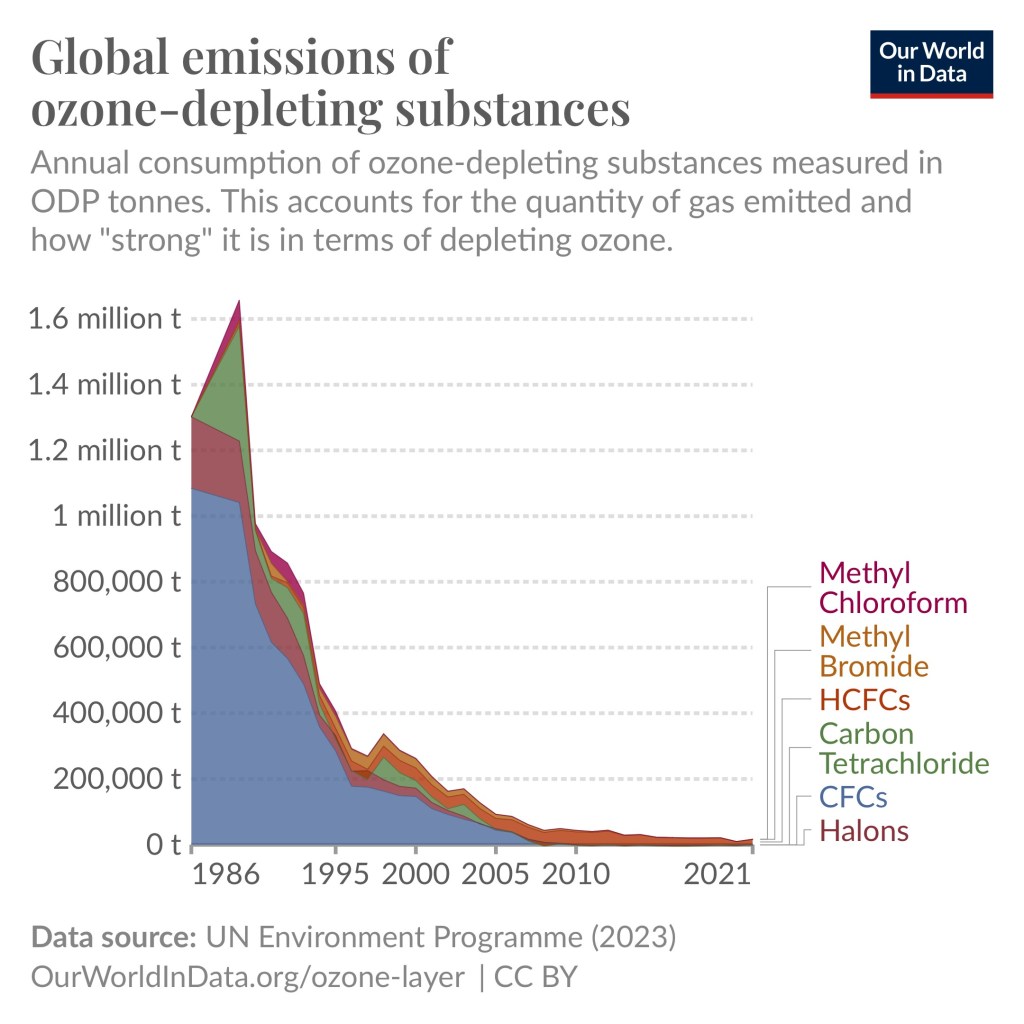
Emissions of ozone-depleting gases have fallen by 99 Percent
Super fact 41 : Largely thanks to the Montreal Protocol in 1987 the emissions of ozone-depleting gases have fallen by more than 99%, 99.7% to be exact, according to Our World in Data. This has resulted in halting the expansion of the ozone holes and the reduction in emissions of ozone-depleting gases is saving millions of lives every year.
A gigantic victory for the environment that few are aware of. To read the post click here.
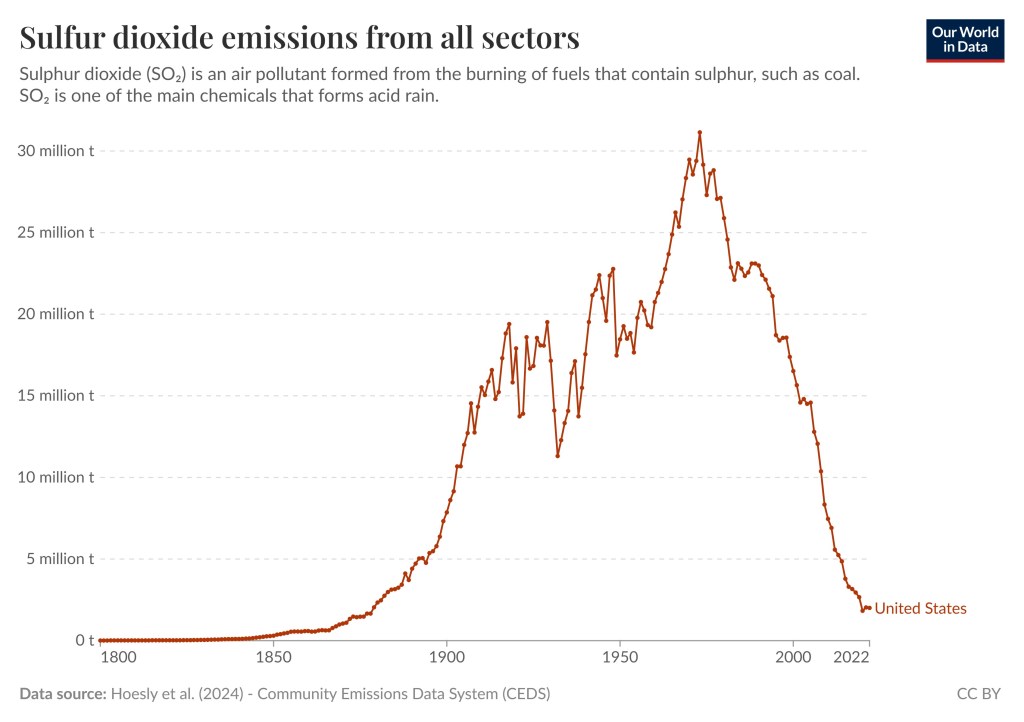
Sulfur dioxide pollution has fallen by 95 percent in the US
Super fact 44 : Sulfur dioxide pollution in the US has fallen by approximately 95% since the 1970s. This significant reduction is primarily due to regulations like the Clean Air Act. Global sulfur dioxide pollution has also fallen but not as much.
Another big victory for the environment that we seldom hear of. To read the post click here.

I should mention that by clicking this link you can visit the graph above Our World in Data and select different countries and regions and play around with the settings.
We Exploded Thousands of Nuclear Bombs
Super fact 48 : Since 1945 we have set off more than 2,000 Nuclear Bombs corresponding to a yield of an estimated 42,000 times that of the Hiroshima Bomb.
That we have exploded these many nuclear bombs was a surprise to me and perhaps to you too. To read the post click here.

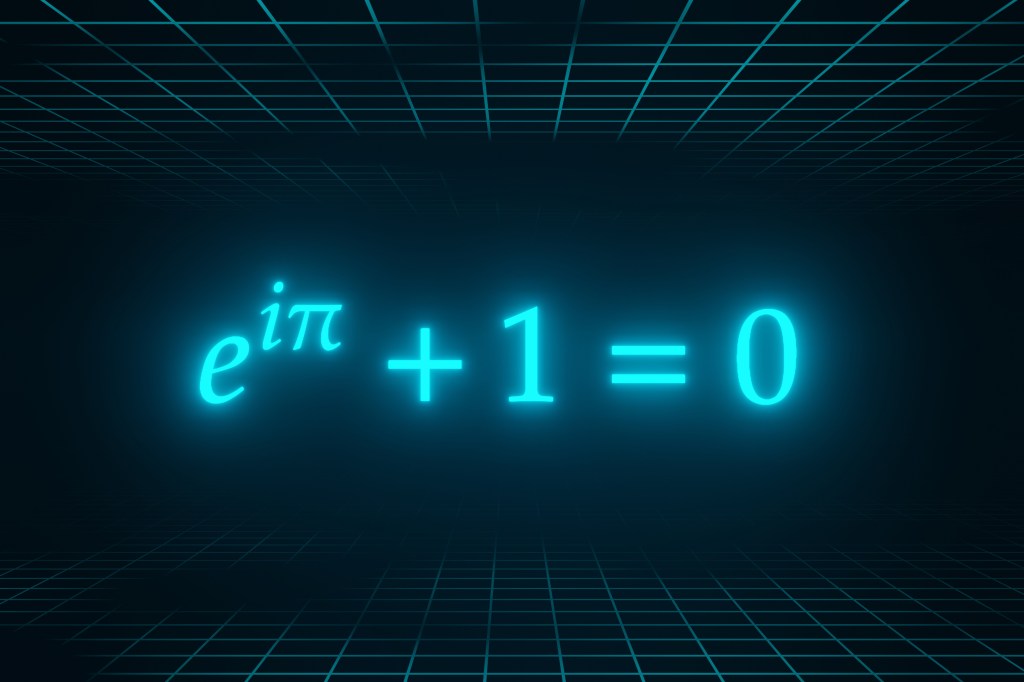
The Euler Number Math Magic
Super fact 53 : The Euler number denoted e, is an irrational number, which like the number pi is extremely important in mathematics. In addition, the relationship between the Euler number and pi; seemingly unrelated numbers, is quite amazing, especially if you throw the imaginary number: i = square root of -1 into the mix. Euler’s formula e^ix = cos(x) + isin(x), where x is degrees expressed in radians, is mind blowing to say the least. Radians means that 180 degrees is replaced by pi, and 90 degrees is replaced by pi/2, etc. A simpler special case, but equally amazing is Euler’s identity e^ix = -1, or e^ix + 1 =0. This is amazing math assuming you understand it.
One of the most amazing math facts explained. To read the post click here.
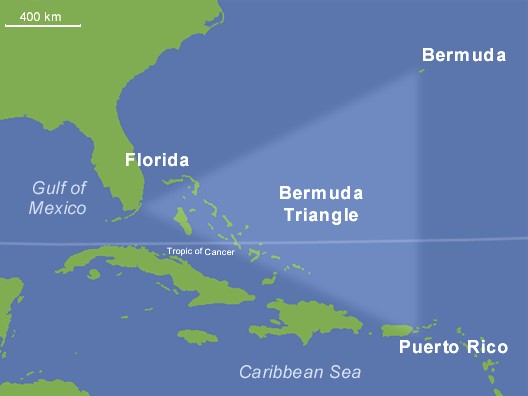
The Bermuda Triangle the Big Non-Mystery
Super fact 56 : The Bermuda Triangle mystery is a myth. There is not a higher risk of disappearances in the Bermuda Triangle. To be specific, disappearances do not occur in the so-called Bermuda Triangle, or Devils Triangle, with any higher frequency than in other comparable regions of the ocean. The “mystery” of the Bermuda Triangle is largely a manufactured one, perpetuated by sensationalized accounts that often misrepresent the facts and downplay the role of natural hazards like storms.
A surprise to the people who are convinced that there really is a mystery. To read the post click here.
Evolution is a Fact
Super fact 63 : Evolution is both a fact and a scientific theory. It is a fact that life has changed over time. This is supported by overwhelming evidence, while the theory of evolution provides a comprehensive scientific explanation for these changes, using processes like natural selection.
Yes, there are scientific facts, and that evolution is happening is an observed scientific fact. To read the post click here.