Nuclear Energy is Relatively Clean and Safe

Superfact 96: Nuclear power is a relatively clean and safe energy source that produces no atmospheric emissions during operation. However, there are some problems with nuclear power, but they are often overblown.
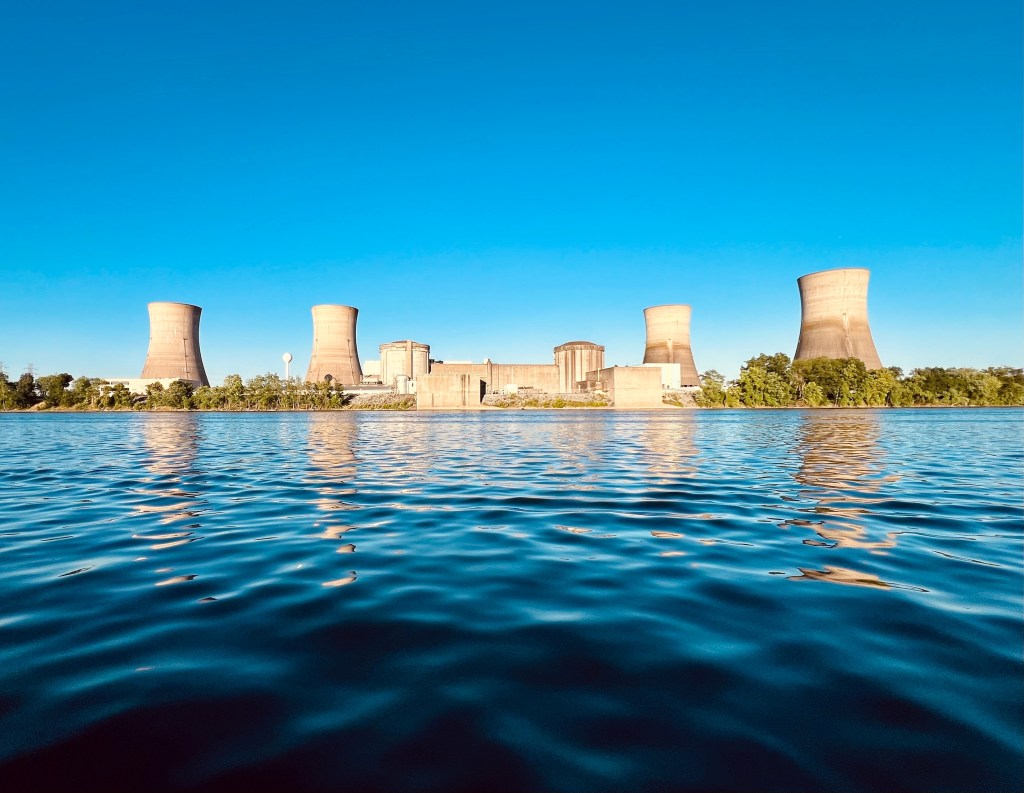
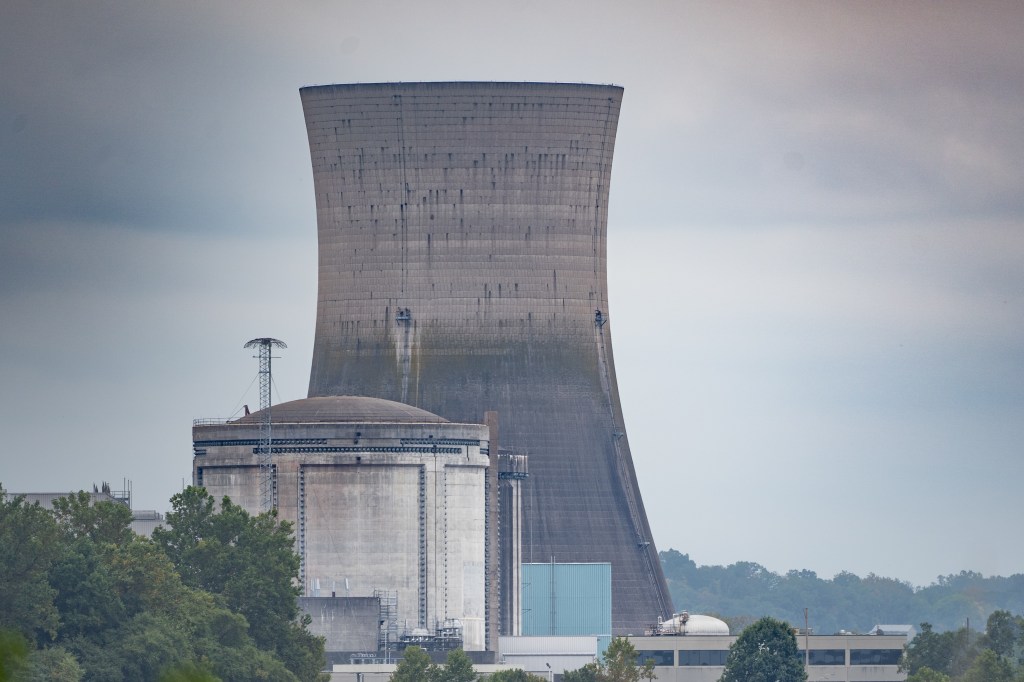
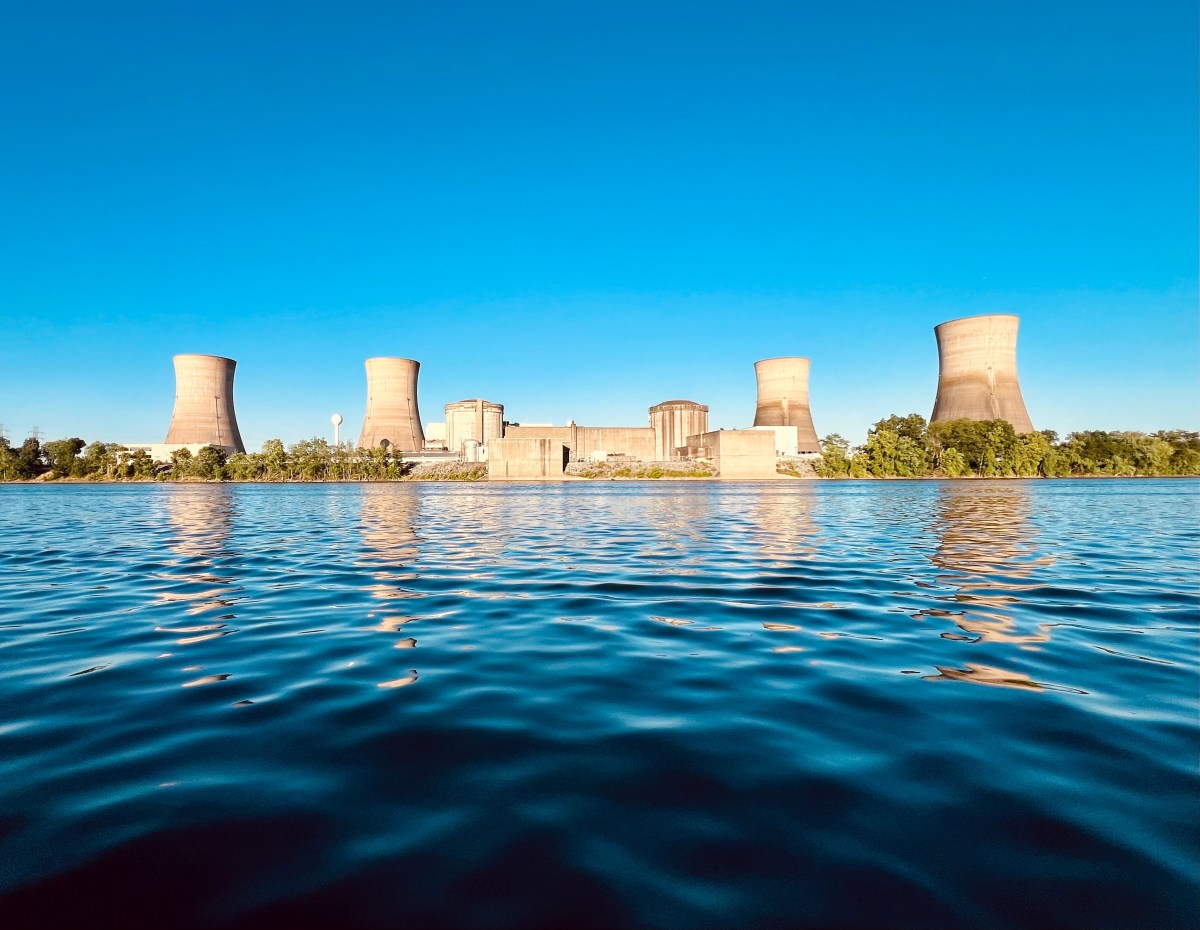
The photo shows the three mile island nuclear plant from the across the shore of Susquehanna River in Londonderry Township.
The Three Mile Island Nuclear Power Plant south of Harrisburg, Pennsylvania. March 28, 1979, a nuclear accident at the Three Mile Island nuclear power plant sent shockwaves across the world, raising fears about nuclear power. However, no one died, and no one was hurt. Shutterstock Asset id: 2512612545 by Aubrie K

Clean energy sources are often defamed by disinformation and misunderstandings. For example, wind power turbines are not bird killing machines. Contrary to what you often hear wind power is indeed a very clean, cheap and sustainable energy source. Nuclear power is another misunderstood energy source. Wind power, solar power, hydro, and nuclear power are all considered clean energy because they produce no greenhouse gases or air pollution during operation and they also have very low life-cycle emissions.

The graph below from Our World in Data depicting lifetime greenhouse gas emissions (construction, operation, disposal) and safety data for the European Union, show that the lifetime greenhouse gas emissions of coal power is 162 times higher than those of nuclear power and coal kill 820 times as many people as nuclear power. The lifetime greenhouse gas emissions of natural gas are 120 times higher than those of nuclear power and kill 613 times as many people as nuclear power. The difference is staggering.
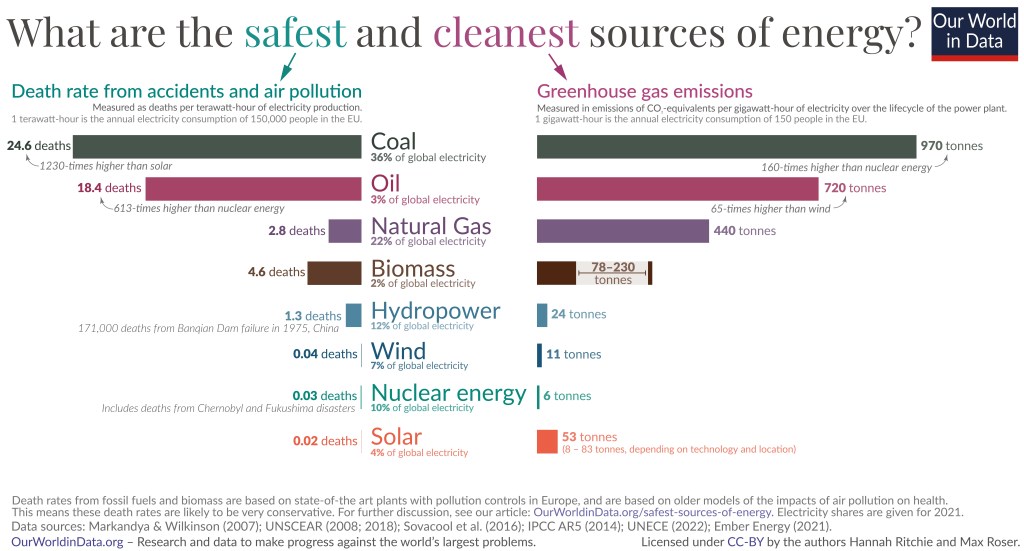
The graph depicts death rates and greenhouse gas emissions per unit for different energy sources including coal, oil, natural gas, biomass, hydropower, wind, nuclear power, and solar. | Nuclear Energy is Relatively Clean and Safe
Death rates from fossil fuels and biomass are based on state-of-the art plants with pollution control in Europe and are based on older models of the impacts of air pollution on health. This means that these death rates are likely to be very conservative. For further discussion see our article: OurWorldinData.org/safest-sources-of-energy. Electricity shares are given for 2021. Data sources: Markandya & Wilkinson (2007); UNSCEAR (2008: 2018); Sovacol et al. (2016); IPCC AR5 (2014); UNECE (2022); Ember Energy (2001). OurWorldinData.org – Research and data to make progress against the world’s largest problems. Licensed under CC-BY by the authors Hannah Ritchie and Max Roser. Citation : Hannah Ritchie (2020) – “What are the safest and cleanest sources of energy?” Published online at OurWorldinData.org. Retrieved from: ‘https://archive.ourworldindata.org/20260202-100556/safest-sources-of-energy.html’ [Online Resource] (archived on February 2, 2026).

In the graph above, greenhouse gas emissions are measured of CO2 equivalents per Gigawatt-hour of electricity over the lifecycle of the power plant. 1 Gigawatt-hour is the annual electricity consumption of 150 people in the EU. Death rate from accidents and air pollution is measured as deaths per Terawatt hour of electricity production. 1 terawatt hour is the annual electricity consumption of 150,000 people in the EU.

I should mention that there are problems with nuclear power that are not entirely covered by the graph above, including radioactive waste, a history of spectacular accidents, and a perceived connection to nuclear arms. However, as you will see later in this post, even though these problems get a lot of media attention, they are not as scary as one might think. However, it should be noted that nuclear power in its current form is not a cheap source of energy, but that is a different topic.

I consider this a super fact because nuclear power is often thought of as an extremely dangerous and dirty source of energy, which is not the case.

How Does Nuclear Power Work ?
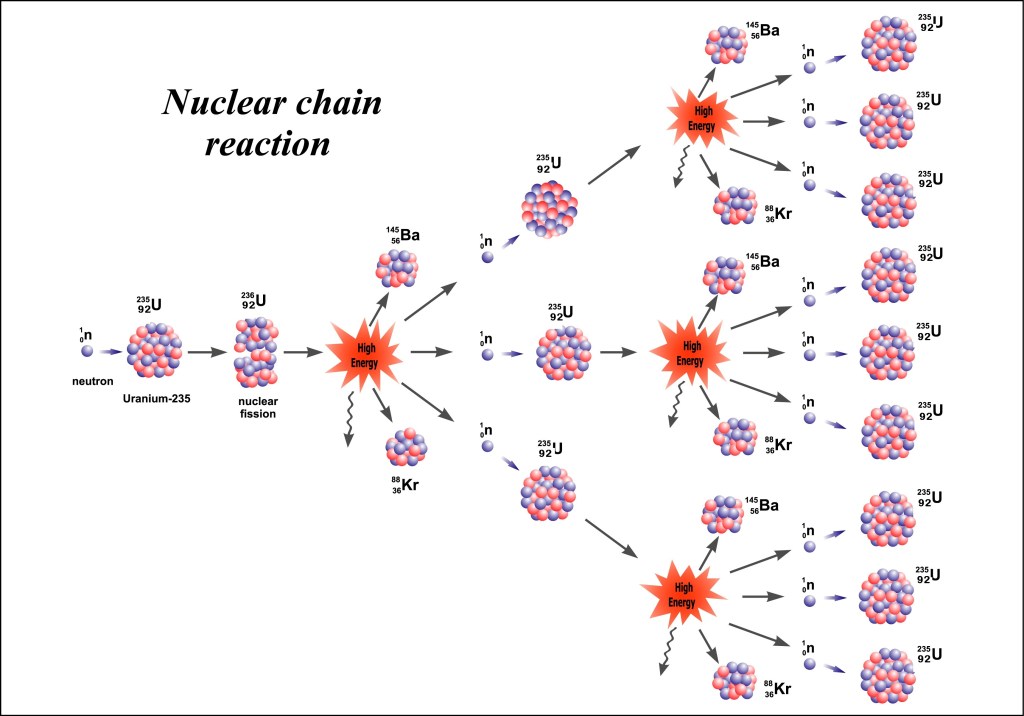
From left to right : a neutron strikes a uranium nucleus, and it breaks apart into a Krypton and Barium isotope and release three neutrons, which strike three uranium nucleuses, causing three fission events and releasing nine neutrons in total, etc.
Illustration of nuclear chain reaction. Uranium-235 fission. Shutterstock asset id: 73714504 by Mpanchenko. Note I corrected an error in the picture.

The fuel (fuel rods) in a nuclear power station consists primarily of stacked ceramic pellets made of low enriched uranium dioxide housed inside sealed metal tubes. The uranium consists primarily of two uranium isotopes U-238, which has 92 protons and 146 neutrons and U-235, which has 92 protons and 143 neutrons. Uranium always has 92 protons. The isotope that is used for fission is U-235. Natural Uranium consists of 0.7% U-235, trace amounts of U-236 and the rest (99.3%) is U-238. The uranium in nuclear fuel rods is either natural (0.7% U-235) or a few percent of U-235 (low enriched uranium). This should be contrasted with a uranium atomic bomb which has at least 80% U-235 (highly enriched).

A nuclear power plant generates electricity using heat from nuclear reactions. Inside the reactor, atoms of fuel (uranium) undergo nuclear fission, where they split apart and release a large amount of heat. The fuel rods (see picture below) in a nuclear power station consist primarily of stacked ceramic pellets made of low enriched uranium dioxide housed inside sealed metal tubes. There are also control rods in a nuclear power station, which consist of materials with a high neutron absorption cross-section. The control rods are used to regulate the reaction. If they are fully inserted the reaction will stop. Also note that nuclear reactors have a containment shield (at least in western countries).
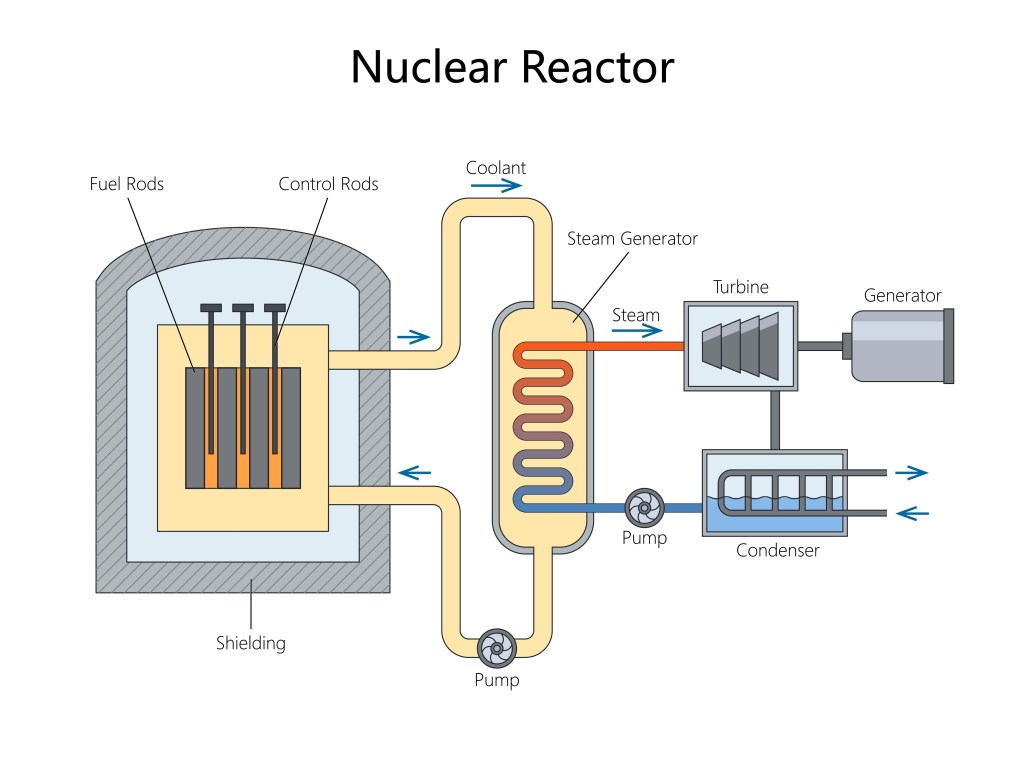
How a nuclear reactor generates electricity using fuel rods, control rods, steam, turbines, and generators diagram hand drawn schematic vector.
Fission generates heat, which generates high pressure steam, which pushes a turbine around, which turns a generator, which generates electricity, which is transformed to the right voltage and delivered to customers. Science educational illustration Shutterstock Asset id: 2658971563 by Alexander_P

Below is an alternative illustration.
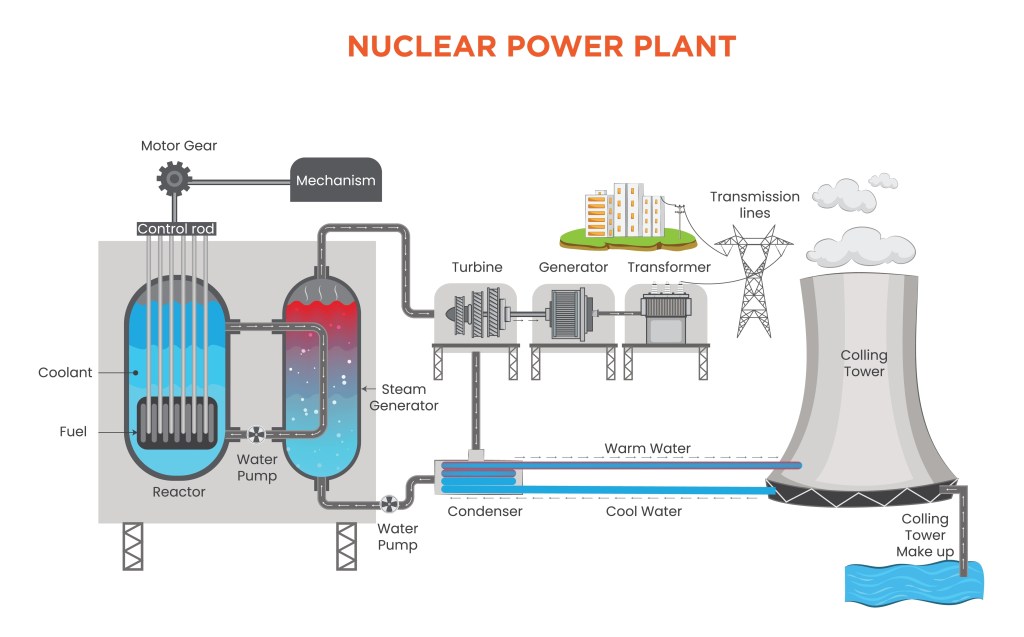
Fission generates heat, which generates high pressure steam, which pushes a turbine around, which turns a generator, which generates electricity, which is transformed to the right voltage and delivered to customers. The picture also shows a cooling tower and illustrates how a nuclear plant uses water.
A nuclear power plant generates electricity by using heat from nuclear fission to produce steam, which drives turbines connected to electrical generators. This illustration also depicts the nuclear power plant’s use of water for cooling. Don’t worry, the water will not turn radioactive. It is a separate isolated loop. Shutterstock Asset id: 2525528665 by Papia Majumder.
The photo is taken in 2024 and shows the Three Mile Island Nuclear Plant with a nuclear reactor building and the associated coolant tower. | Nuclear Energy is Relatively Clean and Safe
Three Mile Island Nuclear Plant, located in Pennsylvania, is known for a partial meltdown in 1979 Shutterstock. This photo shows the reactor as well as the cooling tower. Asset id: 2520903273 by Amy Lutz.

What about Chernobyl ?

The Chernobyl disaster, which occurred on April 26, 1986, was the worst nuclear disaster in history. 50 people died as a direct result of the disaster and an estimated 4,000, perhaps 10,000 future cancer deaths are predicted from the disaster. However, it should be noted that an estimated half million people died from coal pollution in the United States over the first two decades of the 21st century. You have to compare.

Another, thing to keep in mind is that the Chernobyl reactors were RBMK reactors (Reaktor Bolshoy Moshchnosti Kanalnyy), an extremely flawed, old and dangerous design that only exists in Russia (or the former Soviet Union). Above I mentioned that the control rods slow down the nuclear reaction when inserted between the fuel rods and stop the reaction when fully inserted. In an RBMK reactor, it is the other way around. The control rods speed up the reaction when inserted. Add the fact that the Chernobyl reactor did not have a containment shield designed to contain a major release of radioactivity, unlike Western reactors and that the Soviet Union was an authoritarian and secretive regime that made things much worse. A nuclear disaster similar to Chernobyl is highly unlikely to happen in the West.

The Fukushima nuclear disaster was caused by a severe earthquake and a 15 meter tsunami. Around 2,300 died from the evacuation, and 15,000 people died from the Earthquake, but it is estimated that no one, or perhaps one person died as a direct result from the nuclear disaster itself. As mentioned no one died from the Three Mile Island accident.

What about Radioactive Waste?

Radioactive waste stored on-site at nuclear power stations (spent fuel) is often millions of times more radioactive than long-term disposal waste. It is important to remember that highly radioactive isotopes decay fast (that’s why they are dangerous), which means that long-term disposal waste is not very dangerous. We are surrounded by radioactivity and our by far largest exposure to ionizing radiation comes from the radon in our basements.

Does nuclear power for energy generation increase the risk for nuclear weapons proliferation?

While commercial nuclear energy and weapons programs share technology, they are distinct processes. The historical data and studies show that national nuclear energy programs in general don’t lead to the development of nuclear weapons. No country officially developed nuclear weapons based on a pre-existing commercial nuclear power industry. Typically, nuclear-armed nations developed dedicated, military-focused, and often secret reactors to produce plutonium or facilities to enrich uranium for weapons.  Also, the issue is mostly moot for countries that already have nuclear weapons, such as the United States.

Conclusion

Nuclear power is clean and safe. It might be our cleanest energy source that can provide baseload power. However, there are other concerns including the possibility of spectacular accidents, radioactive waste and the possibility that nuclear power for energy might aid nuclear weapons proliferation. Luckily, it appears that these concerns are overblown. It should be noted that nuclear power, as implemented today, is not cheap energy, but that is a different topic.
To see the Other Super Facts click here

The Deadliest War in this Century was in Congo

Super fact 95 : More than 4-5 million people died in Congo Civil War 1998 to 2003 and its aftermath (until 2007). In addition, some of the other of the deadliest wars in the 21st century are not well known.

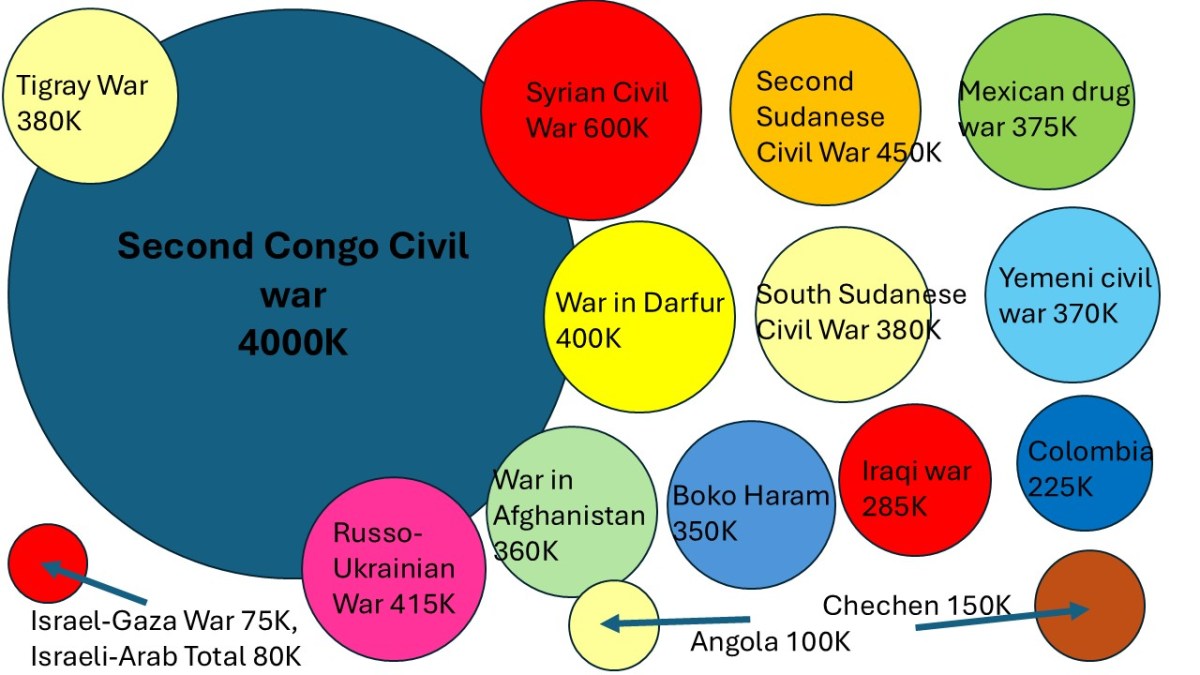
Below : 21st Century death toll from different wars, current and recent.

The graphics include colored circles corresponding to 15 wars. The conflicts are Second Congo Civil war 4 million deaths, Syrian Civil War 600 thousand deaths, Second Sudanese Civil War 450 thousand deaths, Russo-Ukrainian War 415 thousand deaths, War in Darfur 400 thousand deaths, South Sudanese Civil War 380 thousand deaths, Mexican drug war 375 thousand deaths, Yemeni civil war 370 thousand deaths, War in Afghanistan 360 thousand deaths, Boko Haram 350 thousand deaths, Iraqi war 285 thousand deaths, Colombia 225 thousand deaths, Chechen 150 thousand deaths, Angola 100 thousand deaths, Israel-Gaza War 75 thousand deaths, Israeli-Arab Total 80 thousand deaths.
The number of deaths cited in the graphics above correspond to rough midpoint values of the estimates for the 21st century. K stands for one thousand deaths. The area of the circles corresponds to these midpoint estimates. See the list of conflicts under “Deadliest twenty first Century Wars”.

Notes on the graphics above:

  • The 16 wars included in the graphics above roughly correspond to the deadliest wars in the 21st century. However, a few of the wars included in the graphics are not among the 16 deadliest wars of the 21st century.
  • Some of the wars included above started in the 20th century. The number of deaths estimates corresponds to the portions that happened in the 21st century.
  • The number of deaths from the Congo Civil War include famine and plagues that resulted from the war.
  • I had a hard time finding an estimate for just the 21st century portion of the Congo Civil War. However, the vast majority of the deaths happened in the 21st century.
  • The death estimates for the Russo-Ukrainian War might be underestimated due to unreliable reporting by Russian authorities.
  • The Israeli-Gaza war may seem smaller than expected. However, media attention does not necessarily correspond to the size of the devastation of a conflict.
  • The estimate for the number of deaths for the current Iran-US-Israel war is between 3,600 to nearly 5,400 deaths, which is too small to be part of this post.
  • There are / were hundreds of wars and conflicts in the 21st century.

I consider this a super fact because it is true, an important history fact and despite the enormous losses in the Congo Civil War a lot of people do not know much about it and may not even have heard about it.

The Deadliest War in this Century was in Congo
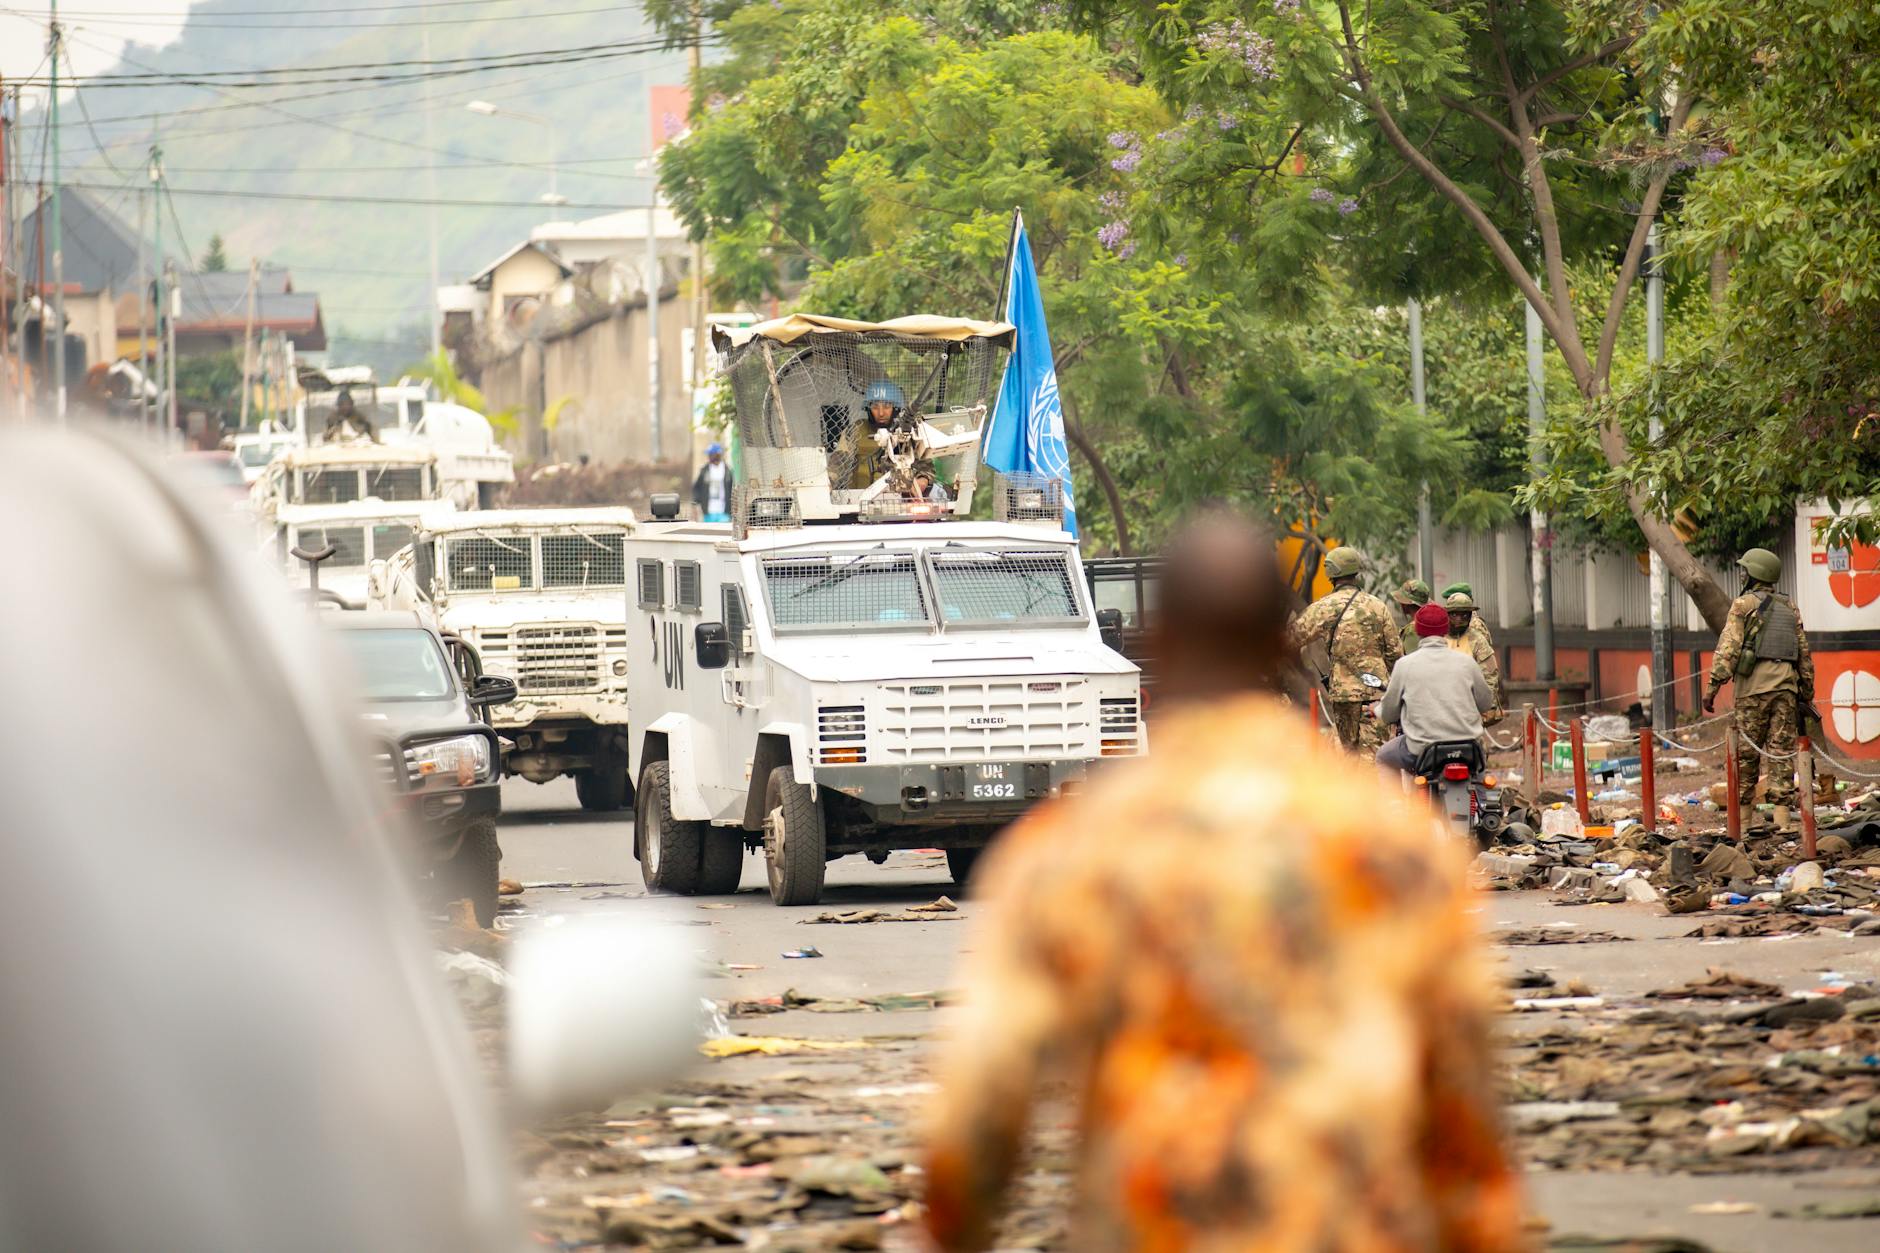
Photo by Safi Erneste on Pexels.com

Deadliest Wars in the Twenty First Century

  • The Second Congo Civil War 1998 to 2007. With an estimated 3 million to 5.4 million deaths. Read about it here, here, or here.
  • The Syrian civil war 2011 to 2024. With an estimated 580 thousand to 610 thousand deaths.
  • Second Sudanese Civil War 1983 to 2005. With an estimated 2 million deaths in total, with 300,000 to 600,000 deaths occurring in 21st century.
  • Tigray War 2020 to 2022. With an estimated 160 thousand to 600 thousand deaths.
  • War in Darfur 2003 to 2020. With an estimated 400 thousand deaths.
  • Russo-Ukrainian War 2014 to present. With an estimated 350 thousand to 480 thousand deaths.
  • Mexican drug war 2006 to present. With an estimated 350 thousand to 400 thousand deaths.
  • South Sudanese Civil War 2013 to 2020. With an estimated 380 thousand deaths.
  • Yemeni civil war 2014 to present. With an estimated 370 thousand deaths.
  • War in Afghanistan 2001–2021. With an estimated 360 thousand deaths.
  • Boko Haram insurgency 2009 to present. With an estimated 350 thousand deaths.
  • Iraqi war 2003 to 2017. With an estimated 270 thousand to 300 thousand deaths.
  • Colombian conflict 1964 to present. With an estimated 450 thousand deaths but with about half of those deaths happening in the intense fighting of the 21st century.
  • Chechen conflict 1994 to 2009. With an estimated 80 thousand to 230 thousand deaths, most  of those, 150 thousand, happening in the 21st century.
  • Angolan Civil War  1975 to 2002. With an estimated 800 thousand deaths many in the final years of the conflict with an estimated 100 thousand in the 21st century.
  • Burundian Civil War 1993 to 2005. With an estimated 550 thousand to 800 thousand deaths, many in the final years of the conflict with an estimated 50 thousand deaths in the 21st century.
  • The Arab Israeli conflict 1948 to present (multiple wars) . With an estimated 200 thousand deaths in total with 80 thousand deaths happening in the 21st century.
  • The Israel Gaza conflict (2023 to present). With an estimated 75 thousand deaths.

To read related posts of mine see “We are living in relatively peaceful times“ and “Deadliest Civil War Was the Taiping Rebellion”.


To see the other Super Facts click here

Human Vision Only Detects a Sliver of the EM Spectrum

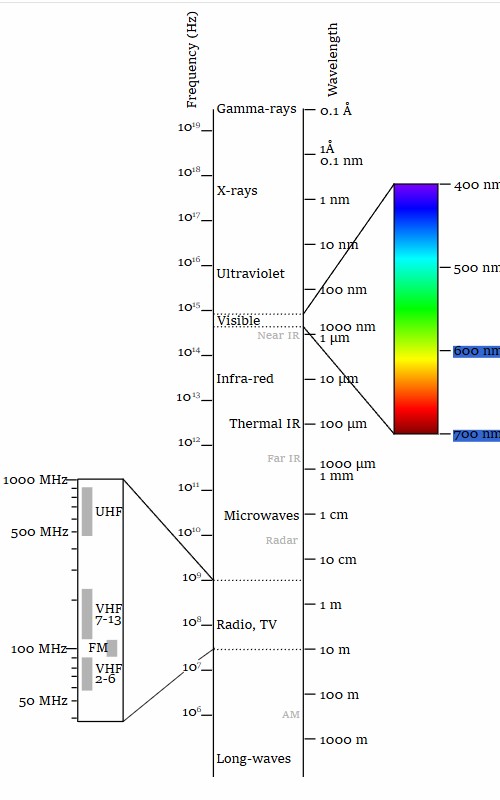
Superfact 94: Light is electromagnetic radiation. The electromagnetic spectrum we deal with goes from long wave radiation at a frequency of 0.3 Giga Hertz to gamma rays at 30,000,000,000 Giga Hertz, and far beyond. Light that is visible to humans goes from around 428,000 Giga Hertz to 750,000 Giga Hertz. This is a very thin sliver in the electromagnetic spectrum. In addition, many animals can see beyond the spectrum visible to humans.

Esther’s writing prompt: April 8 : Vision

Click here or here  to join in.

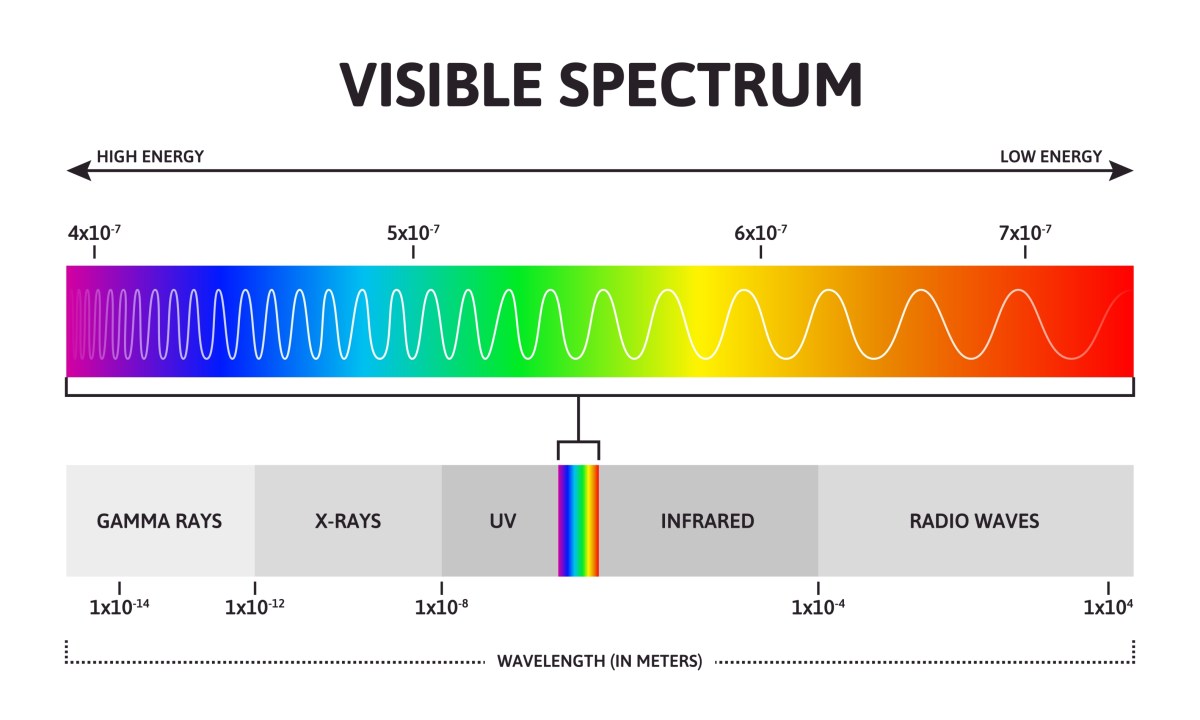
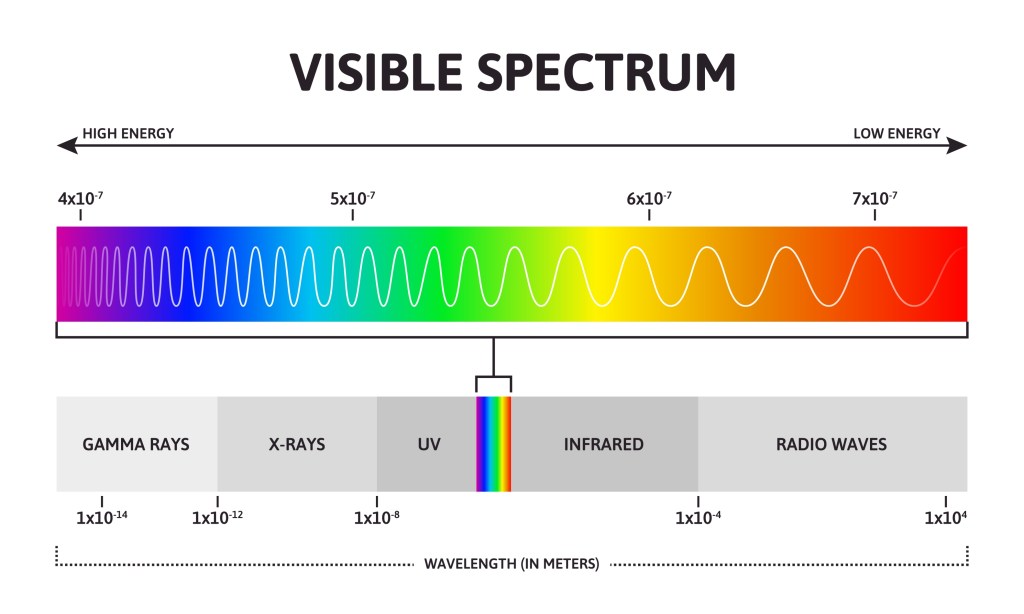
If you consider wavelength instead of frequency, the electromagnetic spectrum goes from gamma rays at a wavelength of 0.00000000001 meters to long waves at a wavelength of 1,000 meters. Visible light has a wavelength of 0.0000004 meters to 0.0000007 meters. Again, human vision corresponds to only a thin sliver of the electromagnetic spectrum.

The picture shows the spectrum visible to humans as a horizontal bar at the top. This spectrum is superimposed on a wider spectrum below as a thin rainbow colored strip. The wider spectrum is also placed horizontally and goes from gamma rays to radio waves. | Human Vision Only Detects a Sliver of the EM Spectrum
The visible color spectrum. Sunlight wavelength and increasing frequency vector infographic illustration. Visible spectrum color range. Rainbow electromagnetic waves. Educational physics line. Shutterstock Asset id: 1933622132 by Shutterstock Asset id: 1933622132 WinWin artlab.
The electromagnetic spectrum is vertical and goes from long waves at the bottom to gamma rays at the top. The spectrum visible to humans is a thin sliver in the middle.
The spectrum visible to humans highlighted on a spectrum going from long waves to gamma rays. Original:  Penubag Vector:  Victor Blacus, CC BY-SA 3.0 <https://creativecommons.org/licenses/by-sa/3.0&gt;, via Wikimedia Commons

It should be noted that the spectra above go from long waves to gamma rays because that’s the range of the spectra we typically deal with. However, the electromagnetic spectrum continues far beyond that.

I consider “Human Vision Only Detects a Sliver of the EM Spectrum” a super fact because it is a well-known fact among those who have studied physics, and it is an important fact, and yet I believe it is a surprise to many.

The Spectrum Visible to Animals

A lot of animals can see beyond the spectrum visible to humans. For example, animals that can see UV light including reindeer, scorpions, butterflies, bees, salmon, hedgehogs, many birds, amphibians, and reptiles. Humans cannot see UV light. You can read about various animals that can see UV light here, here, and here.

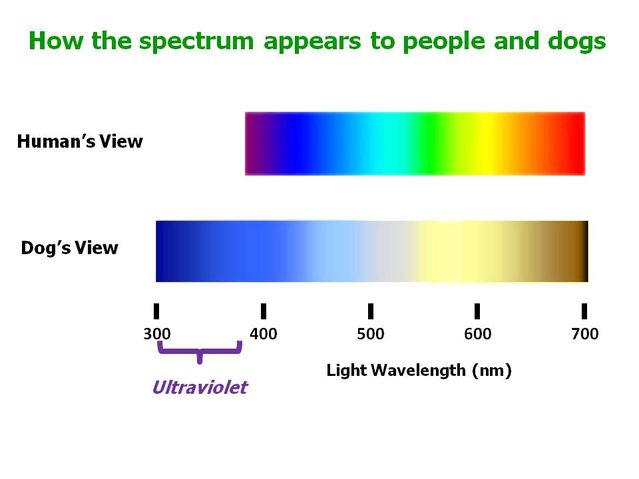
It appears that dogs and cats can see UV light as well. The color vision of dogs is in general poor, at least on the red side of the visible spectrum. However, dog vision includes UV light that we cannot see.

There are two colorful horizontal bars in the picture representing how the spectrum appears to people and dogs. The top bar depicts human’s view, and the bottom one is dog’s view. The human’s view is more colorful, but the dog’s view extends into UV light on the left.
Picture is from psychology today.

Many animals can also see or detect infrared radiation. A famous example are snakes. However, many other animals can detect infrared radiation including mosquitos, beetles, and other insects, some bats, bullfrogs, wolves, foxes, and some fish.

My Other Responses to Esther’s Prompts


To see the Other Super Facts click here

Deadliest Civil War Was the Taiping Rebellion

Superfact 93 : Around 20 to 30 million people died in the Taiping Rebellion, 1850 to 1864. It is the deadliest civil war in known history, the deadliest war in the 19th century, and the second deadliest war in all of known history. World War II was the deadliest.

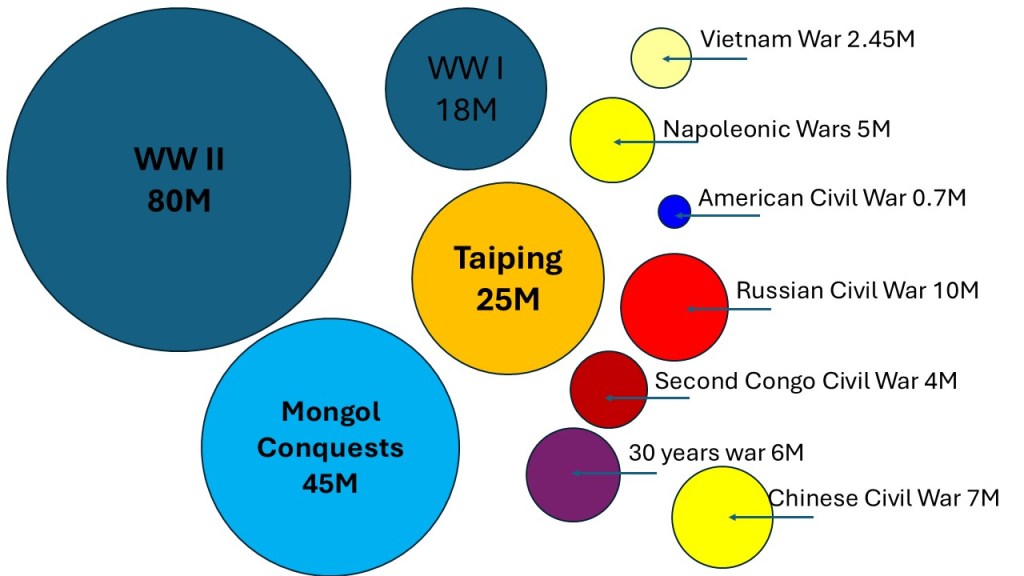
The graphics show differently colored circles corresponding to selected large wars. World War II – 80 million, Mongol conquests – 45 million, Taiping Rebellion – 25 million, World War I – 18 million, Russian Civil War – 10 million, Chinese Civil War 7 million, 30 years’ war 6 million, Napoleonic Wars – 5 million, Second Congo Civil War 4 million, Vietnam War 2.45 million, American Civil War 0.7 million. | Deadliest Civil War Was the Taiping Rebellion
The number of deaths cited in the graphics above are rough midpoint values of the estimates. The area of the circles corresponds to these midpoint estimates. Note Mongol conquests correspond to multiple wars during a time period of 162 years. The ‘M” corresponds to millions.

The Taiping rebellion is estimated to have caused the deaths of 20-30 million people. However, some estimates estimate that as many as 70 million people might have died in the Taiping rebellion. The Mongol invasions and conquests cost 30-60 million lives, but they comprised many wars and took place during a time period of 162 years (1206 – 1368). Therefore, you typically don’t count that as one war. Also note that the estimate for deaths caused by World War I does not include the Spanish flu.

I consider this a super fact because it is true, an important history fact and despite the enormous losses in the Taiping rebellion, a lot of people have never heard of it.

Photo by jefe king
Photo by jefe king on Pexels.com

Deadliest Wars

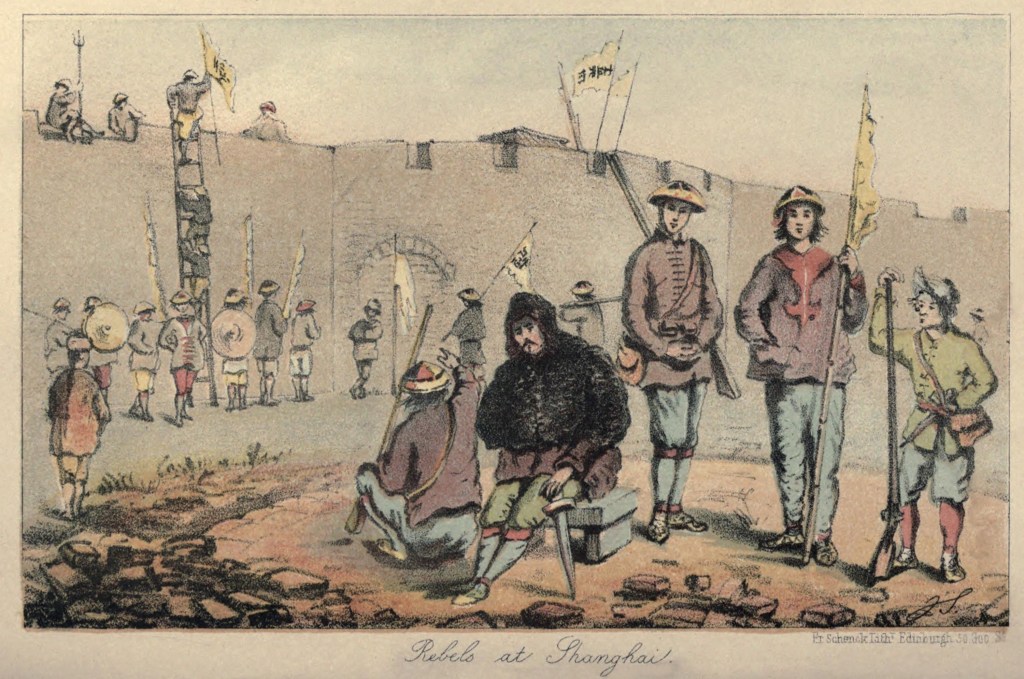
Illustration of Chinese warriors preparing outside a fortified city.
Taiping Rebels at Shanghai China in 1853-54. ‘Small Swords’ refers to daggers used by warriors or martial artists in close combat. 19th century print. Stock Illustration ID: 237232531 by Everett Collection.

The links above are from Encyclopedia Britannica and from Wikipedia. Also note that after the Napoleonic Wars entry I only listed wars that happened after World War II and resulted in around a million deaths. The exception is the American Civil War. The list would be too long otherwise.

The Taiping Rebellion

The Taiping Rebellion was a civil war in China between the Qing dynasty and the Taiping Heavenly Kingdom. The Taiping Heavenly Kingdom was a theocratic monarchy that tried to overthrow the Qing dynasty. It was led by Hong Xiuquan, a religious leader who believed he was Jesus younger brother. In the end the Qing dynasty prevailed but at a great cost.

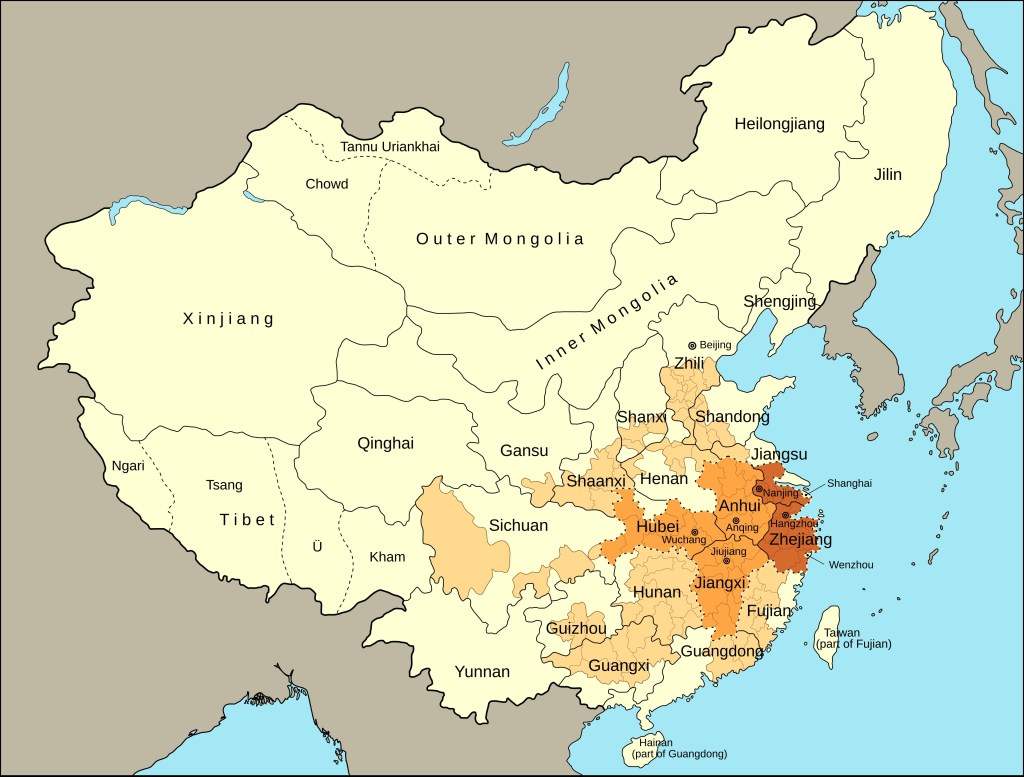
A map of China in the 19th century. It shows the extent of the Taiping Heavenly Kingdom and how it shrunk. | Deadliest Civil War Was the Taiping Rebellion
A map showing the extent of the Taiping Heavenly Kingdom. The dark area is the extent towards the end. M.Bitton, CC BY-SA 4.0 https://creativecommons.org/licenses/by-sa/4.0, via Wikimedia Commons.


To read a related post of mine with a different perspective see “We are living in relatively peaceful times“.


To see the other Super Facts click here

College Tuition Tripled in 25 years

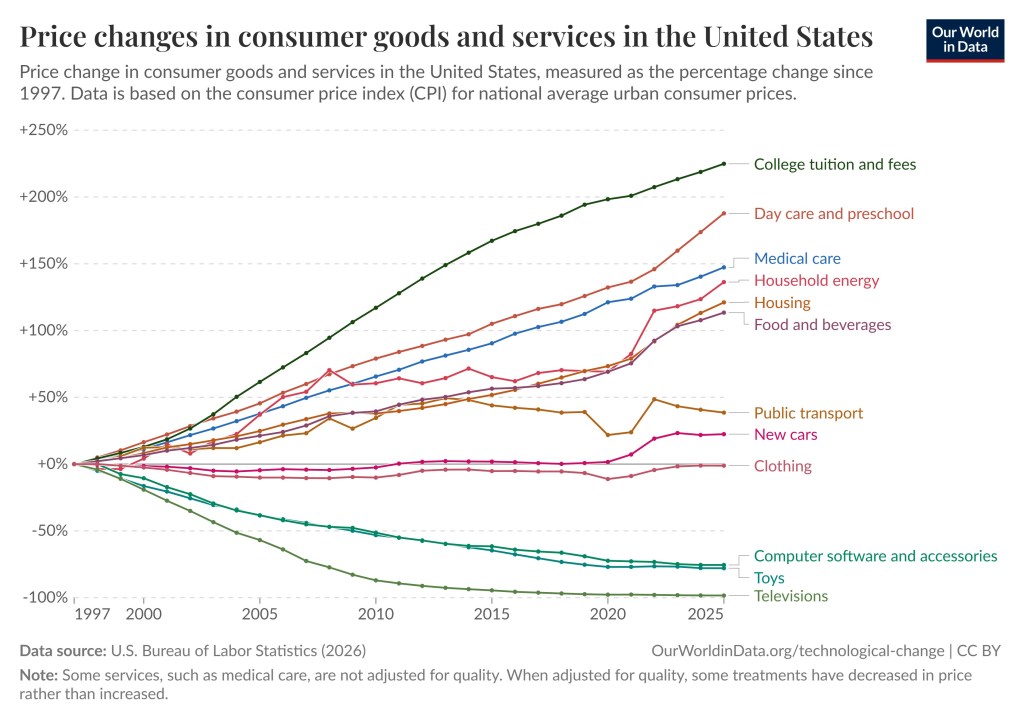
Super fact 92 : College tuition and fees increased by 207% between 1997 and 2022, which corresponds to a tripling.  Since 2022 it has continued to increase. Adjusted for inflation this corresponds to a 60% increase, more than any other major economic sector.

A man is being sucked into a hole filled with money. | College Tuition Tripled in 25 years
Students are sucked into a hole with money for college tuition. Shutterstock Asset id: 335014478 by alphaspirit.it.
The graph shows the percentage increase of college tuition and fees, Day care and preschool, medical care. Household energy, Housing, Food and beverages, public transport, new cars, Clothing, Computer software and accessories, toys, Televisions.
Data source: US Bureau of Labor Statistics (2026). OurWorldInData.org/technological-change. Note: Some services such as medical care are not adjusted for quality, some treatments have decreased in price rather than increased. To visit the original page for this graph click here or on the picture.

To read about the graph above in greater detail click here. To read more about the increase in college tuition click here, here, here, or here. To calculate the inflation for different periods of time click here (the inflation calculator).

It should be noted in the graphs above that Televisions have decreased in price by 98%, which seems implausible. However, it is not an April 1st joke. It is not April 1st in Texas yet (where I live). The reason for the large decline in price of Televisions is that quality is taken into account. 20 years ago, you could not easily buy the kind of TVs you can today and if you did you would cost you an enormous amount of money. You get a lot more for a few hundred bucks than you did 20 years ago.

This is a superfact because it is true, shocking, and important to how we live.

Why have college Tuition become so expensive?

College tuition has increased so much due to administrative bloat, increased student loan availability, declining state funding for public institutions, and heavy spending on amenities to attract students.

An example of heavy spending on amenities is college sports. I studied at a university called Uppsala University, which is a very large University founded in 1477. It is considered one of the world’s top Universities (top 50). However, they do not have any competitive teams associated with the University itself. In 1987 I was sent as an exchange student (electrical engineering) to Case Western Reserve University, in Cleveland, Ohio. Case Western Reserve University has some competitive teams associated with the University but only a small college football stadium.

However, I quickly came to realize that many American universities have huge college football and baseball stadiums. This is an added expense that you rarely encounter in the rest of the world. Universities are for studies and for learning. Sports teams, whether it is soccer, or American football is a separate issue.

Aerial photo of a large football stadium. | College Tuition Tripled in 25 years
BLOOMINGTON, US – Aug 04, 2025: Side-angle drone view of Indiana University Memorial Stadium with field, stands, and cityscape on a clear summer day. . – Shutterstock Asset id: 2700467103


To see the other Super Facts click here