The goal of this blog is to create a list of super facts. Important facts that are true with very high certainty and yet surprising, misunderstood, or disputed by many. This blog aims to be challenging, educational, and fun, without it being clickbait. I determine veracity using evidence, data from reputable sources and longstanding scientific consensus. Prepare to be challenged (I am). Intentionally seek the truth not confirmation of your belief.
Superfact 120: The amount of wealth owned by the billionaires is roughly double as much as the poorest half of the world’s population. The amount of wealth owned by the 12 richest billionaires is more than the wealth of the poorest 50% of the world’s population. The richest 1% of the global population owns approximately 38% to 45% of the world’s total wealth.
US 100 dollar bills falling through the air Shutterstock Asset id: 2555911235 by Caito
There are at the moment of this writing 3,428 dollar billionaires in the world worth 20.1 trillion dollars together. For comparison the poorest 50% of the world’s population holds between $9 trillion to $12 trillion dollars of wealth (about half). According to this report the amount of wealth owned by the poorest half of the world is less than the amount owned by just the 12 richest billionaires. By the time you read this the numbers have probably changed (likely upwards). You can also read more in Wikipedia. I am specifying that it is in dollars and not let say in the Iranian Rial. With respect to the Iranian Rial, I am also a billionaire, and you are probably too (if you own a phone or computer). One dollar can buy roughly 1,300,000 to 1,600,000 IRR. You just need $700 to be a billionaire in the Iranian Rial.
World’s billionaires. Number and total wealth by year. Trillions of dollars. The graph comes from here. <<Link-6>> Katharina Buchholz. Cropped and edited by User:Timeshifter using freeware IrfanView., Public domain, via Wikimedia Commons.
I should say that initially I was just going to list interesting statistics about the super-rich. However, I found myself surprised by the statistics, and I am sure I am not the only one. Therefore, I picked a couple of facts I decided super facts.
The ten richest billionaires in the World
The numbers below are from Forbes Magazine. To see a list of all billionaires in the world, click here. To see a list with numbers that are updated minute by minute, click here.
Amancio Ortega – 148 billion dollars – source Zara
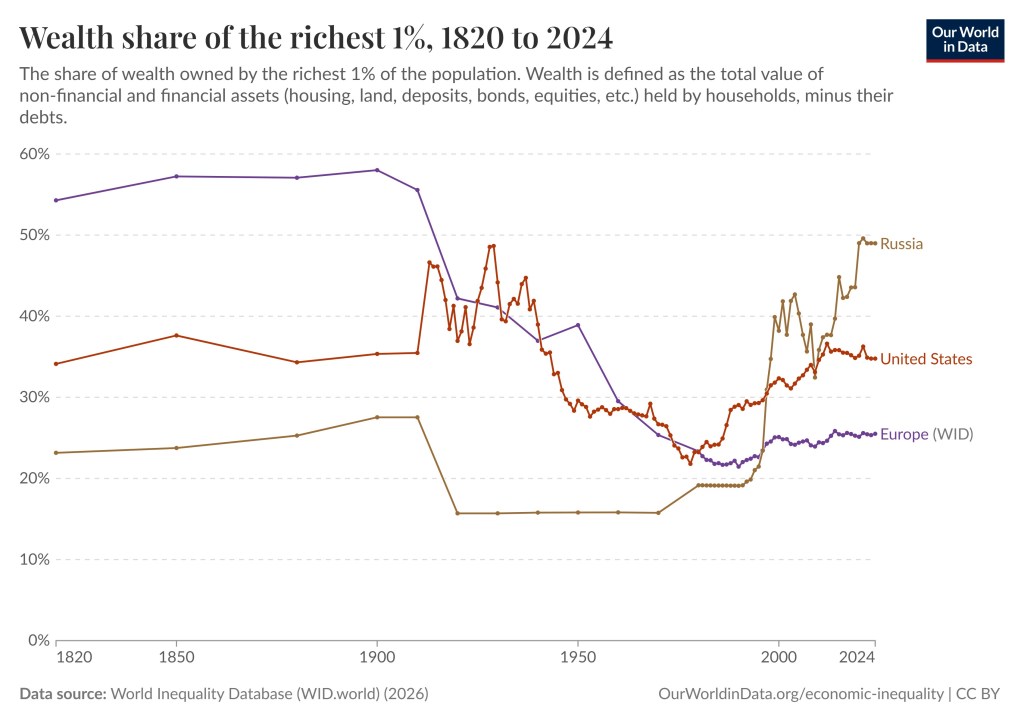
Wealth share of the richest 1%
The richest 1% of the global population owns approximately 38% to 45% of the world’s total wealth, which is more than what 95% of humanity own according to Oxfam. The richest 1% of the global population is not about billionaires, it may very well include you and me. Our World in Data has collected and analyzed the statistics for each country in the world. The top richest 1% in the United States own 34.78% of the wealth in the United States. The top richest 1% in Russia own 48.99% of the wealth in Russia. The top richest 1% in Sweden own 27.49% of the wealth in Sweden. The top richest 1% in the Netherlands own 13.98% of the wealth in the Netherlands. See the graphs below from Our World in Data.
The share of wealth owned by the richest 1% of the population. Wealth is defined as the total value of non-financial and financial assets (housing, land, deposits, bonds, equities, etc.) held by households, minus their debts. Data source: World Inequality Database (WID.world) (2026) – Learn more about this data OurWorldinData.org/economic-inequality | CC BY
As you can see from the graphs below the extreme inequality is nothing new. Europe was extremely unequal in the 19th century. The 1% owned 58.01% of the wealth in 1900. The United States was relatively equal in 1978 when the 1% owned 21.79% of the wealth. Russia became very unequal since 1995. I suggest that you play around with the graphs yourself .
The historic share of wealth owned by the 1% for different countries around the world, starting in 1820. Data source: World Inequality Database (WID.world) (2026) – Learn more about this data OurWorldinData.org/economic-inequality | CC BY
ABBA’s Money, Money, Money
Note: This post is not an implicit suggestion that we should tax billionaires more or less, and not about how or whether we should solve inequality, and it is not about politics. It is just surprising statistics regarding wealth and the reality of inequality.
Superfact 116: Time and space do not exist for light particles (called photons) and not for other particles without mass either. All massless particles travel at the speed c = 299,792,458 meters per second compared to all other objects regardless of how fast those other objects are moving. Objects / particles that have mass will always travel slower than c = 299,792,458 meters per second. The speed of light, c, is not really a speed. It is a conversion factor between space and time. It is therefore a universal constant.
Billions of photons coming into the eye. Shutterstock asset id: 2629068895 by muratart.
Light does not travel through a medium, like a sound wave, or a water wave does. There is no medium for light to travel in. Photons are massless, which means that an extremely tiny force, an infinitesimal smallest possible force, could send a photon off at infinite speed. There is no mass to hold the photon back.
However, the conversion factor between space and time c = 299,792,458 meters per second will prevent that and the photon will travel at this “speed”. Since c is a conversion factor, a physical constant describing time and space, this is not motion, or movement, in a normal sense. Space and time won’t allow any physical event to have any effect faster, and no information of any kind can travel faster than c = 299,792,458 meters per second.
This means that from the photon’s perspective there will be no time at all. A photon, or a light beam, will travel from Earth to a distant galaxy a billion light years away in an instant. It will not take a billion years. It will not take one year. It will not take one second. It will not take one microsecond. It will not take a nanosecond, or a picosecond, or a trillionth of a picosecond. It will take zero seconds. The Big Bang and the end of the Universe (if there is one) happen at the same exact moment to a photon. Time does not exist for a photon (or a gluon, or any other mass-less particle).
This is a mind-blowing fact, and it is true and important to our understanding of the Universe. Therefore, I consider it a super fact.
What does the Speed of Light Being a Universal Constant Mean ?
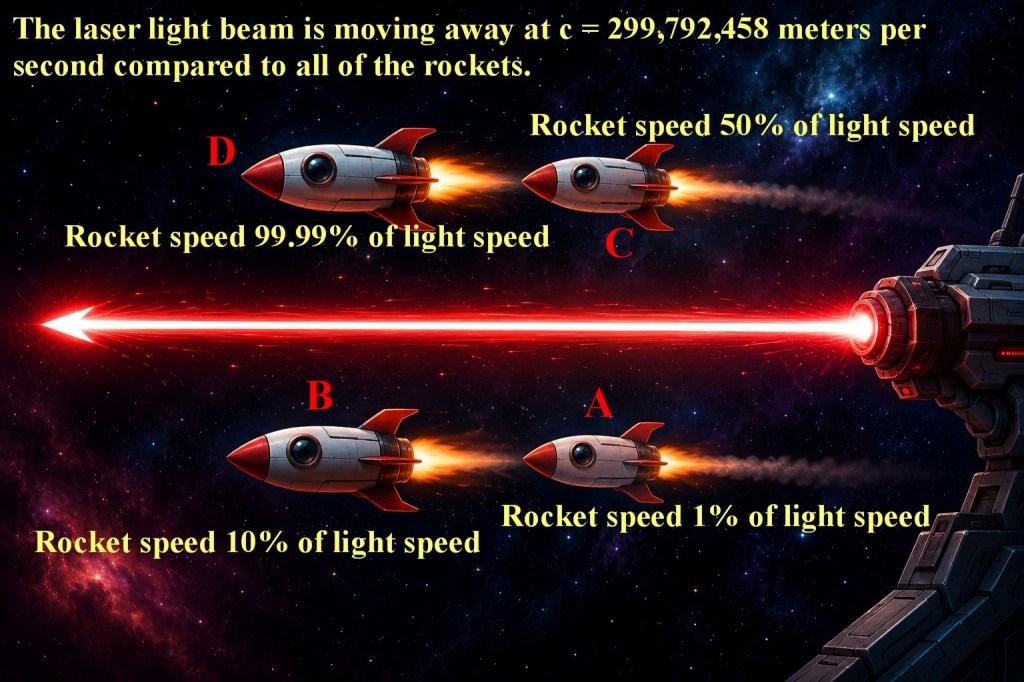
Four rockets, A, B, C, and D, are traveling along a light (laser) beam. No matter how fast they travel along the light beam, the light beam will always travel c = 299,792,458 meters per second faster than they do. I generated this picture with the help of ChatGPT.
The first thing to acknowledge about the speed of light (in vacuum) is that it is a universal constant as explained in my post “The Speed of Light in Vacuum Is a Universal Constant”. However, I am explaining this fact slightly differently in the next few paragraphs with the help of the picture above.
In the picture above we are emitting a light beam from our spaceship using our super laser. There are also four rockets that travel along the light beam. The rocket on the lower right (rocket A) travel at 1% of the speed of light v = 2,997,924.5 meters per second (or 2,998 miles per second). That is extremely fast, but much slower than light. You would think that the light beam would travel a little bit slower compared to this rocket at the relative speed c – v = 299,792,458 – 2,997,924.5 = 296,794,533.5 meters per second. But it doesn’t. The light beam is still speeding ahead of rocket A at exactly c = 299,792,458 meters per second.
What happens if you compare the beam with the rocket in the lower left (rocket B)? That rocket travels at 10% the speed of the light beam. Shouldn’t the light beam move 10% slower compared to that rocket? No, the light beam speeds ahead at exactly c = 299,792,458 meters per second compared to rocket B, once again.
Now take rocket C in the upper right corner. It also travels along the light beam but at half the speed of light. Shouldn’t the light beam travel at half of the speed of light compared to rocket C? No, it will stubbornly travel at exactly c = 299,792,458 meters per second compared to rocket C. Not less and not more.
The same is true for the rocket in the upper left, rocket D. It travels at 99.99% of the light speed compared to us in the spaceship, and yet the light beam will stubbornly travel at exactly c = 299,792,458 meters per second compared to rocket D. Not less and not more.
The universal speed c = 299,792,458 meters per second is not so much about light. As mentioned, it is a conversion factor between space and time. You take this conversion factor with you everywhere you go and regardless of how fast you move. That’s the way time and space works.
The fact that the speed of light is a universal constant that is exactly the same for all observers, no matter how fast they move, should tell you that it is not a speed in a normal sense. It is not really a “speed” at all. As mentioned, it is a conversion factor between space and time. Light isn’t really travelling super-fast. It is just conforming to the geometric reality of time and space, and to us it looks like it is travelling at the speed c = 299,792,458 meters per second.
The Space-Time Interval for Light is Zero
I mentioned that from the photons perspective time does not exist but that from our perspective light travel through space or seem to travel through space and that takes time. However, for us space and time are separate things. If you combine them and measure space-time intervals instead you get a more complete picture. In 3D space you get the distance between two points by adding the differences between the coordinates using Pythagoras theorem, s^{2}=x^{2}+y^{2}+z^{2}. (x, y, and z, are differences in the coordinates) As long as you are consistent with the units you will always get the same distance regardless of position and orientation of your coordinate system. You can read more here.
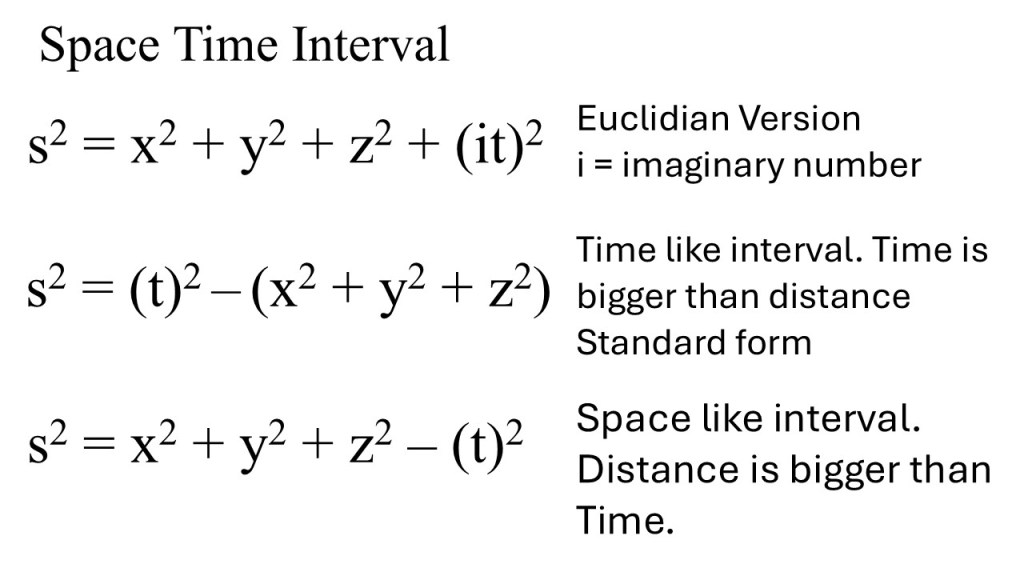
If you add time to Pythagoras theorem you will get the space-time interval, which interestingly enough is the same for all observers. There is no time dilation or length contraction in the interval. s^{2}=x^{2}+y^{2}+z^{2}+(it)^{2} As you might suspect, intervals involving light travelling from one event to another will always be zero for all observers, and not just from the photons perspective. And again, the same applies to all massless particles. Below are the Pythagoras formulas for different versions of the interval. In the top picture it is assumed that the conversion factor c = 299,792,458 meters per second has already been baked into to the time variable and in the bottom it has not. This is not any stranger than converting feet to meters.
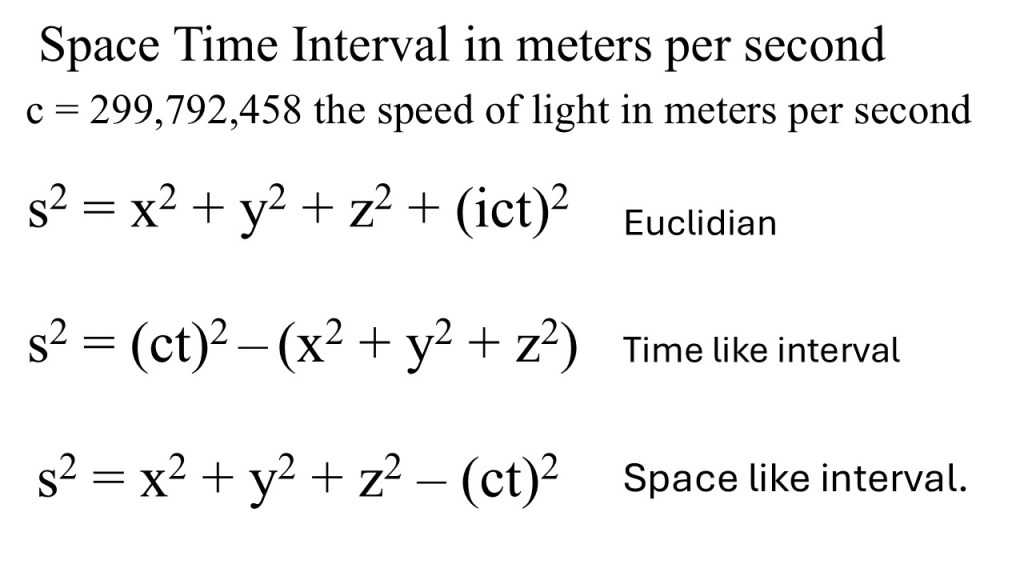
The three formulas for the spacetime interval above all assume that the unit used for time is the time it takes light in vacuum to travel the distance unit used. If that is meters, it would be the time it takes light to travel one meter. The top formula is the Euclidian form of spacetime. It contains only the ‘+’ operator at the expense of adding the imaginary number (square root of -1) in front of the time coordinate. The second form is typically used with time like intervals and considered the standard form. The third form is used when the distance between two events is larger than the time distance, or distance like intervals.If you measure the space coordinates in meters and the time in seconds you must adjust the units to match by inserting the speed of light in vacuum c = 299,792,458. The three forms of the space interval now have the constant c attached to the time coordinate.
What about the speed of light in water ?
It is well known that the speed of light in transparent materials such as water and glass is slower than the speed of light in vacuum. The speed of light it water is about 75% of the speed in vacuum and about 70% or less in glass (depending of the type of glass) compared to the speed in vacuum. In some materials the speed of light can be much less than that. This seems to violate what I said above about the speed of light always moving at c = 299,792,458 meters per second for all observers regardless of their speed.
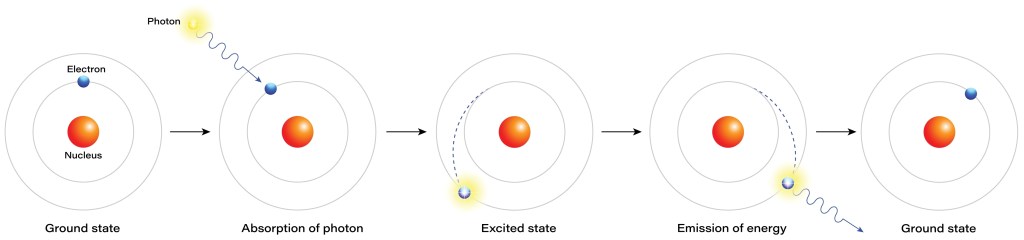
What is going on is that when light moves through matter it is being absorbed and emitted as it “travels” between the atoms in the material, and this absorption and emittance process takes time. This time is extremely short but long enough to be measurable. As the photons move in between the atoms they travel at the “speed” c = 299,792,458 meters per second, the time to space conversion factor I’ve been talking about. See the illustration below.
From ground state to excited state, absorption and emission of a photon in an atom. Shutterstock asset id: 2180385419 by rktz.
More about the mass of a Photon
I’ve said photons have no mass. According to Einstein’s theory of special relativity, time does not pass (or effectively “exist”) from the perspective of a massless particle. However, this is the intrinsic mass or so called proper mass or invariant mass. It is the mass of an object as measured by an observer who is completely at rest relative to it. This intrinsic mass is the mass that a photon does not have.
The mass of an electron is 511 Kilo Electron Volts, which is 0.0000000000000000000000000009109 grams. That is the intrinsic mass of the electron. If an electron is sped up to close the speed of light its mass increases and goes toward infinity. If its speed is very close to the speed of light its mass could be much bigger than that of the entire Universe. That’s because as you are increasing the speed of the electron, you are increasing its kinetic energy and as you increase the total energy of the electron you also increase its total mass according to E = mc2.
As the electron’s speed approaches the speed of light the kinetic energy goes toward infinity. That is one reason why it is impossible to travel at exactly the speed of light for anything but massless particles. Infinite energy and infinite mass are not realistic. We, the objects that have mass, can move closer and closer to light speed but never get there.
However, the intrinsic mass for photons is zero and therefore the photon is travelling at exactly the speed of light, c = 299,792,458 meters per second. E = mc2 still applies to light but the mass is not the intrinsic mass, which is zero, but the total mass, and the total mass can pretty much take on any number.
What about Warp Drives ?
So, nothing with mass can travel at the speed of light, and nothing can exceed it. What about the warp drive in Star Trek? As I said, the speed of light is not really a speed but the conversion factor between time and space. It is a geometric fact of space-time. That is a pretty difficult reality to get around, just like it is pretty difficult to push Earth out of its orbit by pushing on the floor. However, there is a way to cheat and that is to stretch space-time itself. This is theoretically possible, but it requires colossal amounts of mass-energy and enormous amounts of negative energy. We don’t even know if negative energy exists on a macroscopic scale.
So, no one knows if a warp drive is possible, and if it isn’t, then we are stuck moving slower than the speed of light, which would make interstellar travel very difficult and inconvenient.
Richard Feyman’s Lecture on Why Light Is NOT Moving Through Space?
The YouTube video below is very long, 48 minutes. However, Richard Feyman, Nobel prize winner in physics, has a knack for explaining extremely abstract concepts so that they are easy to understand. If you are very interested in this topic and have some extra time, this is a fascinating lecture. He certainly explains this topic better than I can.
Please visit this Smorgasbord Blog Magazine post, which is sharing my post Accents are very difficult to lose, as well as showcasing my Leonberger dog book.
Flag of Sweden in sunny rays high on the flagpole. Shutterstock asset id: 2344367957 by GenOMart.The flag of the United States of America Shutterstock asset id: 2566207745 by Ashley Grise.Flag of France. Shutterstock asset id: 2457252007 by Kyrylash Stanislav.
Super fact 111 : Russel’s Paradox is a logical contradiction discovered in 1901 that showed that the mathematical discipline of “Set Theory” was fundamentally flawed. Mathematicians had naively assumed that any definable property can be used to form a collection (or set) of items, but that is not true. An example of the Paradox is “A male barber shaves all men who do not shave themselves and only men who do not shave themselves. Does he shave himself?” Both “yes” and “no” are impossible answers. That is an example of an impossible set. Set theory needed an exclusion of such impossible sets.
Bearded client visiting barber shop. Shutterstock asset id: asset id: 1821348236 by Body Stock.
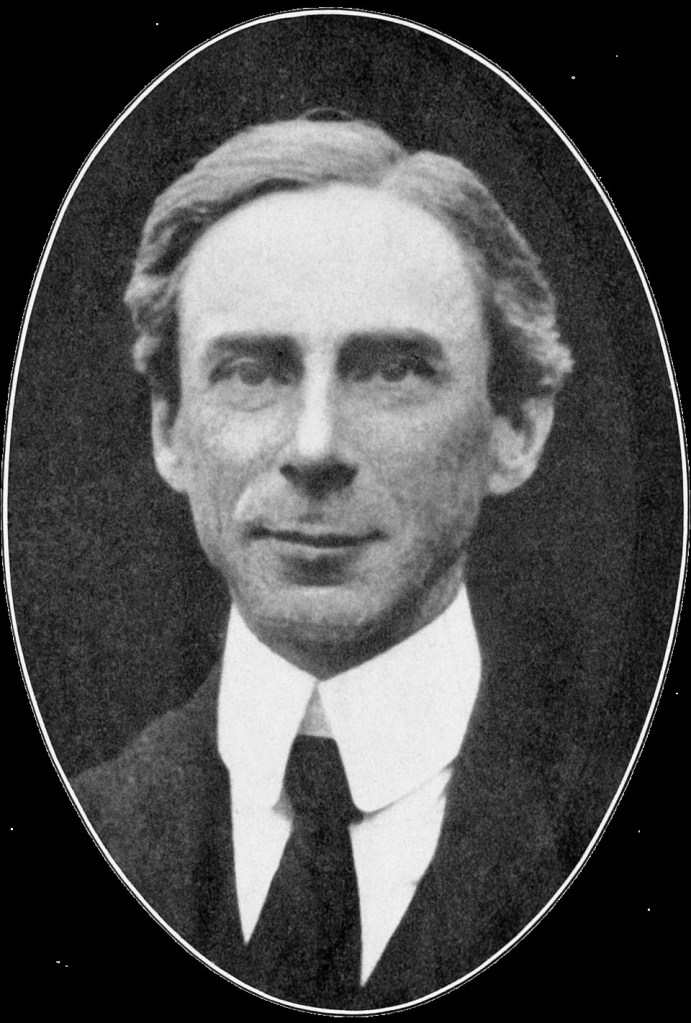
Russell’s paradox is a famous logical contradiction discovered by the philosopher and mathematician Bertrand Russell in 1901. To solve the contradiction, you need to remove the assumption that any property can form a set. In other words, not every set is possible. Basically, self-reference cannot be allowed.
To take the example above “A male barber who shaves all men who do not shave themselves and only men who do not shave themselves.” Is something that cannot exist. If the barber shaves himself then he is shaving someone who shaves himself, which was not allowed. If the barber does not shave himself, then he is not shaving all the men who do not shave themselves. Either way, it does not work. Such a barber cannot exist. In general, you cannot define a set anyway you like.
I consider this a super fact because it shows that contractions can be hidden even in mathematical disciplines, and it is important because you certainly don’t want contradictions hidden in a mathematical or scientific discipline. Contradictions lead to more contradictions and lots of problems.
Bertrand Russell portrait. Honourable Bertrand Russell.jpg: Photographer not identifiedderivative work: Conquistador, Public domain, via Wikimedia Commons
A Crazy Barber Story Involving Our Children
This happened soon after the September 11 attacks in 2001. In addition to planes crashing into buildings, there were attempts at biological warfare by spreading anthrax through the postal service. This is something we paid special attention to at my work because we were making postal sorting machines. It is also the reason I do not like people who write addresses in cursive.
Anyway, my wife called me at work, and she was very upset because our daughter’s hair was falling out. She touched her hair and it just fell off. She did not know what could be causing her hair to suddenly fall out, but she thought that it might have been biological warfare. I told her to call our doctor who had the good sense of suggesting that perhaps the kids had been playing barbershop. As it turned out they had. Our son confessed to cutting off our daughter’s hair. He had realized that this was bad, so he tried to put her hair back as well as he could. Afterwards, she was walking around with loose hair on top and that’s when my wife found her.
Our son is cutting his sisters hair. The picture is generated with the help of ChatGPT.
The goal of this blog is to create a list of what I call super facts. Super facts are important true facts that nevertheless are surprising to many, misunderstood, or disputed among the non-experts. They are special facts that we all can learn something important from. However, I also make posts that are not super facts but feature other interesting information, such as this book review and book recommendation. I should say that this book is not written by a scientist but an environmentalist, and he did not provide references for his hundreds of factual claims. However, I fact checked at least 20 claims and found only one that was not entirely correct, so I think his facts are for the part correct. The book is:
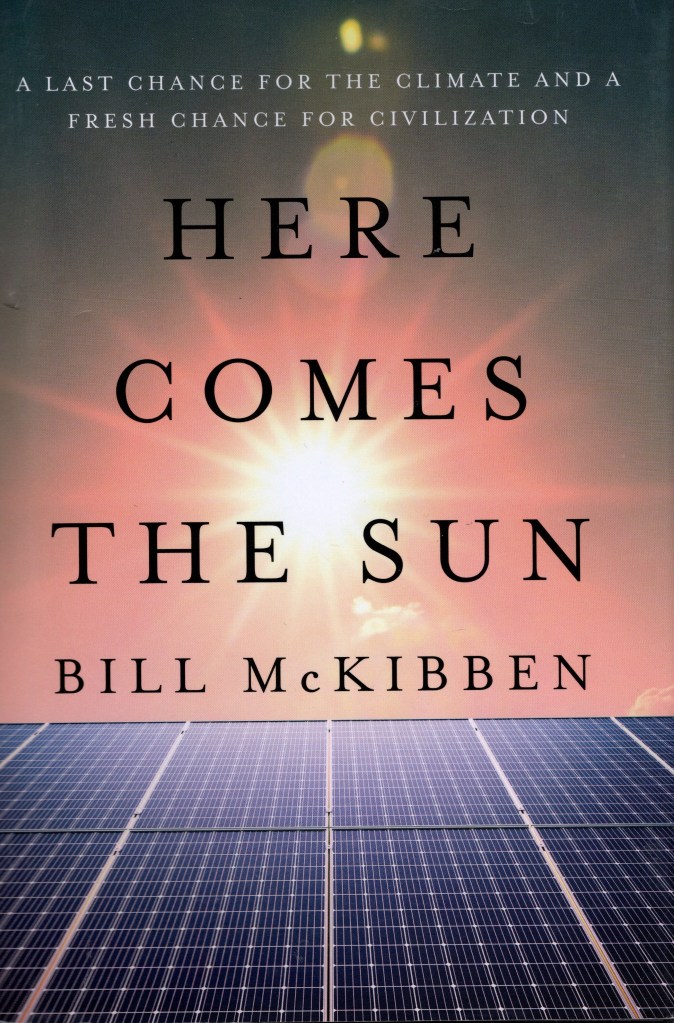
Here Comes the Sun: A Last Chance for the Climate and a Fresh Chance for Civilization by Bill McKibben
Below I am listing the four versions of this book. I bought the hardback version.
Hardback – Publisher : W. W. Norton & Company (August 19, 2025), ISBN-10 : 1324106239, ISBN-13 : 978-1324106234, 224 pages, item weight : 12 ounces, dimensions : 5.8 x 0.9 x 8.6 inches. It costs $15.91on US Amazon. Click here to order it from Amazon.com.
Paperback – Publisher : W. W. Norton & Company (August 11, 2026), ISBN-10 : 1324130628, ISBN-13 : 978-1324130628, 240 pages, item weight : 13 ounces, dimensions : 1 x 5.5 x 8.25 inches. It costs $19.99 on US Amazon. Click here to order it from Amazon.com.
Kindle – Publisher : W. W. Norton & Company (August 19, 2025), ASIN : B0DXQGBM4Z, 220 pages, it costs $9.40 on US Amazon. Click here to order it from Amazon.com.
Audiobook – Publisher : Highbridge Audio (August 19, 2025), ASIN : B0F95QL1C2, Listening length : 7 hours and 36 minutes. $0.00 with membership. Click here to order it from Amazon.com.
The front cover of Here Comes the Sun: A Last Chance for the Climate and a Fresh Chance for Civilization by Bill McKibben. Click on the image to go to the Amazon page for the hardback version of the book.
Amazon’s Description of the Book
From the acclaimed environmentalist, a call to harness the power of the sun and rewrite our scientific, economic, and political future.
Our climate, and our democracy, are melting down. But Bill McKibben, one of the first to sound the alarm about the climate crisis, insists the moment is also full of possibility. Energy from the sun and wind is suddenly the cheapest power on the planet and growing faster than any energy source in history―if we can keep accelerating the pace, we have a chance.
Here Comes the Sun tells the story of the sudden spike in power from the sun and wind―and the desperate fight of the fossil fuel industry and their politicians to hold this new power at bay. From the everyday citizens who installed solar panels equal to a third of Pakistan’s electric grid in a year to the world’s sixth-largest economy―California―nearly halving its use of natural gas in the last two years, Bill McKibben traces the arrival of plentiful, inexpensive solar energy. And he shows how solar power is more than just a path out of the climate crisis: it is a chance to reorder the world on saner and more humane grounds. You can’t hoard solar energy or hold it in reserves―it’s available to all.
There’s no guarantee we can make this change in time, but there is a hope―in McKibben’s eyes, our best hope for a new civilization: one that looks up to the sun, every day, as the star that fuels our world.
Here comes the sun tells the story of the spectacular success of renewables around the world, especially the success of solar power and wind power, with a special emphasis on solar power. The success of renewables was one reason that the IPCC will likely retire the RCP8.5 emissions scenario. The RCP8.5 emissions scenario, which was the extremely bad emissions scenario, was never very likely to begin with, but the fact that the world, including China, is turning away from coal and fossil fuels made this scenario implausible as they stated. I am not sure whether Bill McKibben could have predicted this when he wrote this book, but I think this recent event makes this book very relevant now in 2026.
The book describes a very interesting situation for our world and contains interesting personal anecdotes and is written in a positive and optimistic way. However, I was delighted that the book was full of interesting facts, for example, in 2024 92.5% of all new electricity bought online around the world came from renewables. Other facts are, Chinese emissions are dropping. He tells us that forty percent of the world’s ship traffic consists of moving coal and gas back and forth across the ocean to be burned. He states that the entire continent of Africa has barely produced 3% of the greenhouse gases warming the atmosphere, whilst they are likely to bear the brunt of the effects of global warming.
Other interesting facts are; Chinese citizens can expect to live on average 2.2 years longer than they would have a decade ago, due to the sharp drop in pollution (thanks to renewables and EVs). Dealing with cleantech waste is a small problem compared to fossil fuels, and we have enough minerals, especially considering recycling. He tells us about various physics facts related to the sun, how our health is effected by the sun, the history of the day “Sunday”, sun worship in the ancient world, and other sun related facts.
He reviews the history of fossil fuels and renewables, particularly solar power, and the how the fossil fuel industry and certain politicians are fighting against renewables with disinformation and bad faith arguments. He explains the problems with fossil fuels and the dangers they pose, which is not just limited to climate change. He also explains a little bit about why we know that fossil fuels are causing global warming / climate change, why we need to keep pushing for renewables despite their success. He states that because fossil fuels themselves are easy to concentrate, they often yield authoritarian outcomes.
In the past renewables were an expensive alternative and fossil fuels cheap, but that situation has been reversed. He explains why EVs are in general cleaner and better for the environment than cars with internal combustion engines. He explains how we get around the intermittence issue with wind and solar and that batteries are getting much cheaper and environmentally friendlier, and why a lot of negative information you hear about batteries is not true anymore. Salt batteries is an example of an emerging technology.
My only concern with the book is that Bill McKibben is not a scientist. He is an activist. Because of that it is extra important that he provides references to reputable sources for all his claims. Typically, scientists provide references to their claims even though you in general can trust scientists more than activists. However, Bill McKibben provided no references to any of his several hundred facts and claims, except for some general and vague information in the back about where he got his information from.
I should say that I fact checked about two dozen of his claims and found only one that was not entirely accurate, so overall I trust this book. The book is easy, lighthearted and positive reading. It is not a heavy science book, the book was well organized, and he is a good author. Therefore, I highly recommend this book.
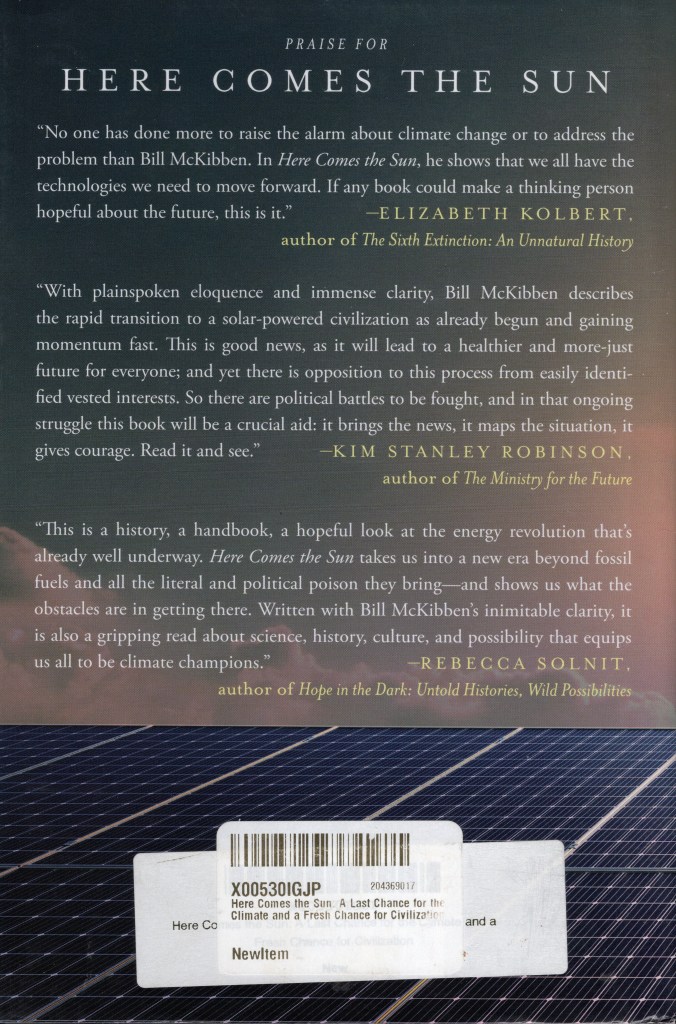
The back cover of Here Comes the Sun: A Last Chance for the Climate and a Fresh Chance for Civilization by Bill McKibben. Click on the image to go to the Amazon page for the paperback version of the book.