
Robbie Cheadle posted my guest post on Scandinavian Folklore on LatinosUSA a wonderful online magazine/blog featuring poetry, stories and all kinds of interesting content from around the world. She also included a wonderful review of my Leonberger book Le Life and Times of Le Bronco von der Löwenhöhle.
Author: thomasstigwikman
My name is Thomas Wikman. I am a software/robotics engineer with a background in physics. I am currently retired. I took early retirement. I am a dog lover, and especially a Leonberger lover, a home brewer, craft beer enthusiast, I’m learning French, and I am an avid reader. I live in Dallas, Texas, but I am originally from Sweden. I am married to Claudia, and we have three children. I have two blogs. The first feature the crazy adventures of our Leonberger Le Bronco von der Löwenhöhle as well as information on Leonbergers. The second blog, superfactful, feature information and facts I think are very interesting. With this blog I would like to create a list of facts that are accepted as true among the experts of the field and yet disputed amongst the public or highly surprising. These facts are special and in lieu of a better word I call them super-facts.
Landman Lies
Super fact 77 : The TV series Landman portrays several falsehoods about clean energy. Since these claims are mostly unchallenged, appear to be information, and are also very easy to look up and debunk, they are deliberate lies.
“Lies” may be a strong word but if you make a very one sided presentation and you don’t fact check your claims even though that would take less than 30 seconds to do, especially since you are a large company with lots of resources, then you are clearly intentionally deceiving your audience, which is lying. I consider the claim above (in bold) a super fact because it is true, and it is important because it is a popular series and based on the reaction the Landman series has deceived a lot of people.
I got the idea for this super fact yesterday as we were watching a few episodes of Landman. Since I know a little bit about this topic the misinformation was obvious to me. The Landman series is fiction but the way the information was presented made it appear as facts. It appeared as if it was trying to teach us something rather than being the delusional rants of an oilman.
In addition, the misinformation is not minor. It consists of big bold whoppers. Imagine a movie promoting us taking Greenland from Denmark claiming that the Danes attacked Pearl Harbor, acquired a nuclear bomb, and used chemical weapons on Los Angeles. Whatever your opinion on the Greenland situation is, these big whoppers would likely make it harder for you to watch the movie, at least if you know some history. If most people’s knowledge of history was so bad that they’d believe it, then it would also create problems. There is a lot of confusion and misinformation regarding clean energy, and it is a poorly understood topic, so telling big lies does damage.

It may come as a surprise to many that Paramount plus would deliberately mislead their audience. However, clean energy, climate science, evolution, vaccines, and any science that is inconvenient to some people have been undermined by false information for quite a while. It is just more of it than usual right now. That the executive branch is at war with clean energy might have something to do with it.
Misleading information about clean energy is often spread on social media via fake memes, non-reputable sources, comments by people who do not know what they are talking about, conspiracy theories, small groups of contrarian agenda driven scientists making youTube videos with false information, bots, deep fakes, etc., but now it has also shown up in a major Hollywood Production.
It is more important than ever to be skeptical of claims you hear, especially if they seem to support your own political, ideological, religious, or philosophical views, because that’s how you get bamboozled. Questioning other people’s views does not require much effort. I speak from experience. Intentionally seek the truth not confirmation of your belief. Verify all claims before you take them seriously. Be a realist.
Truth: Windpower and Solar are Much Cleaner than Fossil Fuels
The false claim in the series is that “there is nothing clean about clean energy, that renewables require too much fossil fuel to build to be considered clean.” I am using the true statement as the title of this section because our memories often mix up the false and true statements as time goes by, so highlighting the true statement helps.
Manufacturing, transporting, and building infrastructure for wind power currently involve fossil fuels and so do fossil fuel plants. However, this is only an initial stage. Once wind and solar facilities are built, they generate power without direct emissions, unlike fossil fuel plants which continue to burn fuel and emit CO2 during their entire operational lives. For example, the lifetime emissions of gas-powered generation are estimated to be around 20 to 40 times higher than those of renewables. You can read more here or here.
Truth: Wind turbines typically offset their carbon footprint within a year
The demonstrably false claim is that “wind turbines do not offset their carbon footprint within their lifespan.” According to energy researchers, for example, the National Renewable Energy Laboratory, a wind turbine typically offsets the carbon emissions from its manufacturing, transport, and installation within six months to one year of operation. In other words, wind turbines offset their carbon footprint quickly. The average lifespan of a wind turbine is over 25 years.
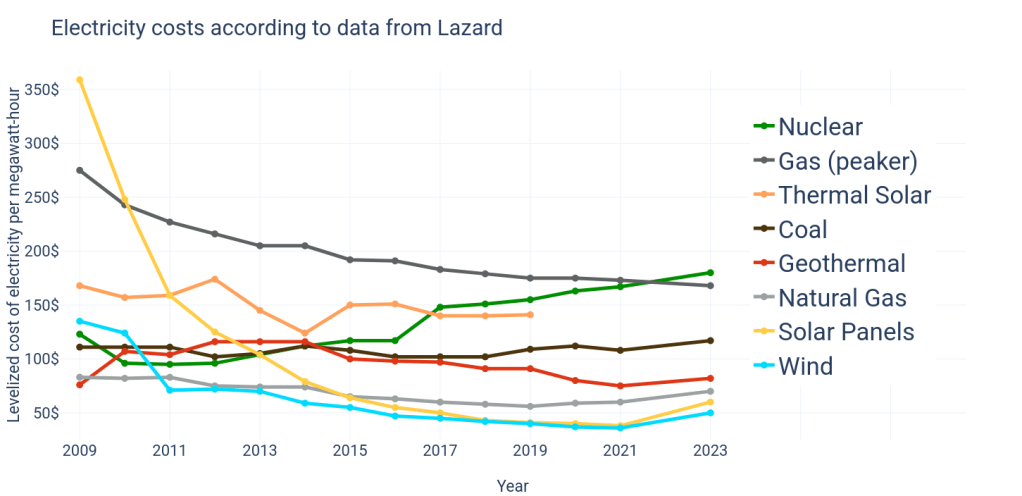
Truth: Solar and Wind Are Cheaper than Gas, Coal and Nuclear
The false claim in Landman is that “solar and wind energy are significantly more expensive than natural gas.” While wind and solar can have higher upfront installation costs, their operational costs are very low as they do not require fuel. Therefore, they can provide electricity very cheaply, making them competitive with and often cheaper than natural gas over their full lifespan.
However, all energy sources are subsidized, and fossil fuels have a long history of government subsidies. Below is the average unsubsidized levelized cost of energy in the United States according to Lazard. Levelized means that construction costs, land rent, and other costs not directly caused by electricity generation are taken into consideration. Notice how cheap wind is (blue line). This is for the United States not just Texas. I don’t have any numbers, but I’ve heard that for Texas solar is the cheapest .
The free market based Texas (my state) grid ERCOT provides an excellent example of how wind and solar effectively compete with other energy sources. ERCOT provides a minute by minute update for the fuel mix percentages. This is a fun website.
Truth: Fossil Fuels are Worse for the Environment than lithium batteries and solar panels
The false claim in Landman is that “Lithium batteries and solar panels are worse for the environment than fossil fuels.” Solar panels typically offset the emissions from their production and installation within 1 to 4 years. Battery technology is continuously improving, and current systems are highly recyclable (90-95%). While the mining of materials like lithium has environmental impacts, the overall lifetime emissions of renewables and associated storage systems are vastly lower than those of fossil fuels.
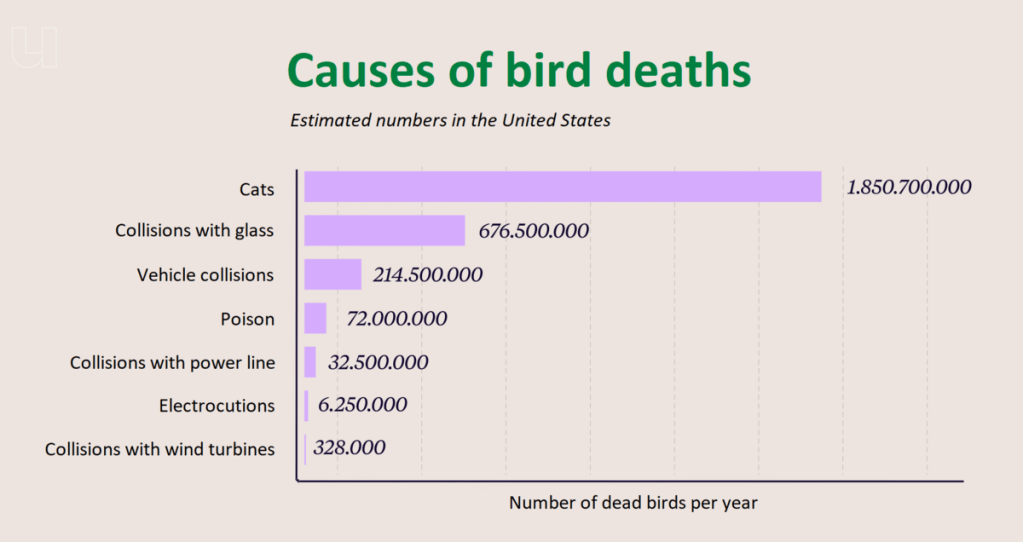
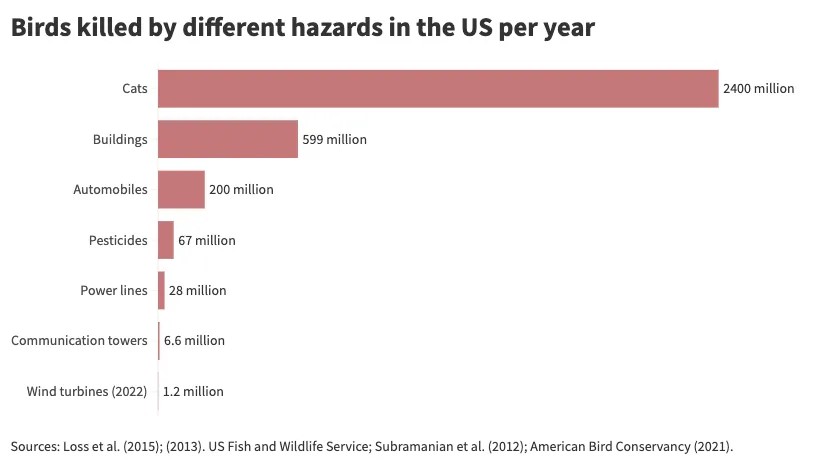
Truth: Fossil fuels kill a lot more birds than Wind Power per Giga Watt
Tommy Norris (played by Billy Bob Thornton) implies in a rant that “Wind turbines are a major ecological disaster for birds, disrupting patterns and causing mass deaths.” While wind turbines kill some birds it is minor compared to the impacts of the oil and gas industry or other common human activities. This study estimates that wind farms and nuclear power stations are responsible each for between 0.3 and 0.4 fatalities per gigawatt-hour (GWh) of electricity while fossil-fueled power stations are responsible for about 5.2 fatalities per GWh. These articles from MIT provide additional information and reiterate that fossil fuels are lot more deadly to birds than wind power stations. You can read more on this topic here, here, here or here.
Truth: There is no evidence that Offshore Wind Kills Whales
The false claim in Landman is that “offshore wind development, including site characterization surveys, is responsible for a spike in whale deaths”. The primary cause of human-caused threats to large whales are vessel strikes and entanglement in fishing gear but not offshore wind. According to NOAA there are no known links between large whale deaths and ongoing offshore wind activities. You can read more on this topic here, here, or here.
To see the other Super Facts click here
Ten Selected 2025 Super Facts
I started this blog, superfactful, in August of 2024. The goal of my blog is to create a list of facts that are important, not trivia, and that are known to be true yet surprising, shocking or disputed by large segments of the public. I determine what is true by evaluating the evidence I find in reliable reputable sources and if a longstanding scientific consensus is available that certainly helps. In some cases, I have expertise in the subject myself, which also helps. Whether a fact is important and surprising or disputed is a judgment call. In some cases, there are polls to help me determine how surprising or disputed the fact is. I am trying to avoid trivia and click bait, and I am only focusing on what is true, important and mindboggling.
It is a project I hope to learn a lot from, and I hope others will also learn something from reading it. We are all drowning in misinformation, false beliefs and unsubstantiated assumptions. We often know and understand less than we think. I have been bamboozled in the past and I am pretty sure you have too. If this blog can spread a little bit of light, I am happy.
In 2024 I posted 25 super facts and in 2025 I posted 53. I am hoping to one day to have collected 200 super facts. I have also made 64 other kinds of posts on this blog such as book reviews for educational books as well as other fact related posts. Below are ten selected super facts from 2025. To read the full post click the links.
That Earth is round was well known long before Columbus
Super fact 28: That Earth is round, or spherical (or closely spherical) had been known for at least a couple of thousand years by the time Columbus set sail. Columbus did not set sail to prove that earth was round, and he knew it was round.
I’ve realized that this comes as a surprise to some. To read the post click here.

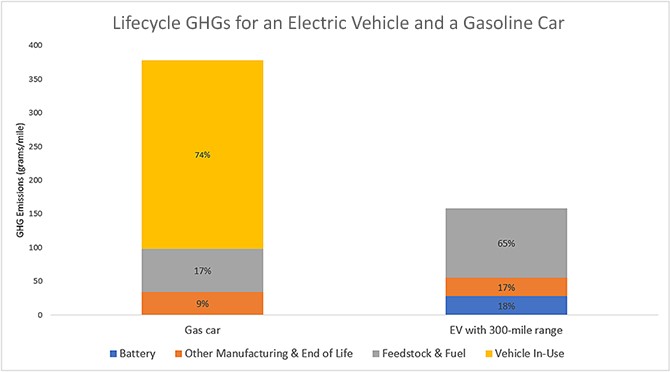
EV Cars Indeed Emit Less Carbon Pollution
Super fact 29: EV Cars emit less pollution than Internal Combustion Engine, even considering manufacturing, disposal and EV Cars being charged by dirty grids.
There is a lot of misinformation about EVs including that EVs are not better for the environment. To read the post click here.
Scientists Agree that Global Warming is happening and that we are the Cause
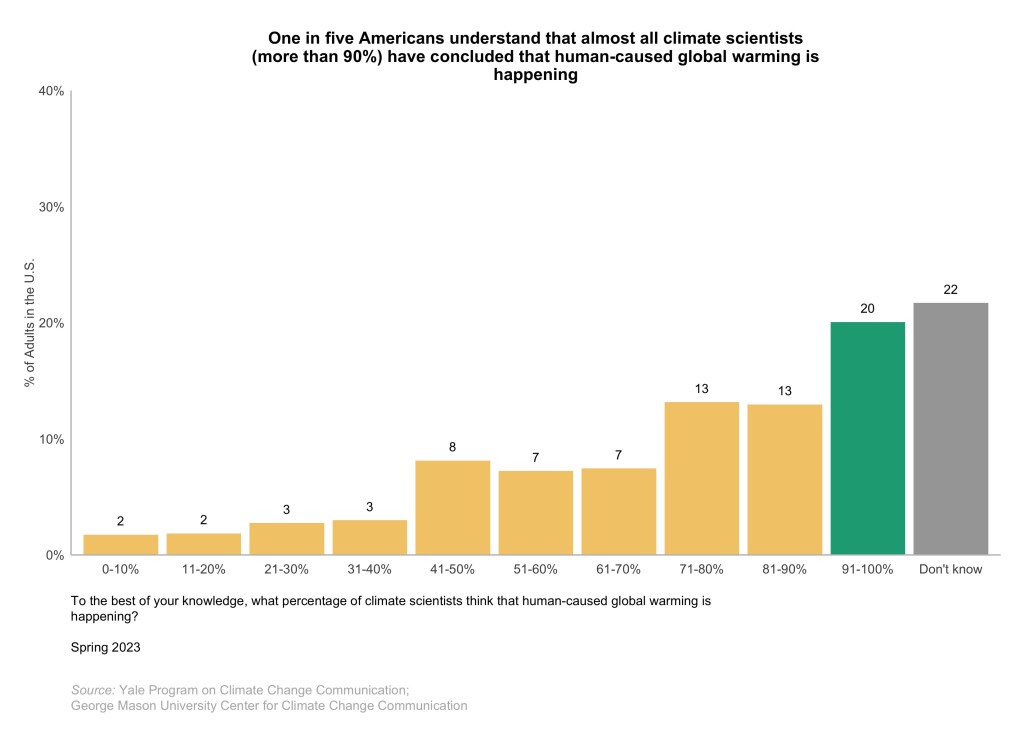
Super fact 34: Climate Scientists agree that Global Warming or if you call it Climate Change is happening, and that it is caused by us primarily because of our burning of fossil fuels. There is a long-standing scientific consensus on these two facts because the evidence is conclusive. Typically, studies show an agreement of at least 97% or 98% among climate scientists.
Polls show that most American are unaware of the consensus among climate scientists. To read the post click here.
There is almost total agreement among climate scientists that global warming, or climate change, is happening and is caused by us. To understand why, you need to know a little bit about the impressive evidence, which for all practical purposes is conclusive. Take a look at this post “Global Warming is Happening and is Caused by us”
Time Dilation Goes Both Ways
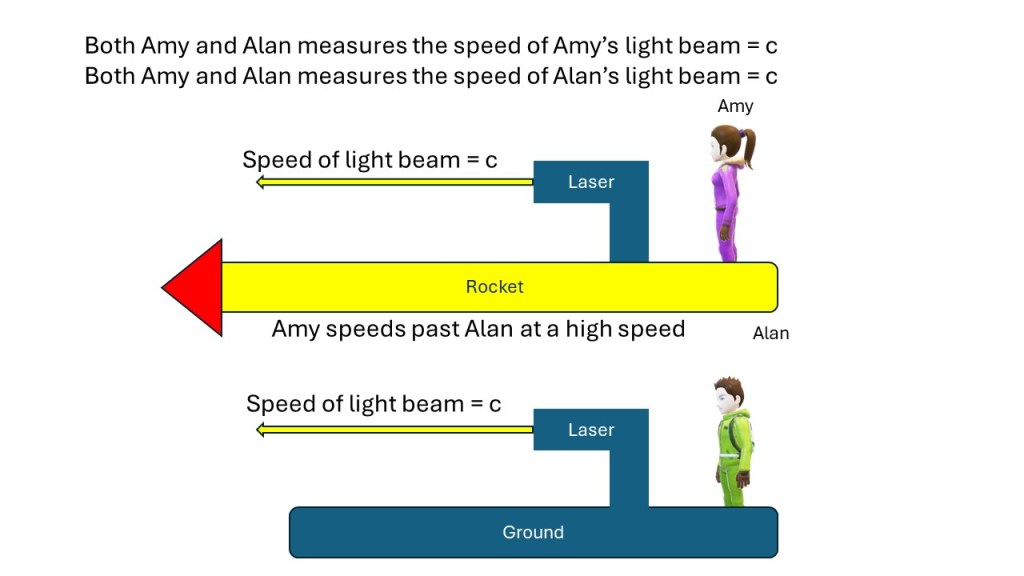
Super fact 38 : If two observers are moving compared to each other both will observe the other’s time as being slower. In other words, both observers will observe the other’s clocks as ticking slower. Time slowing down is referred to as Time Dilation.
Clocks slow down as you travel at high speeds. However, the person travelling think they are standing still. It is the other person who is travelling. This is confusing. To understand it click here.
Emissions of ozone-depleting gases have fallen by 99 Percent
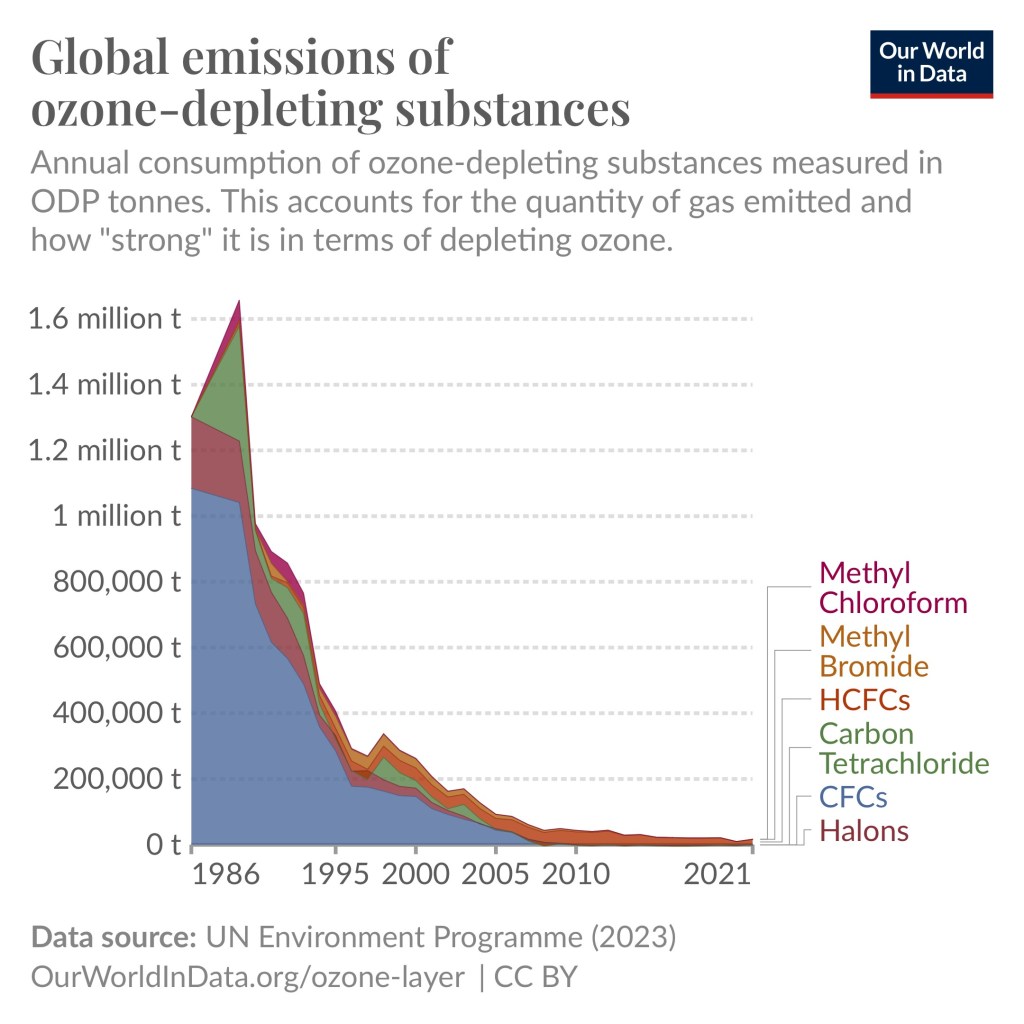
Super fact 41 : Largely thanks to the Montreal Protocol in 1987 the emissions of ozone-depleting gases have fallen by more than 99%, 99.7% to be exact, according to Our World in Data. This has resulted in halting the expansion of the ozone holes and the reduction in emissions of ozone-depleting gases is saving millions of lives every year.
A gigantic victory for the environment that few are aware of. To read the post click here.
Sulfur dioxide pollution has fallen by 95 percent in the US
Super fact 44 : Sulfur dioxide pollution in the US has fallen by approximately 95% since the 1970s. This significant reduction is primarily due to regulations like the Clean Air Act. Global sulfur dioxide pollution has also fallen but not as much.
Another big victory for the environment that we seldom hear of. To read the post click here.
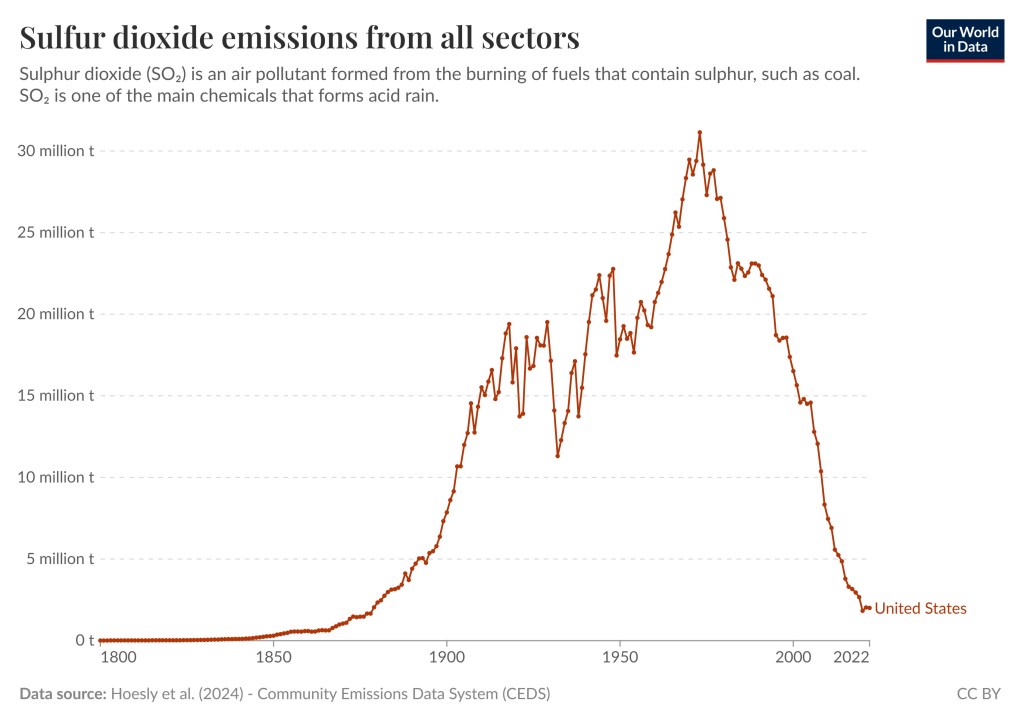
I should mention that by clicking this link you can visit the graph above Our World in Data and select different countries and regions and play around with the settings.
We Exploded Thousands of Nuclear Bombs
Super fact 48 : Since 1945 we have set off more than 2,000 Nuclear Bombs corresponding to a yield of an estimated 42,000 times that of the Hiroshima Bomb.
That we have exploded these many nuclear bombs was a surprise to me and perhaps to you too. To read the post click here.

The Euler Number Math Magic
Super fact 53 : The Euler number denoted e, is an irrational number, which like the number pi is extremely important in mathematics. In addition, the relationship between the Euler number and pi; seemingly unrelated numbers, is quite amazing, especially if you throw the imaginary number: i = square root of -1 into the mix. Euler’s formula e^ix = cos(x) + isin(x), where x is degrees expressed in radians, is mind blowing to say the least. Radians means that 180 degrees is replaced by pi, and 90 degrees is replaced by pi/2, etc. A simpler special case, but equally amazing is Euler’s identity e^ix = -1, or e^ix + 1 =0. This is amazing math assuming you understand it.
One of the most amazing math facts explained. To read the post click here.
The Bermuda Triangle the Big Non-Mystery
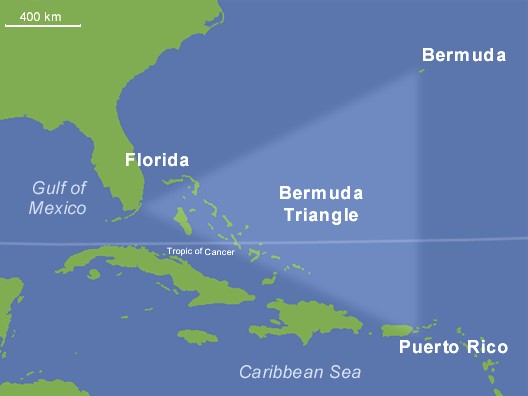
Super fact 56 : The Bermuda Triangle mystery is a myth. There is not a higher risk of disappearances in the Bermuda Triangle. To be specific, disappearances do not occur in the so-called Bermuda Triangle, or Devils Triangle, with any higher frequency than in other comparable regions of the ocean. The “mystery” of the Bermuda Triangle is largely a manufactured one, perpetuated by sensationalized accounts that often misrepresent the facts and downplay the role of natural hazards like storms.
A surprise to the people who are convinced that there really is a mystery. To read the post click here.
Evolution is a Fact
Super fact 63 : Evolution is both a fact and a scientific theory. It is a fact that life has changed over time. This is supported by overwhelming evidence, while the theory of evolution provides a comprehensive scientific explanation for these changes, using processes like natural selection.
Yes, there are scientific facts, and that evolution is happening is an observed scientific fact. To read the post click here.

Happy New Year to You All
To see the other Super Facts click here
US National Debt is Ballooning
Super fact 76 : The current US national debt is a record 38.35 trillion dollars and growing despite it being peacetime and no recession. The expected GDP for 2025 is 30.6 trillion, which corresponds to a debt to GDP Ratio of 125 percent.

The federal government needs to borrow money to pay its bills when its ongoing spending activities and investments cannot be funded by federal revenues alone. That the national debt is growing in terms of dollars may not be shocking. There is inflation, the country is growing, and as the economy grows its ability to pay the debt increases. Therefore, the debt to GDP Ratio is a better measurement of the size of the problem as this metric relates to our ability to pay the debt back. When the debt to GDP Ratio is growing there is a real problem.
Wars and recessions tend to add to the federal debt. While debt spikes during crises, it historically receded after. The second World War is an example (see below). However, since 1980 US debt has grown without seeming to come back down. Not only does the current debt to GDP Ratio exceed the one after the Second World War, the current trends show persistent deficits even in peacetime, unlike post-WWII, making the long-term outlook scary.
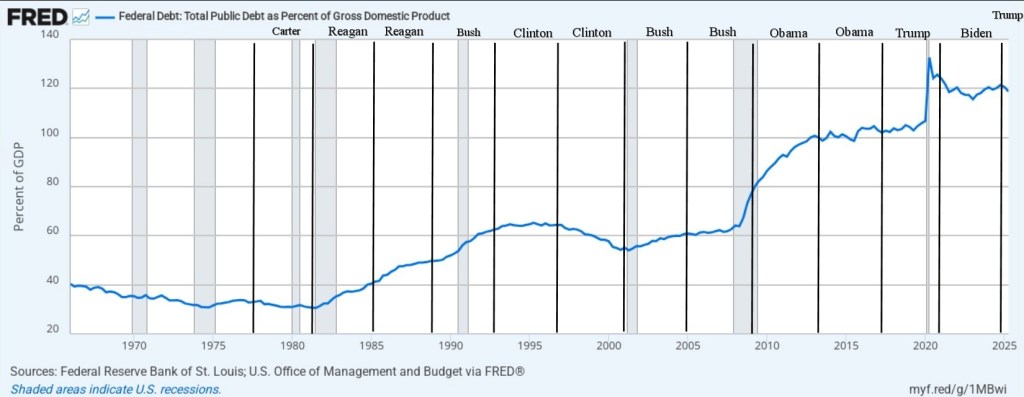
Below is an overview of the Federal Debt as percent of the GDP starting with 1965 to the beginning of 2025. The graph does not include most of the more than 2 trillion increases in debt during 2025, including a 1 trillion increase that happened in just two months toward the end of the year. So at the end there is a missing uptick. The graph below comes from this website.

In the past we used to discuss the national debt and the national deficit a lot, and it was viewed as an important and urgent problem to solve. It was a matter of intergenerational justice. There are some big problems that we have largely solved, for example, the sulfur dioxide pollution that created acid rain has fallen by 95 percent in the US, and the emissions of ozone-depleting gases have fallen by 99 Percent. As a result, we have mostly stopped talking about those problems. However, as the problem with national debt has grown, we have not increased but decreased our attention to the problem. The fact that the debt is now more than 38 trillion dollars, or $112,000 per person in US, and keeps rising despite no wars or recessions happening is probably a shock to many. It is true, it is an important fact, and it is surprising and perhaps shocking and therefore it is a super fact. To read more about the national debt click here.
Debt to GDP Presidents
One might be curious as to how the debt changed during specific Presidencies. I took the graph above and inserted lines representing the starting and ending years for the most recent Presidents. For example, Joe Biden’s Presidency started January 20, 2021, and ended January 20, 2025. I might not have gotten it exactly right so don’t read too much into it.
Below is a table I found online.
| President | Years in Office | Debt-to-GDP at Start | Debt-to-GDP at End | Change (Percentage Points) |
| Franklin D. Roosevelt | 1933–1945 | ~20% | ~112.9% | +92.9 (WWII/Depression) |
| Harry S. Truman | 1945–1953 | 112.9% | ~67.1% | -45.8 |
| Dwight D. Eisenhower | 1953–1961 | ~67.1% | ~55.2% | -11.9 |
| Lyndon B. Johnson | 1963–1969 | ~46.9% | ~38.6% | -8.3 |
| Jimmy Carter | 1977–1981 | ~35.8% | ~32.5% | -3.3 |
| Ronald Reagan | 1981–1989 | ~32.5% | ~53.1% | +20.6 |
| George H.W. Bush | 1989–1993 | ~53.1% | ~66.1% | +13.0 |
| Bill Clinton | 1993–2001 | ~66.1% | ~56.4% | -9.7 |
| George W. Bush | 2001–2009 | ~56.4% | ~84.2% | +27.8 (Wars/Recession) |
| Barack Obama | 2009–2017 | ~84.2% | ~103.6% | +19.4 (Great Recession aftermath) |
| Donald Trump | 2017–2021 | ~103.6% | ~132.8% (peak in Q2 2020) | +29.2 (Pandemic relief/tax cuts) |
| Joe Biden | 2021–Present | ~132.8% (at start of term, Q2 2020 peak) | ~124.3% (as of 2024) | Fluctuation/slight decrease due to GDP recovery/inflation |
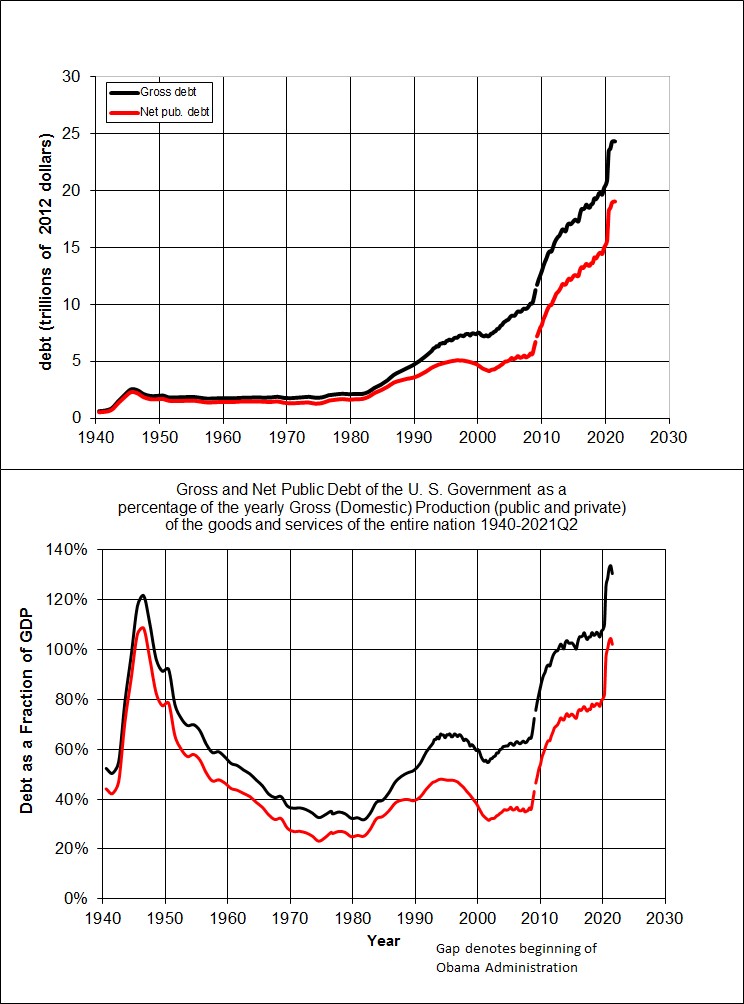
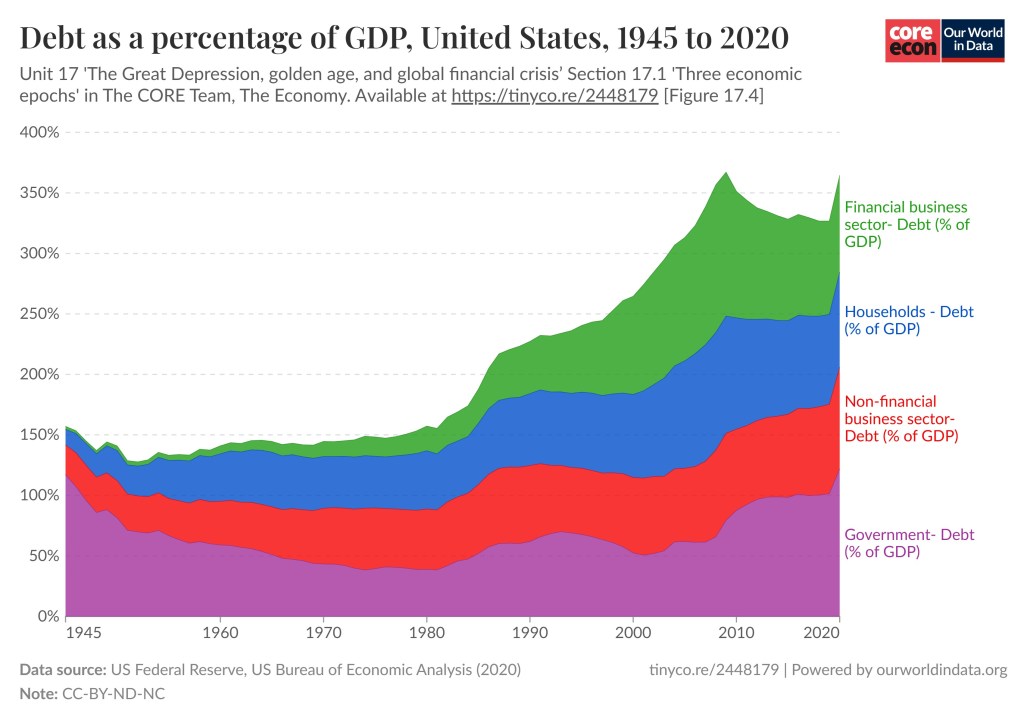
Other Types of Debt
I should add that there are other types of debt not just federal debt / national debt (gross and net). American companies and financial institutions owe money and consumers have debt. As you can see in the graph below the debt to GDP ratio increase is true for those kinds of debts as well. We are a nation in debt. To read more about the graph below click here.
To see the other Super Facts click here
Magnetars Super Magnets in the Sky
Super fact 75 : Magnetars are a type of neutron star with extremely powerful magnetic fields ranging from 10,000,000,000,000 Gauss to 1,000,000,000,000,000 Gauss. In comparison, Earth’s magnetic field varied from about 0.25 to 0.65 Gauss at the surface. In other words, the magnetar magnetic fields are from 20 or 40 Trillion times to 2 or 4 Quadrillion times stronger than Earth’s magnetic field at the surface.

The magnetic fields of magnetars are trillions of times stronger than the sun’s magnetic field, which is 1 Gauss on a quiet sun surface and 2,000 to 4,000 Gauss in sunspots. The magnetic field of an MRI’s machine is also incredibly strong (2,000 Gauss to 100,000 Gauss). It is thousands to over a hundred thousand times stronger than Earth’s magnetic field. That’s why you should not have metals around an MRI machine. However, the magnetic field of a magnetar is still hundreds of millions to tens of billions of times stronger than the magnetic field of an MRI machine, and the magnetic field is not confined to a small machine but surrounds a neutron star and stretches far out into space.
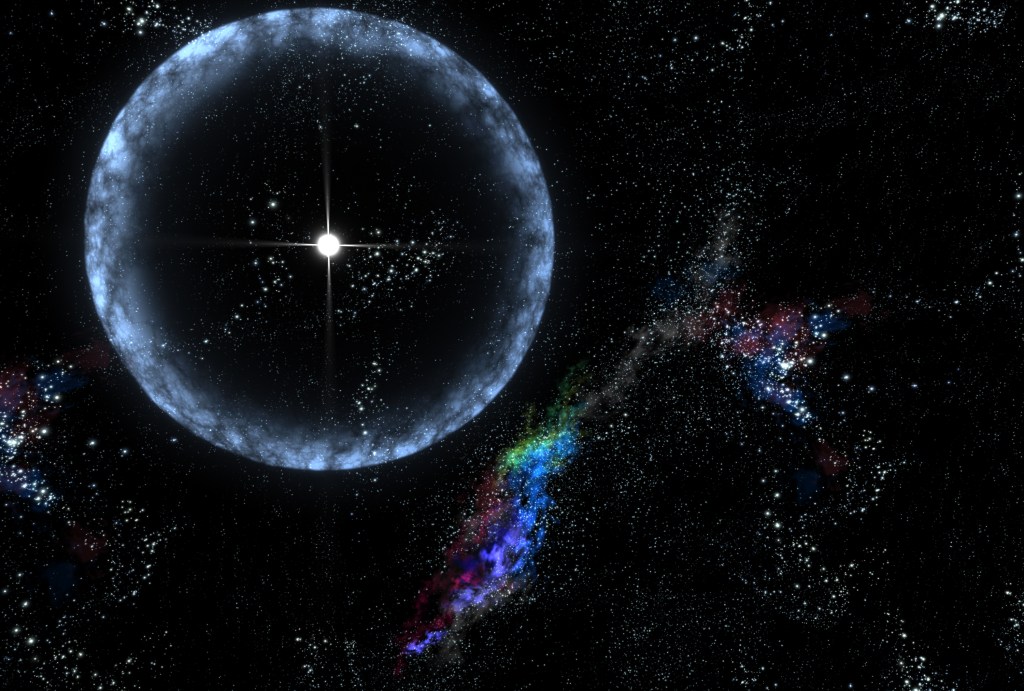
If you placed a magnetar halfway to the moon from Earth (a magnetar is around 12 miles in diameter), it would erase all the credit cards on Earth (see video below). If you get close to a Magnetar (1000 kilometers) cars and other metal would float up in the air and the atoms in yourbody would stretch into rods making organic chemistry impossible and kill you. If you placed a steel beam on the surface of a magnetar the magnetic field would pulverize it and destroy the atoms.
In 2004 a magnetar named SGR 1806-20 located 50,000 light years from our solar system (700 million times farther than the planet Jupiter) had a starquake disturbing the magnetic field and sending out a gamma burst that disrupted radio communication on Earth. I consider the existence of magnetars a super fact because the existence of these super magnetic monsters is shocking and not well known amongst the public, and yet their existence has been confirmed.
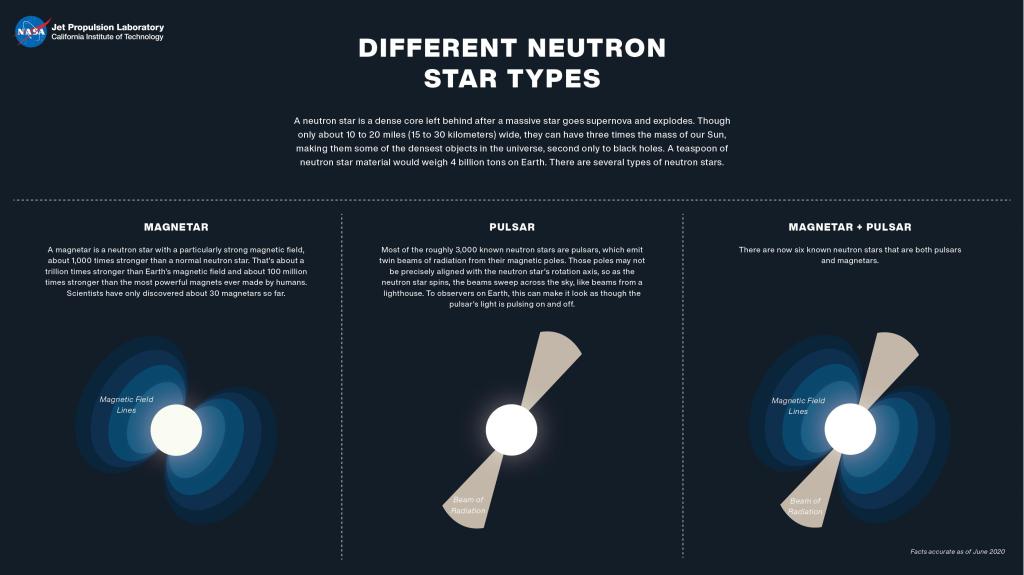
What Are Neutron Stars and Magnetars?
A neutron star is the gravitationally collapsed core of a massive supergiant star. The collapse causes it to become super compact and relatively small by volume. As the name implies the atoms are crushed, and protons and electrons merge into neutrons, making the neutron star mostly neutrons. The typical diameter of a neutron star ranges from 10 to 25 km (6 to 15 miles) depending on its mass. Neutron star material is extremely dense.
A normal-sized matchbox containing neutron-star material would have a weight of approximately 3 billion tons, the same weight as a 0.5-cubic-kilometer chunk of the Earth (a cube with edges of about 800 meters) from Earth’s surface, or a very large mountain. In addition, the gravity on a neutron star is immense, about 100 billion to 200 billion times stronger than Earth’s gravity.
Magnetars are neutron stars with extremely powerful magnetic fields. They have the universe’s most powerful magnetic fields (trillions of times stronger than Earth’s) that power intense X-ray/gamma-ray bursts as its field decays, often seen as highly variable pulsars. They were first theorized in 1992 to explain Soft Gamma Repeaters (SGRs) and Anomalous X-ray Pulsars (AXPs). As of July 2021, 24 magnetars have been confirmed. According to the video below 30 magnetars have been confirmed in the Milky Way. There might be 3,000 in our Galaxy.
Magnetar YouTube Video
Other extreme stellar objects
- We are Star Dust
- The Bizarre Reality of Black Holes
- The Strange Worlds of Exoplanets
- The Enormous Kuiper belt
