The Sun is not the Cause of the current Global Warming

Superfact 124: The Sun is not the cause of current global warming. According to data from NASA, solar energy output has shown no net increase since the late 1970s. In addition, the amount of solar energy Earth receives has followed the Sun’s natural 11-year cycle of small ups and downs with no net increase. Over the same period, global temperature has risen significantly. The current warming is driven by human-made greenhouse gases, not changes in the Sun.
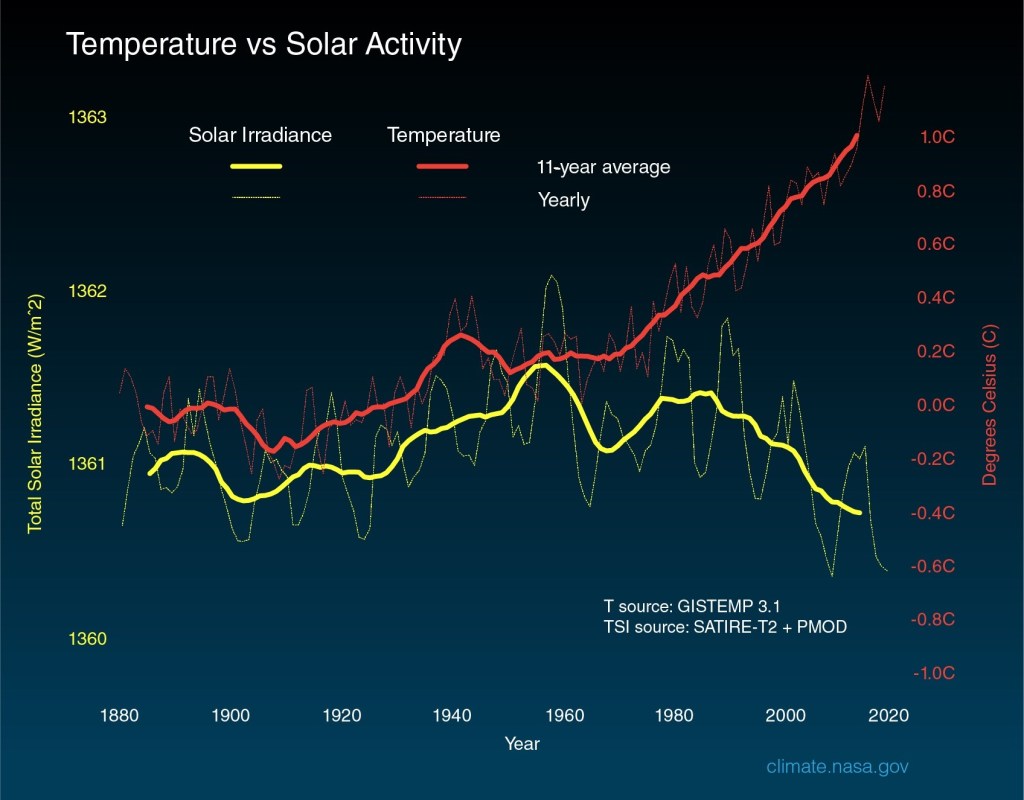
A thin yellow line graph (on black background) shows the sun’s irradiance fluctuating every 11 year. However, it does not go up overall, but it rather goes down even though the red line graph showing temperature rises sharply. | The Sun is not the Cause of the current Global Warming
Solar irradiance (yellow) plotted with temperature (red) since 1880. NASA, Public domain, via Wikimedia Commons.

The graph above compares global surface temperature changes (red line) and the Sun’s energy received by Earth (yellow line) in watts (units of energy) per square meter since 1880. The lighter/thinner lines show the yearly levels while the heavier/thicker lines show the 11-year average trends. Eleven-year averages are used to reduce the year-to-year natural noise in the data, making the underlying trends more obvious. You can read more about why the Sun is not the Cause of the current Global Warming, here or here or here.
The sun from space on a dark background. High quality photo.
Elements of this image furnished by NASA. Shutterstock asset id: 2454170413 by Artsiom P

The evidence that the current rapid global warming is chiefly caused by our burning of fossil fuels is extensive and for all practical purposes conclusive. Explaining why no known natural cause for climate change can explain the current warming is just one small piece of the evidence. However, it is one item that people tend to get stuck on. You often hear claims such as “climate has always changed”, “I think it is a natural cause, like the sun”, or “have you ever heard of orbital cycles?”.

Well, as one would expect, the scientists and the experts on past climate, and the scientific organizations around the world, have very carefully investigated whether natural causes could be behind the current rapid warming and we have known for many decades that the answer is no. It is not orbital cycles, it is not the sun, it is not volcanoes, etc. My first post in the series regarding why no known natural cause of climate change can explain the current warming was “Orbital Cycles are not the Cause of the current Global Warming”. This post is about why it can’t be Sun.
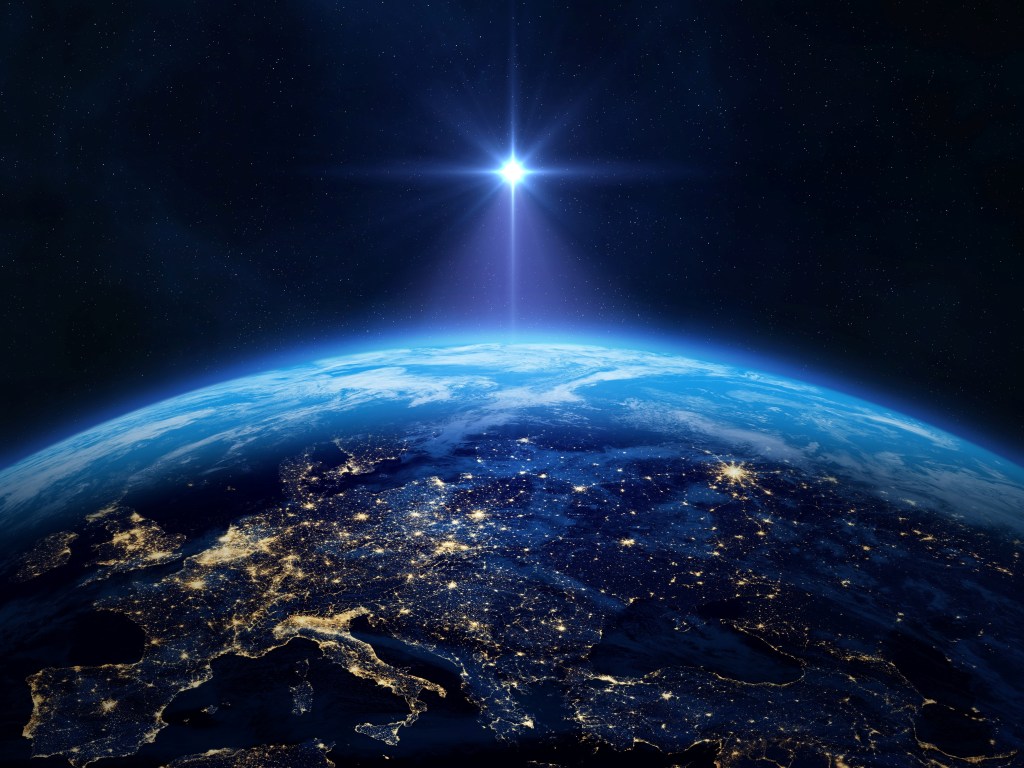
The picture shows a bright shining down on planet Earth lighting up the planet a bit. The light from the sun is intense. | The Sun is not the Cause of the current Global Warming
Sun shining down on Earth. Shutterstock asset id: 2709145593 by buradaki

One reason we know that it can’t be orbital cycles causing the current rapid global warming is that orbital cycles operate over tens of thousands of years or hundreds of thousands of years. That is not true for the sun, which has much faster fluctuations. However, it is true for both orbital cycles and the sun that they are not increasing the heat Earth receives. In fact, the effects of Orbital Cycles are slowly cooling Earth, not warming it, and the sun’s energy output has not shown any net increase.

In addition, if the current global warming was the sun or orbital cycles then the upper atmosphere would be warming just like the lower atmosphere, but the upper atmosphere is not warming, it is cooling. That’s an effect that is similar to a blanket holding heat in, which would happen if greenhouse gases were warming the Earth. Add to that the fact that the distribution of temperature increases in time and space matches the way greenhouse gases warm the Earth but does not match the way the sun or orbital cycles would warm the Earth.
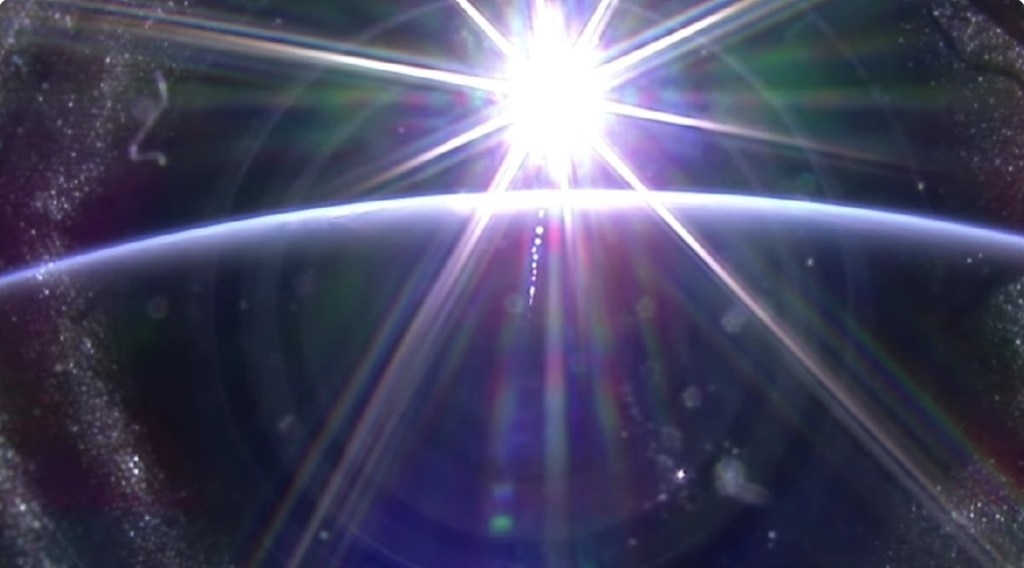
A bright white sun is setting over Earth
Sunset from the International Space Station by NASA

I am considering this a super fact because a lot of people have been fooled by disinformation to believe that natural causes are the likely explanation. About 15-20 years ago, I was bamboozled by the disinformation myself. Since this is an important topic and this fact is likely surprising or even challenging to many people, it is a super fact in my opinion.

Understanding a topic and understanding the evidence makes all the difference. Something I had to relearn. That is also why climate scientists are near unanimous around the world over that climate change / global warming is both real and caused by us.

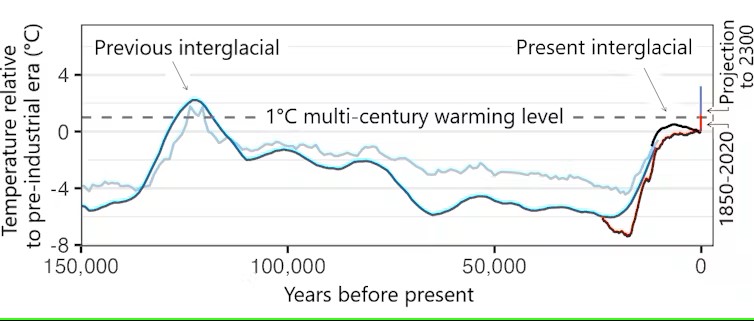
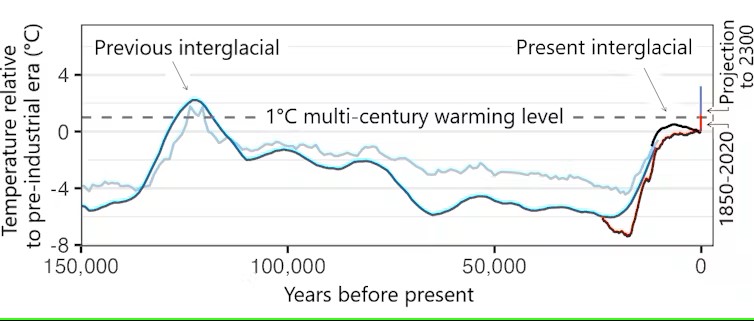
Past Climate the last 150,000 Years
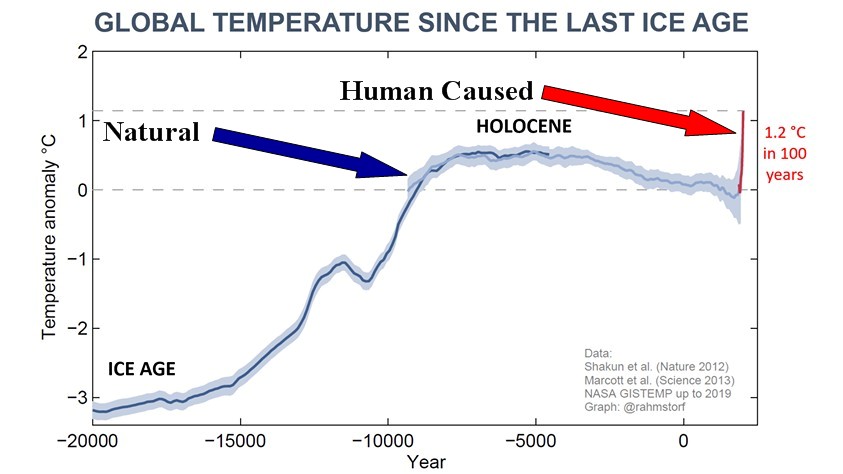
The graph shows the temperature since the last ice age. There is a maximum temperature about 6,000 years ago, then a cooling and then a sharp uptick in temperature.
This graph shows global temperature going back twenty thousand years. Notice the relatively stable temperature during the last 10,000 years, coinciding with the development of human civilization. Also notice the maximum temperature around 6,000 years ago. It is referred to as the Holocene climatic optimum. Finally, notice the sudden sharp increase in temperature at the end. It is depicted in red and is not natural.
The graph shows wild swings over the last 150,000 years and then a very sharp uptick at the end. | The Sun is not the Cause of the current Global Warming
Temperature record for the last 150,000 years. Again, notice the sharp uptick towards the end. This picture is taken from this article.

A Couple of Videos and Links

The video below is a short one-minute overview of the causes behind global warming.


The video below from NASA is a bit longer, 13 minutes, but it gives a more detailed overview. Click here to see the page from where this is coming from.


You can read some more about why it isn’t sun that is causing the current global warming here, and here, or here.

Conclusion

We know that the Sun is not responsible for the current rapid global warming because the Sun’s energy output has shown no net increase since the late 1970s. In addition, the amount of solar energy Earth receives has followed the Sun’s natural 11-year cycle of small ups and downs with no net increase.

We know that Sun is not responsible for the current rapid global warming because if it was the Sun the upper atmosphere would not be cooling and the temperature increases would be distributed differently across Earth and distributed differently with respect to time.

Other super facts related to global warming


To see the other Super Facts click here

Orbital Cycles are not the Cause of the current Global Warming
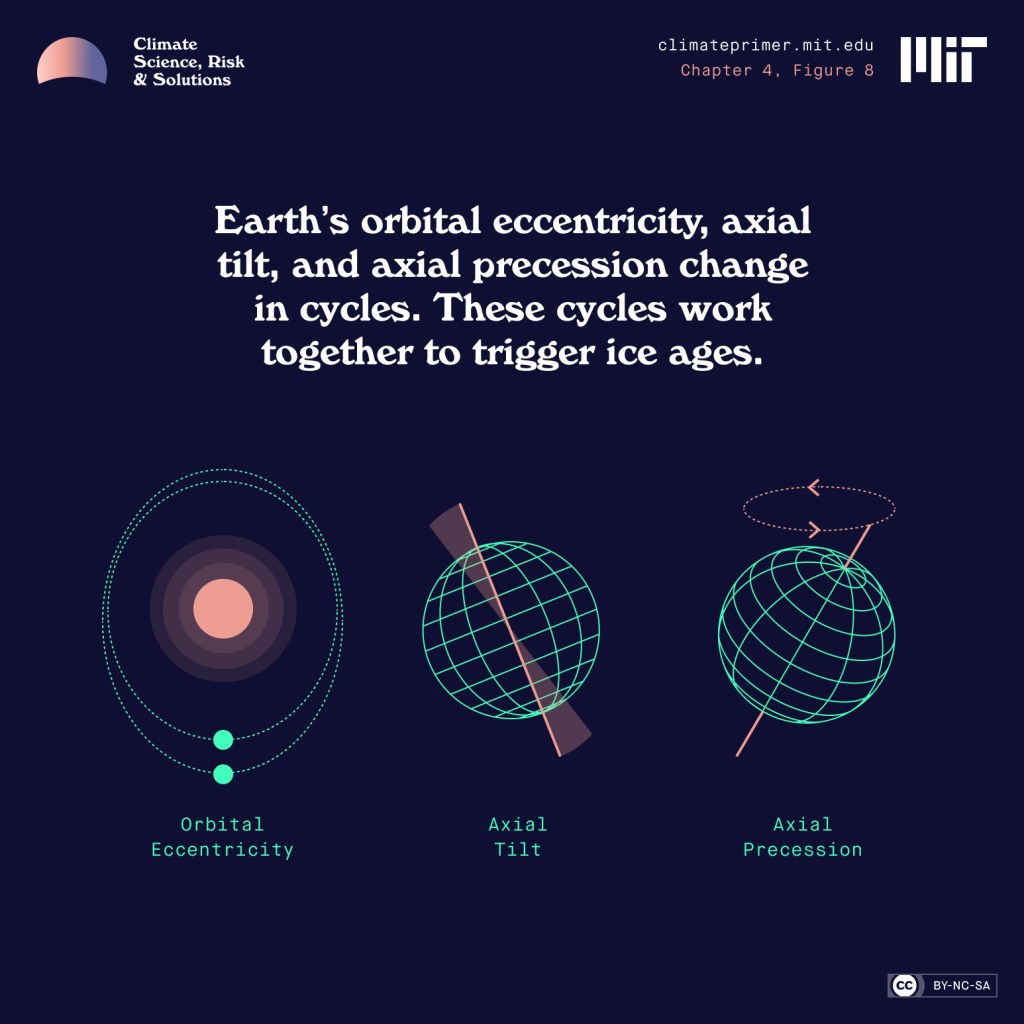
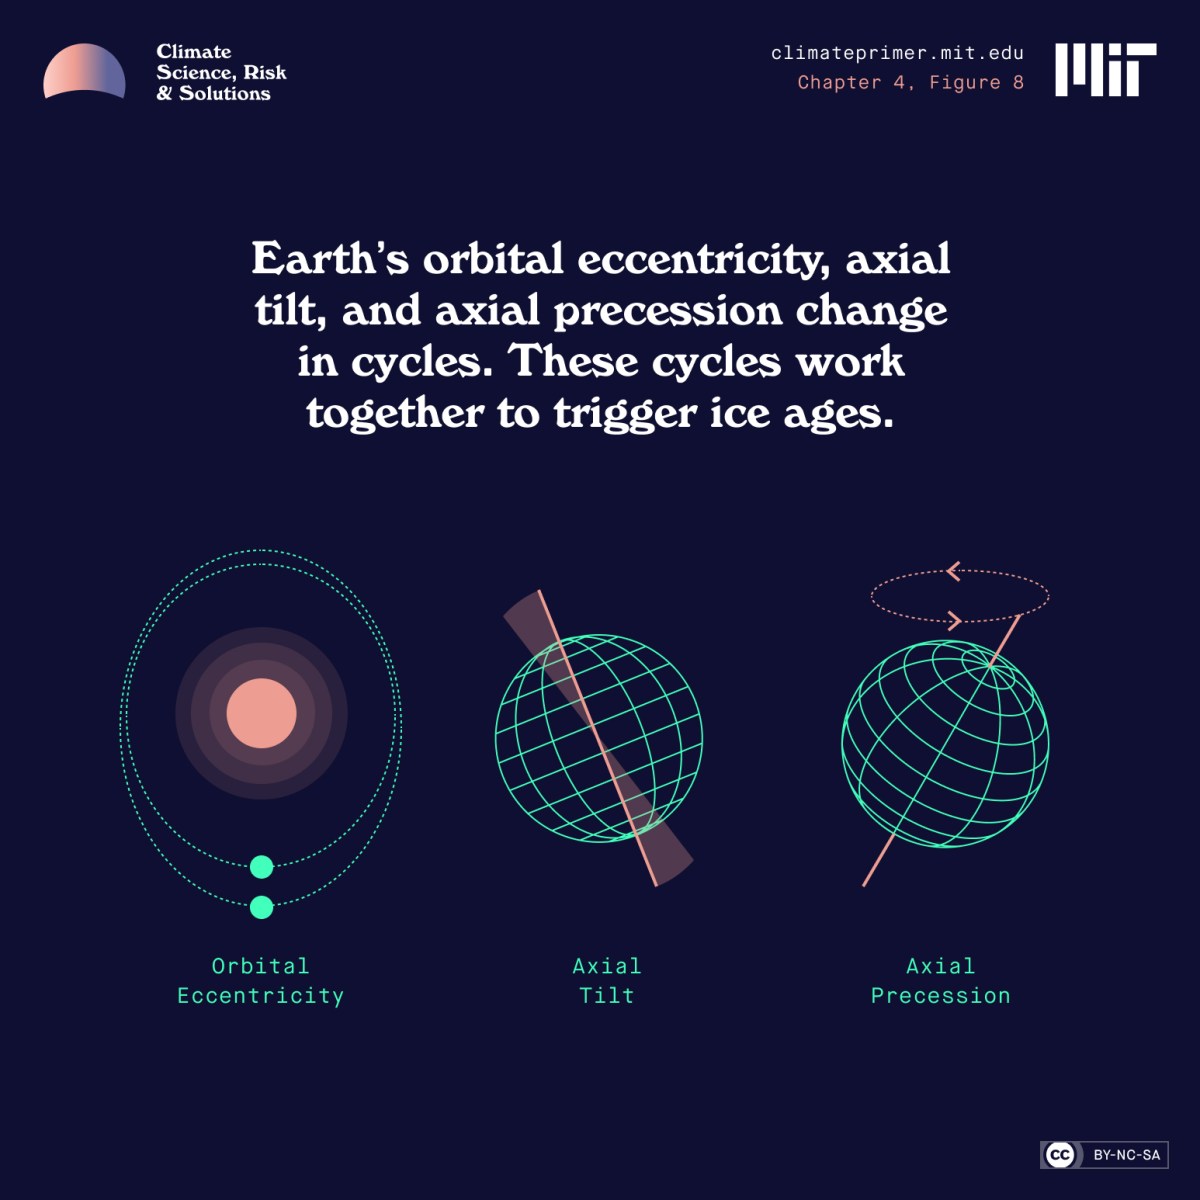
Superfact 122: We know that the current global warming, or if you call it Climate Change, or Climate Disruption, is caused by us primarily because of our burning of fossil fuels. It is not “natural causes”, and it is not orbital cycles, so called Milankovitch cycles. These orbital cycles include changes in orbital eccentricity, axial tilt, and axial precession.

Three illustrated orbital cycles. On the left orbital eccentricity, in the middle is the axial tilt and on the right axial precession. | Orbital Cycles are not the Cause of the current Global Warming
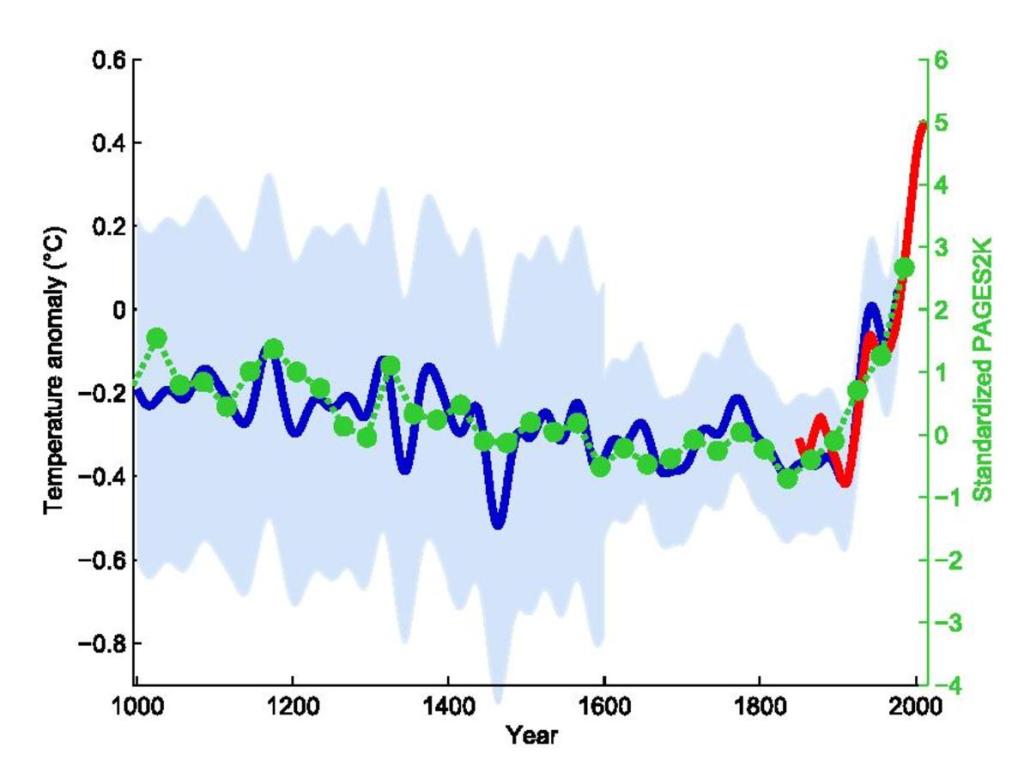
Illustration of Milankovitch cycles from MIT’s Climate Primer.

The evidence that the current rapid global warming is chiefly caused by our burning of fossil fuels is extensive and for all practical purposes conclusive. One of the steps towards understanding this evidence is understanding why no known natural cause of climate change can explain the current warming, and that includes orbital cycles. Therefore, this post is just one small step towards preparing you for the evidence that the current rapid global warming is chiefly caused by us. However, there is a lot of disinformation around this specific topic.

Hockey stick curve going back 1,000 years. The recent uptick in global temperature is very sharp and very sudden.
The so-called hockey stick curve depicting the last 1,000 years. The blue line is the first hockey stick curve ever created (by Michael Mann). He used proxy measurements such as tree rings, green-dots 30-year average, red temperature measurements. Wikimedia commons <<https://creativecommons.org/licenses/by-sa/4.0/deed.en>>. This graph is taken from this page.
Again, hockey stick curve going back 1,000 years. This time human causes and natural causes are indicated with a black respective a red shape. | Orbital Cycles are not the Cause of the current Global Warming
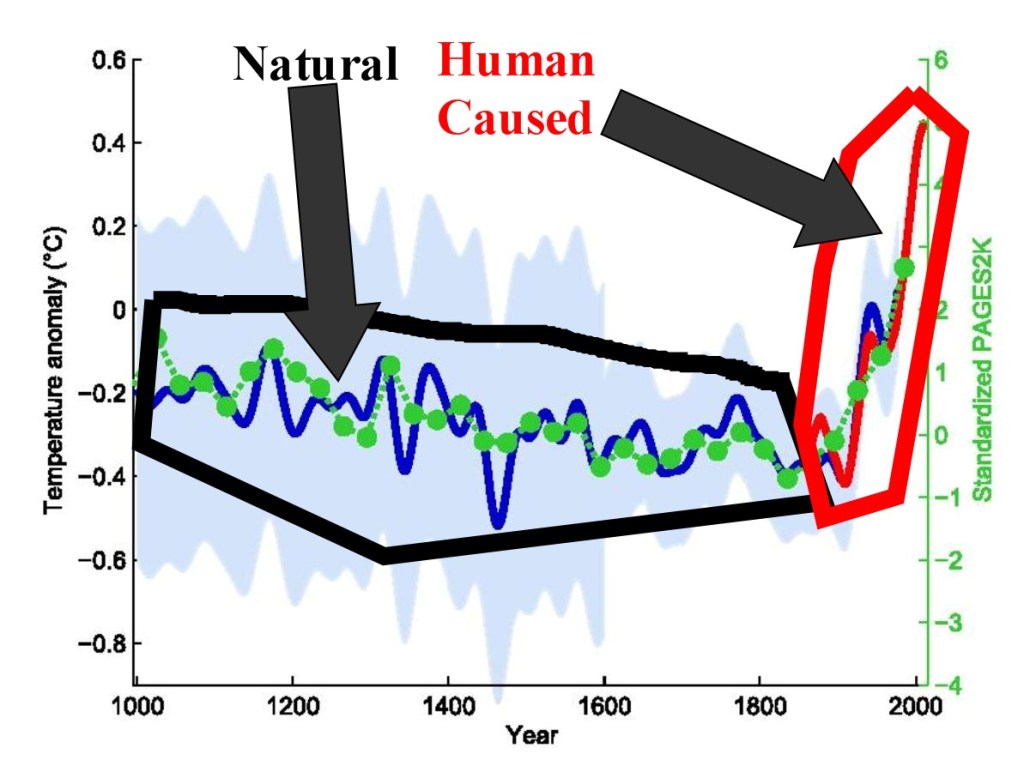
The so-called hockey stick curve depicting the last 1,000 years. In this graph I have indicated what part of the graph is climate change caused by natural causes respective climate change caused by human causes.

Very briefly; Earth’s orbital cycles, called the Milankovitch cycles are largely responsible for the ice ages, but they are not responsible for the current warming because the current warming is too rapid for the orbital cycles to be the cause, and the way the warming is happening is incompatible with how a warming caused by Milankovitch cycles would have happened. In addition, according to the Milankovitch cycles we should be cooling, not warming.

I am considering this a super fact because a lot of people have been fooled by the disinformation on this topic, and there is also a lot of gaslighting from less than reputable organizations and from politicians. They have bamboozled a lot of people. About 15 years ago, I was bamboozled by the disinformation myself. That was before I took the time to try to understand the topic. Understanding a topic, and understanding the evidence makes all the difference, and that is why climate scientists are near unanimous the world over that climate change / global warming is both real and caused by us.

Ask yourself, why would the climate scientists and the atmospheric physicists around the world, including scientists at NASA and NOAA, not investigate orbital cycles and other natural causes for climate change as a possible cause for our current warming? They are the experts on orbital cycles and past climate after all. We know that orbital cycles are not the cause of the current global warming, and this is important to know. Therefore, I think it is a super fact.

What Are Orbital Cycles?

One type of important type of climate forcing that’s been the cause behind the multiple ice ages that we’ve had over the last two million years are earth’s orbital cycles, or the Milankovitch cycles. There are primarily three orbital cycles, orbital eccentricity, change in axial tilt, and axial precession. Could they explain the current warming? No, they can’t because they are too slow, we are currently in a cycle that should be cooling the planet, and the way orbital cycles would warm the planet if they were responsible for the warming is very different from what we are witnessing.

Changes in Eccentricity

Earth’s orbit is not a perfect circle. Earth’s orbit varies from nearly circular to slightly elliptical and this change can cause climate change. This shift in Earth’s orbit takes place over periods of about 100,000 and 400,000 years. Click on the video from NASA below for an illustration of Earth’s eccentricity.

Changes in Obliquity (Tilt)

The angle Earth’s axis of rotation is tilted as it travels around the Sun is known as obliquity. Obliquity is why Earth has seasons. Over the last million years, it has varied between 22.1 and 24.5 degrees with respect to Earth’s orbital plane. The greater Earth’s axial tilt angle, the more extreme our seasons are. In addition, a larger tilt angle favor periods of deglaciation. The changes of Earth’s obliquity have a period of 41,000 years. Click on the video from NASA below for an illustration of the changes in obliquity.

Axial Precession (Wobble)

Earth wobbles slightly as it rotates, like a slightly off-center spinning top. The axis of Earth’s wobble changes slowly and is called axial precession. The corresponding cycle spans 25,771.5 years, or approximately 26,000 years. Click on the video from NASA below for an illustration of the changes in axial precession.

Video Explaining Earth’s Orbital Cycles

The video below from PBS gives an explanation and overview of earth’s three orbital cycles.


Orbital cycles are far too Slow to Cause the Rapid Global Warming Happening Today

The changes in Earth’s orbit and tilt operate over 20,000+ to 100,000-year periods, making Orbital Cycles unable to drive the sharp temperature spikes seen in a single century.

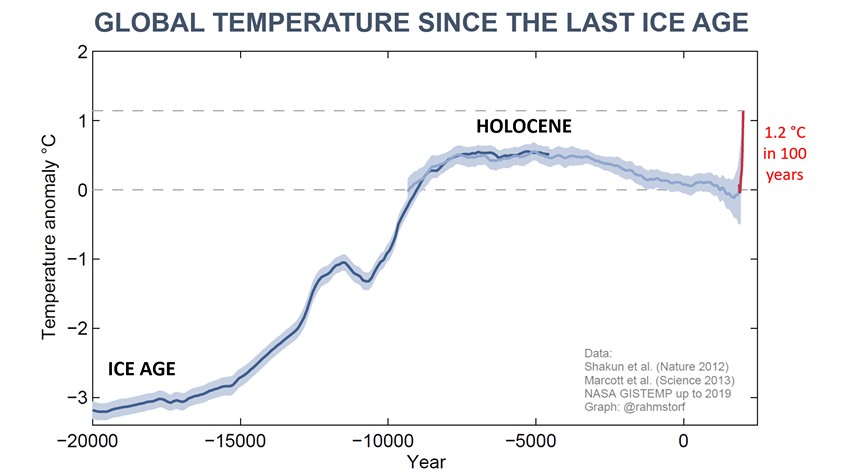
The graph shows the temperature since the last ice age. There is a maximum temperature about 6,000 years ago, then a cooling and then a sharp uptick in temperature.
Global temperature going back twenty thousand years, a hockey stick graph. Notice the stable temperature during the last 10,000 years, coinciding with the development of human civilization, and also notice the sudden sharp increase at the end. Orbital cycles can’t explain that, and it certainly does not look natural.

Orbital Cycles Predict Slow Cooling, not Rapid Heating

About 6,000 years ago Earth’s temperature was a bit warmer than it is today largely due to the climate fluctuations caused by orbital cycles. The warm period in the beginning of the Holocene epoch is referred to as the Holocene climatic optimum. Natural causes for climate change caused Earth’s temperature to slowly cool off until the recent very sudden uptick in average global temperatures.

Orbital Cycles are not the Cause of the current Global Warming
Temperature record for the last 150,000 years. Notice the sharp uptick towards the end. This picture is taken from this article.
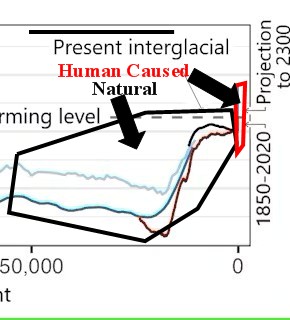
The graph shows wild swings over the last 50,000 years and then a very sharp uptick at the end, which as indicated in the graph is caused by us.
Temperature record for the last 50,000 years. Notice the sharp uptick towards the end. I have circled natural and human caused causes for the climate change. This picture is taken from this article.

Below is a video that explains in greater detail why orbital cycles cannot explain the current warming. You can also read more about it here.

The Cooling of the Upper Atmosphere Tells Us the Current Warming is not Caused by Orbital Cycles or the Sun

Yes, the cooling of the upper atmosphere (specifically the stratosphere above the troposphere) is a key sign that current global warming is not caused by Milankovitch cycles or changes in the sun. Instead, observations show a warming lower layer (troposphere) and a cooling upper layer, which is the exact “fingerprint” of human-caused greenhouse gases. Other evidence that the warming is caused by greenhouse gases and not orbital cycles or the sun is the distribution of the warming across the globe and over time.

A Couple of Videos

The video below is a short one-minute overview of the causes behind global warming.

The video below from NASA is a bit longer, 13 minutes, but it gives a more detailed overview. Click here to see the page from where this is coming from.


Conclusion

We know that Orbital Cycles are not responsible for the current rapid global warming because Orbital Cycles operate on tens of thousands of years or hundreds of thousands of years, not a couple of centuries.

We know that Orbital Cycles are not responsible for the current rapid global warming because the effects of Orbital Cycles are slowly cooling Earth, not warming it.

We know that Orbital Cycles are not responsible for the current rapid global warming because if it was orbital cycles (or the sun) the upper atmosphere would not be cooling and the temperature increases would be distributed differently across Earth and distributed differently with respect to time.


Other super facts related to global warming


To see the other Super Facts click here

High Wet-bulb Temperatures the Mass Killer in Heat Waves

Superfact 119: Heat waves are becoming significantly more frequent, intense, and longer-lasting globally due to human-caused climate change. The combination of a high temperature and humidity can create a high so called wet-bulb temperature that you cannot survive unless you can find a way to cool down. High humidity and heat can make it impossible to cool off through sweating, which rapidly leads to heatstroke. It is estimated that this kills about 500,000 people annually.

A wet-and-dry hygrometer featuring a wet-bulb thermometer. | High Wet-bulb Temperatures the Mass Killer in Heat Waves
A wet-and-dry hygrometer featuring a wet-bulb thermometer. Crossmr, CC BY-SA 3.0 https://creativecommons.org/licenses/by-sa/3.0, via Wikimedia Commons.

Imagine that it is a hot and humid day, but you want to go for a hike for a few hours. It is 104 degrees (40 Celsius) and humid, but you don’t know how humid. You are concerned about the Wet-bulb temperature. You use the Wet Bulb calculator and you find out that a relative humidity of 70% will yield a Wet-bulb temperature of 35 Celsius, which is deadly. You won’t survive that. A relative humidity of 45% will yield a Wet-bulb temperature of 30 Celsius, which is very dangerous but survivable for a healthy person.

How would you find out how big the risk is? The wet-bulb thermometer above is in Japanese and pretty cryptic but Amazon has wet-bulb thermometers that you can easily understand. Here is another one also on Amazon. I promise, I am not trying to sell Web-bulb thermometers for Amazon. I am just pointing out that we may need to start paying attention to Wet-bulb temperatures and perhaps buying these products as heat waves are becoming significantly more frequent, more intense, and longer-lasting due to our burning of fossil fuels.

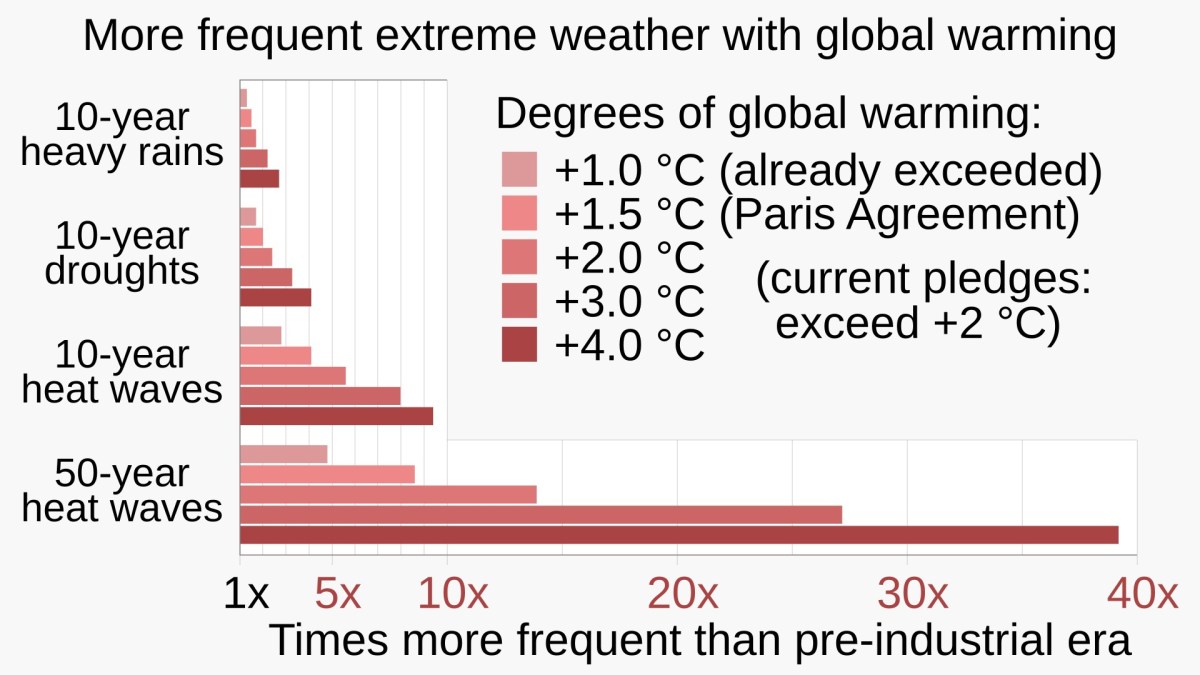
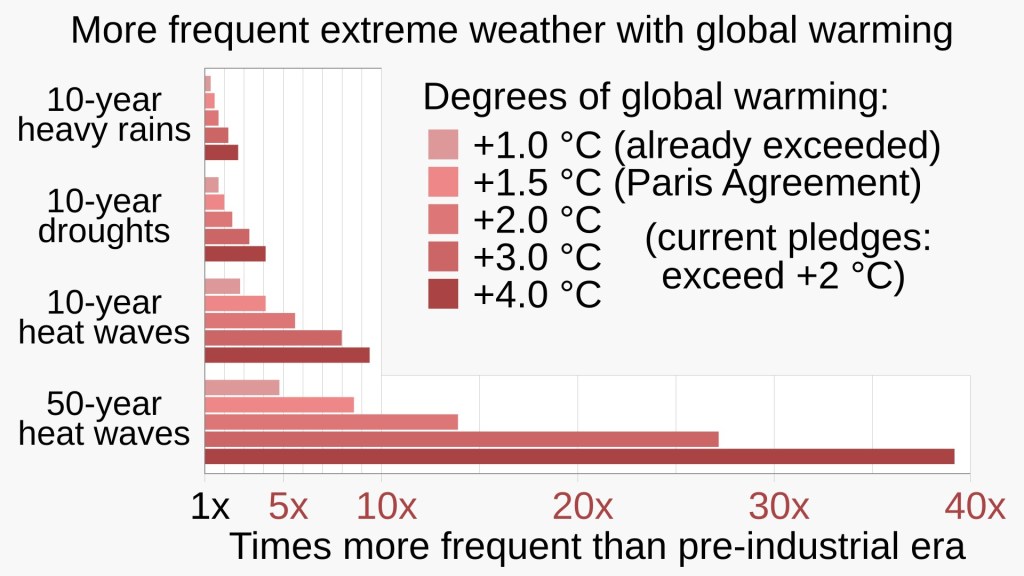
The graph shows the increased risk for 10-year heavy rains, 10-year droughts, 10-year heat waves and 50-year heat waves at differently increased global average temperatures, +1.0 Celsius, +1.5 Celsius, +2.0 Celsius, +3.0 Celsius, +4.0 Celsius,
Large increases in both the frequency and intensity of extreme weather events (for increasing degrees of global warming) are expected. RCraig09, CC BY-SA 4.0 https://creativecommons.org/licenses/by-sa/4.0, via Wikimedia Commons.

I should say that the Wet-bulb temperature of 95 Fahrenheit / 35 Celsius is more of an upper limit for survivability, like a suicide temperature. Wet bulb temperatures below 35 Celsius can also be very dangerous, at least for some people. As mentioned, excess heat and humidity kill about 500,000 people annually. You can read more here or here.

I was first made aware of the Wet-bulb temperatures when I read a science fiction novel focused on climate change, a so called Cli-Fi novel, the Ministry for the Future by Kim Stanley Robinson. It was a dystopian novel with the premise that 20 million Indians died because the Wet-bulb temperature became deadly in a large area in India, and not many people had air conditioning. Also, animals including wildlife and cattle died because, well obviously they did not have air-conditioning.

What followed was international crises, revenge and terrorism by the survivors against those whom they believed to be most responsible for our global warming / climate change, and desperate geo-engineering solutions to cool the planet. At first, I thought it seemed exaggerated but then I learned that dozens of places have already reached deadly Wet-bulb temperatures. Hopefully, a catastrophe like that will never happen but it is not entirely implausible.

The existence of the Wet-bulb temperature scale was a surprise to me. I knew that if you got locked into a Sauna for a long time you would not survive. Accidents that like that have happened in Sweden where I grew up. I did not know that the same thing could happen at natural temperatures. It made me realize that the more frequent, intense, and longer-lasting heat waves we are experiencing is a serious issue. I consider this to be a super fact because it is a true and important fact that many are unaware of.

What is the wet bulb temperature?

The wet bulb temperature is the lowest temperature to which a body can cool down through the evaporation of water (like sweating). It is measured using a thermometer covered in a water-soaked cloth. Because evaporation absorbs heat, the wet bulb temperature is lower than the actual air (dry bulb) temperature. When it is dry outside, sweat evaporates rapidly, keeping you comfortable. When it is humid, the air is already saturated, making it difficult for sweat to evaporate.

The humidex index, real feel and the wet-bulb all take both temperature and humidity into account, but Wet-bulb is focused on the body’s ability to cool down and is a safety measure. For example, if the Wet-bulb temperature is 28 Celsius then a body hotter than that (a human body is 37 Celsius) can lower the temperature via evaporation (sweating). So, a Wet-bulb temperature of 28 Celsius is not a problem (in that regard).

However, if the Wet-bulb temperature is 37 then the human body cannot use evaporation to cool down. Sweating won’t do anything. You’ll overheat and die. A Wet-bulb temperature of 35 is close enough to 37 for your evaporation system to fail and you’ll die. Basically, humidex is about feel, and Wet bulb about whether the body’s cooling system will work.

Our emissions seemed to have peaked, what is the worry ?

I have stated in other posts that thanks to the expansion of renewable energy our carbon emissions have taken a different path lately and that it looks like our emissions have started to go down, so what is the worry? It is important to understand that the average temperatures are not directly tied to our emissions but to the total amount of greenhouse gases in the atmosphere, for example, CO2 (an important greenhouse gas) leaves the atmosphere very slowly, and any level of excess CO2 emissions will keep accumulating.

Before we humans came along there was a balance, the soil, volcanoes, etc., added CO2 and roughly the same amount left the atmosphere. The so called carbon cycle. Imagine a bathtub with a drain that is slowly emptying water and a faucet adding about the same amount. Then we came along and sped up the faucet. For example, humans add roughly 60 to 100 times more CO2 to the atmosphere each year than all the volcanoes on the planet combined. Note: Our current administration is trying to censor climate science related information from NOAA and NASA, so tell me if the link in the previous sentence has stopped working.

A faucet is filling up a transparent glass bathtub with water, and a drain is emptying it but much slower.
The faucet is adding water to the bathtub faster than the drain is emptying the water, so it keeps filling up. The same is true for the CO2 in our atmosphere. Our emissions correspond to the faucet. I generated this picture with the help of ChatGPT.
Again a faucet is filling up a transparent glass bathtub with water, and a drain is emptying it but much slower. The difference between this picture and the previous is that in this picture the faucet is a bit slower than the faucet in the first picture, but still faster than the drain. | High Wet-bulb Temperatures the Mass Killer in Heat Waves
The faucet is adding water to the bathtub a little bit slower than in the previous picture but still faster than the drain is emptying the water, so the bathtub still keeps filling up, but a little bit slower. That is why the problem with heat waves will keep getting worse despite us doing a little bit better with our emissions. I generated this picture with the help of ChatGPT.

Other Climate Change Related Super facts


To see the Other Super Facts click here

IPCC Did Not Backtrack on Global Warming Being Human Caused

Superfact 106: IPCC likely retiring the RCP8.5 emissions scenario does not mean that the IPCC  backtracked on any climate science. It does not mean that climate change does not remain a serious and dangerous problem, and it definitely does not mean that global warming is not human caused.

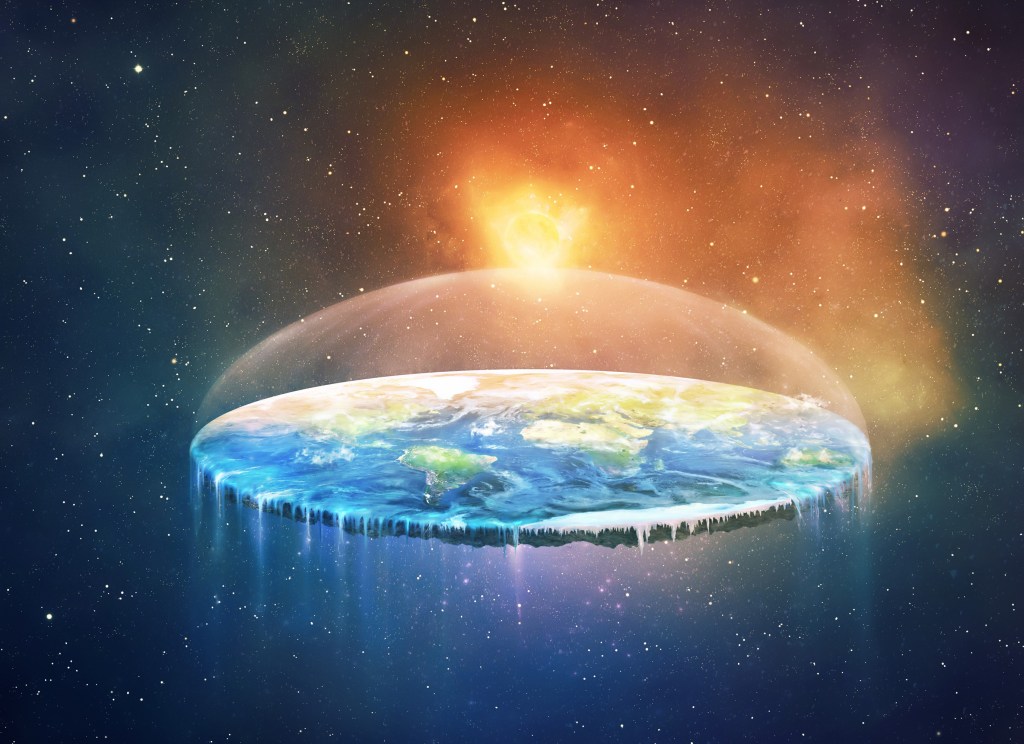
The photo below was recently taken by the International Space Station proving once and for all that Earth is flat like a pancake. NASA issued a statement on Thursday stating that Earth being closely spherical in shape is a long standing hoax created by leftwing extremists.

The picture shows a disk representing a flat Earth. A world map is on top of it and the sun is in the background. | IPCC Did Not Backtrack on Global Warming Being Human Caused
Digital illustration of flat Earth. Shutterstock asset id: 797857906 by Amanda Carden

OK, that isn’t true. It sounds like an April 1st joke, doesn’t it? It is a joke, except it isn’t April 1st. However, a fairly recent survey showed that 10% of the US population believe Earth is flat, not roundish. Imagine you not understanding any of the evidence for Earth being round and imagine that you’ve never stood on a tall hill watching ships disappearing below the horizon and imagine you being surrounded by a lot of people who claim that Earth is flat. It would be easy for you to believe that Earth is flat like a pancake. Wouldn’t it? Trying to understand evidence and science is crucial to understanding the world.

When I was young, I was bamboozled into thinking Earth was 6,000 years old and that evolution was a hoax. Then I got a science education, and I had to abandon those beliefs. Later as a young adult, I was bamboozled again, this time by rightwing media, into thinking that global warming wasn’t happening, well at least not very much of it, but then I learned something about the related evidence and about climate science, and I had to abandon that misconception too.

When you do not know about or understand the evidence, you are easy to fool, and that includes you fooling yourself by misunderstanding articles you are reading. Science is not a well understood topic despite its high importance in today’s world. Conspiracy theories, anti-vaccine propaganda, creationism, anti-climate-science, and other anti-science is spreading fast today, and it is easy to get bamboozled. Anti-science has become a cultural phenomenon.

To us who understand a little bit of the evidence that we are causing climate change, the evidence is conclusive enough that claims that it isn’t us causing it, sound just like the flat Earth claim above. It sounds like an April 1st joke to us because we know something. On the other hand, if you don’t know about the evidence, then you are easy to fool, and you might easily jump to false conclusions. Watch your biases and wishful thinking and pay attention to what the experts in the field are saying, not politicians, not influencers, not Facebook memes.

Examples of evidence that we humans are causing climate / global warming / climate disruption (pick your preferred moniker) include satellites having directly measured our greenhouse gases trapping heat, the upper troposphere cooling whilst the lower troposphere is warming, a phenomenon explained by greenhouse gas emissions, the unnatural speed of the warming, the manner in which the warming happens (explained only by greenhouse gas emissions), and that possible natural causes such as the sun, orbital cycles / Milankovitch cycles cannot explain the current warming. Add isotope studies that show that the added greenhouse gases originate from burning fossil fuels and that volcanoes emit less than 1% CO2 of what we emit.

You can read more about the evidence here.

IPCC (Intergovernmental Panel on Climate Change) being likely to drop the so called RCP8.5 (or SSP5-8.5) scenario in the upcoming Seventh Assessment Report upon the suggestion of the Scenario Model Intercomparison Project has set off a flood of misinformation and misinterpretation. Not the least by politicians, notably our President, who made some very bizarre and clueless statements on the issue.

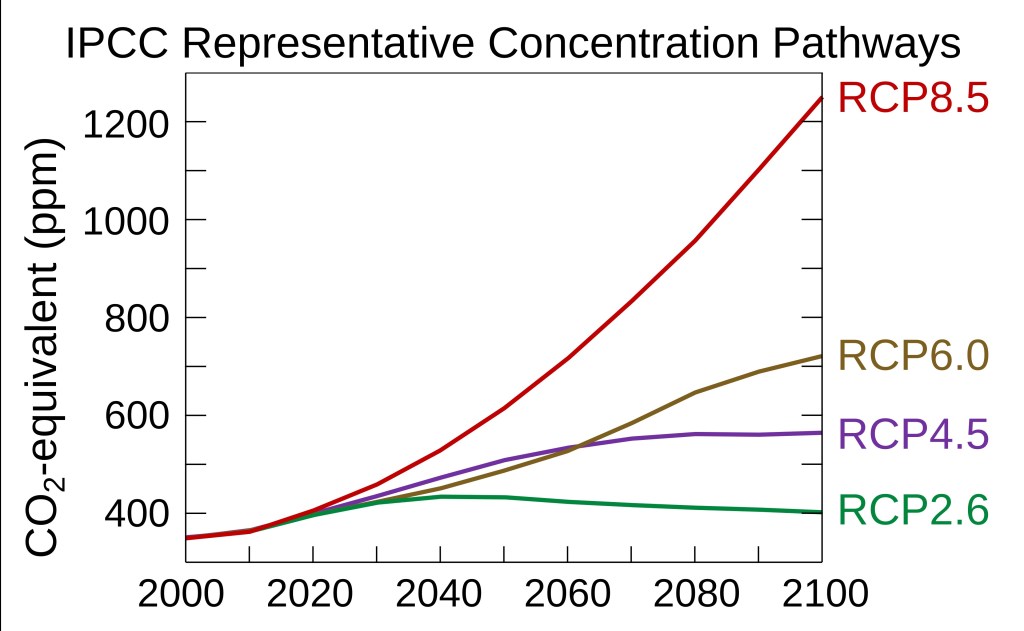
IPCC and the Scenario Model Intercomparison Project never stated that climate change is not caused by humans, or that climate change is not a serious problem. The Representative Concentration Pathways (RCPs) fundamentally depends on how much greenhouse gases we emit, as can be seen in the graph below. RCP8.5 corresponds to a very extreme scenario of burning enormous amount of coal. It was never a likely scenario to begin with, and it had become implausible due to the successful transitions to clean energy. That is why it makes sense to drop RCP8.5.

It was not because climate scientists were wrong about the climate science, or because environmentalists are exaggerating. In contrast to what many media outlets will tell you it is a vindication or victory for environmentalists. The global efforts to transition to clean energy have made it so that we can declare the worst of the worst scenario as implausible.

The graph shows four scenarios RCP2.6, RCP4.5, RCP6.0, RCP8.5, each corresponding to different concentrations of CO2. The Y-axis shows the amount of CO2 in the atmosphere going from 300 ppm to 1300 ppm. The X-axis corresponds to the years going from year 2000 to the year 2100.
Different RCP scenarios result in different predicted greenhouse gas concentrations in the atmosphere (from 2000 to 2100). RCP8.5 would result in the highest greenhouse gas concentration (measured as CO2-equivalents). Efbrazil, CC BY-SA 4.0 https://creativecommons.org/licenses/by-sa/4.0, via Wikimedia Commons.

Since there are so much confusion, misinformation and hoopla surrounding this seemingly non-controversial event, I have reasons to consider the rectification of the misinformation a super-fact.

Official Statements on RCP8.5 by IPCC and the Scenario Model Intercomparison Project

It should also be noted that IPCC issues assessment reports based on research done by other organizations such as the Scenario Model Intercomparison Project. The IPCC does not conduct its own research. That is another common misrepresentation across media. It was not IPCC that decided to drop the RCP8.5 scenario, and the seventh assessment report has not yet been released. It was a suggestion by the Scenario Model Intercomparison Project published as a paper in Geoscientific Model Development, which stated “the CMIP6 high emission levels (quantified by SSP5-8.5) have become implausible, based on trends in the costs of renewables, the emergence of climate policy and recent emission trends”. You can read this paper here (and search for the quote).

Notice that the paper by the Scenario Model Intercomparison Project is NOT stating that global warming / climate change is not human caused. It does NOT state that it is not a serious problem. It does not in anyway imply anything like what the President and certain media outlets claim. There is additional reading from the Scenario Model Intercomparison Project here. You can read IPCC’s official comment on the issue here and its statement here. They were published May 20, 2026. The Washington Post and EOS provide some pretty accurate and easy to read explanations of what happened, for those wanting lighter reading.


To see the Other Super Facts click here

Carbon Capture and Storage an Unfulfilled Promise

Superfact 99: Carbon capture is the process of separating carbon dioxide from industrial emissions. Even though it works and could be helpful it isn’t used very much, at least not the right way.

Esther’s writing prompt: April 29, 2026: Capture

Click here or here  to join in.

Carbon capture and storage is the process of separating carbon dioxide (CO2) from industrial emissions to prevent it from entering the atmosphere and contributing to climate change. There are also systems that can remove carbon dioxide directly from the atmosphere, but this is expensive. After capturing the carbon dioxide, it is compressed and stored permanently underground or used in products.

Capturing carbon dioxide from concentrated sources like ethanol or natural gas plants can cost as little as $15–$25 per ton, which should be compared to the huge cost from the damage to health and the environment caused by carbon dioxide added to atmosphere. This cost ranges from several hundred dollars per ton, to thousands of dollars per ton, and even one hundred thousand dollars per ton according to some estimates. Yet it has only captured about 0.1% of global emissions, making its overall climate impact negligible. Instead of storing the captured carbon dioxide it is often injected into nearly depleted oil wells to force out the remaining oil.

If you have not heard about carbon capture before, its existence may be a surprise to you. If you do know about carbon capture it is likely to come as a surprise to you that it is a potentially promising technology that is underutilized and not used correctly. The facts around this technology are surprising, which is why I call it a super fact.

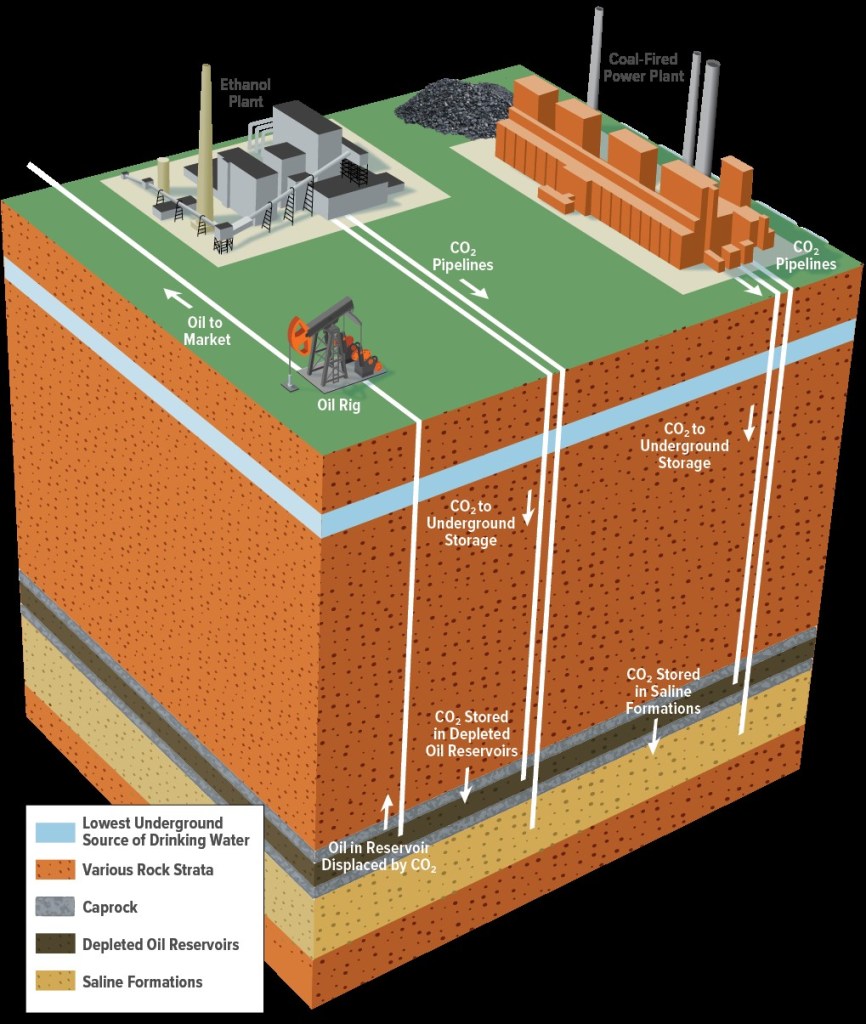
The illustration shows a geological cross section and includes an ethanol plant, and a coal fired power plant capturing emissions buried below earth’s surface. | Carbon Capture and Storage an Unfulfilled Promise
With CCS, carbon dioxide is captured from a point source, such as an ethanol refinery. It is usually transported via pipelines and then either used to extract oil or stored in a dedicated geologic formation. Congressional Budget Office, U.S. Federal Government, Public domain, via Wikimedia Commons.

Carbon dioxide and Global Warming

Global warming, or if you call it climate change, is happening and it is happening very fast. We also know that it is caused by us primarily as a result of our burning of fossil fuels. The primary culprit is carbon dioxide. There is a long-standing scientific consensus on these two/three facts because the evidence is conclusive. Some organizations and contrarians have successfully confused the public, but that does not mean there is a serious scientific discussion on the issue. To read more about this click here.

The damage caused by carbon dioxide to human health and the environment is difficult to assess, but you can get an idea, and you can put a dollar price on it. The economist William Nordhaus did this and got the Nobel Prize in economy for it in 2018. See my review for his book The Climate Casino. Now the question is what to do about it, and carbon capture and storage is one potential option.

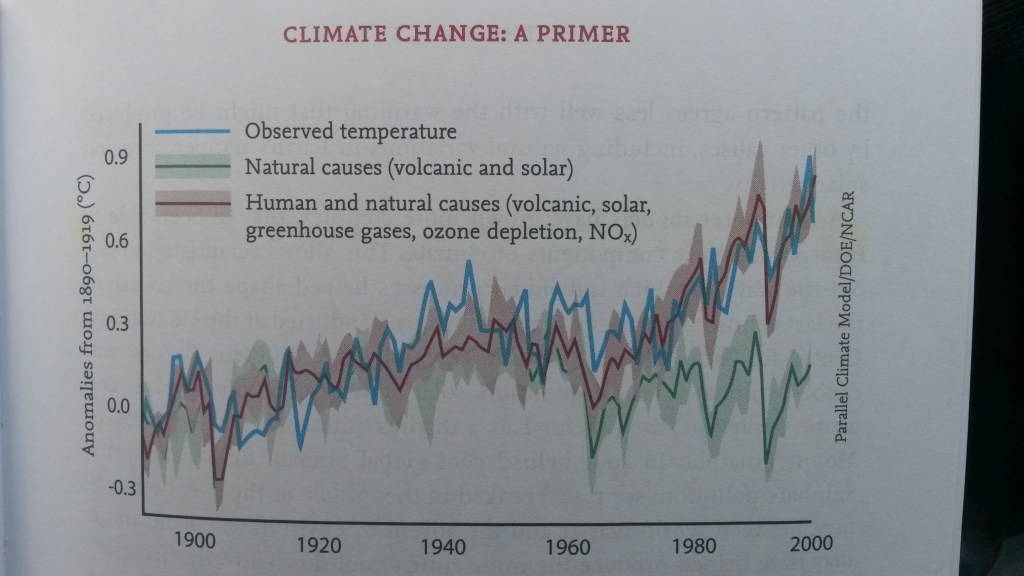
Graph showing possible causes for the observed temperature (blue), natural causes (volcanic, solar), human and natural causes (volcanic, solar, greenhouse gases, NO2, ozone depletion).
Natural causes for global warming / climate change would have cooled the planet, not warm it. Click here to visit this NASA web page regarding the causes behind global warming.

Carbon capture and storage an unfulfilled promise

The following is to a large degree my opinion, not just fact. Carbon capture and storage is a good idea. However, it adds costs to the production of energy, a cost someone must pay for. It seems like a no brainer that if carbon dioxide creates a social cost of several hundred dollars per ton, then paying much less than that to mitigate the emissions would be a good idea. However, the social cost that carbon dioxide imposes on all of us is imposed on all of us whether we are responsible for the emissions or not. Whereas the cost for carbon capture is a cost to a specific company or person responsible for the emissions.

Even though the cost for carbon capture may only be a few dollars added to the natural gas bill or a few cents per gallon on a gas tank it is a cost that is not incurred by your competitor who is not doing carbon capture. Unless the governments of the world either pay for carbon capture or put a price on carbon emissions, carbon capture isn’t going to be economically viable.

In addition, carbon capture and storage has been disappointing in other ways. It has been more difficult and expensive than expected. It has been used to extract more fossil fuels rather than removing carbon emissions. In addition, renewable energy has become so cheap that it is cheaper to use renewable energy instead of fossil fuels with carbon capture.


My Other Responses to Esther’s Prompts


To see the Other Super Facts click here