
Superfact 100: The share of fossil fuels for electricity generation is decreasing and EVs are replacing internal combustion engines. The share of hydro and nuclear energy, which is clean energy, is decreasing, but the sharp increase in the share provided by renewables such as wind and solar is more than making up for it. In addition, there are new clean energy sources that are very promising but not yet widely implemented such as geothermal energy and fusion energy. The energy landscape is changing rapidly.
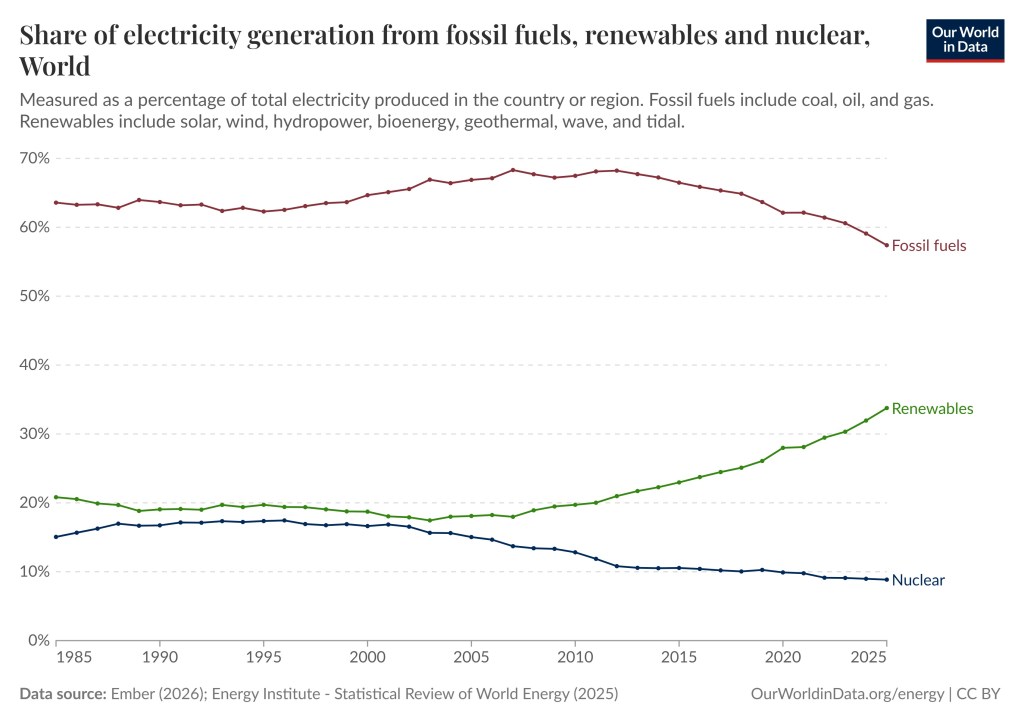
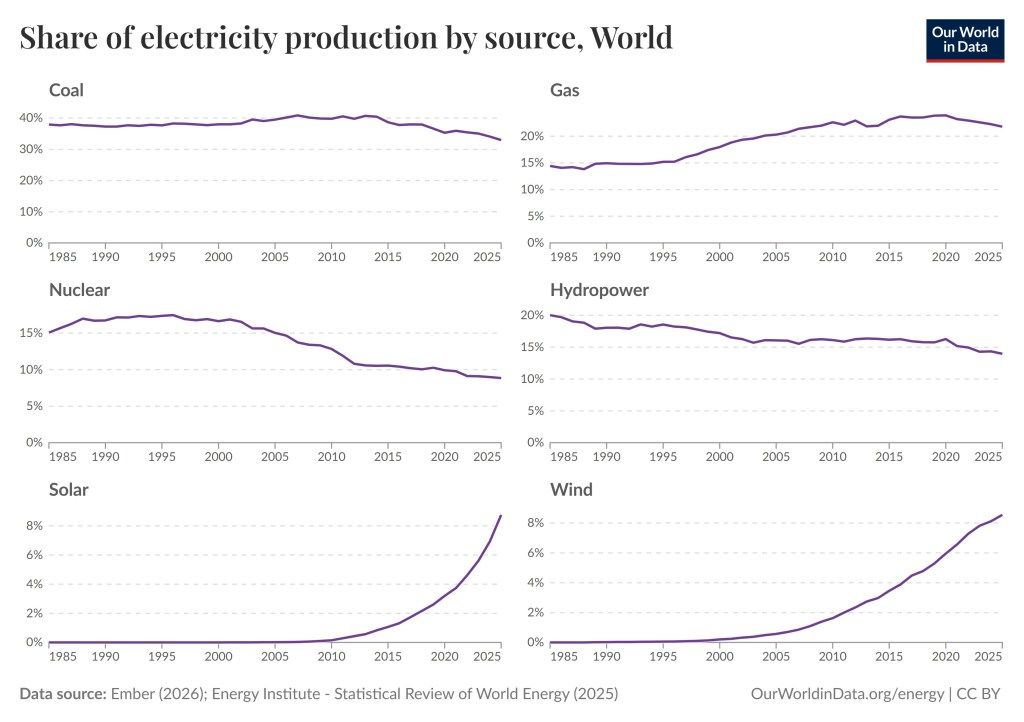
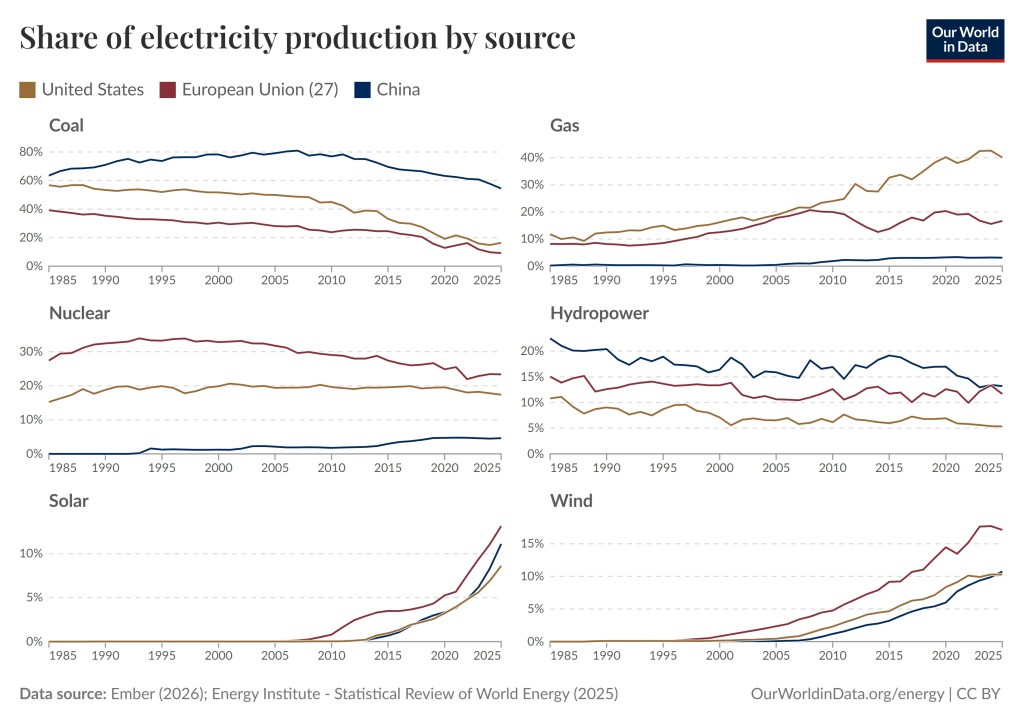
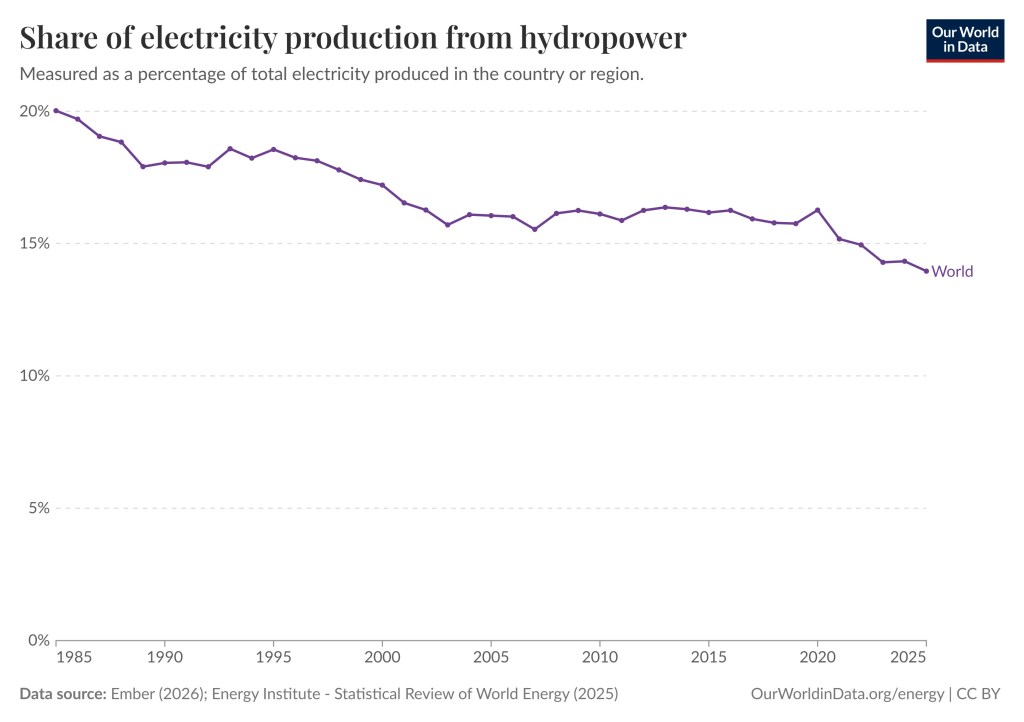
As can be seen in the graph above the share of electricity in the world generated by fossil fuels has gone down in recent years (from 66.48% in 2015 to 57.39% in 2025), and the share of electricity generated by nuclear has also gone down (from 10.55% in 2015 to 8.85% in 2025) whilst the share of electricity generated by renewables has increased (from 22.97% in 2015 to 33.76% in 2025). This is even though the most prominent source of renewable energy, hydro, has decreased its share substantially (from 16.2% in 2015 to 14% in 2025) as can be seen in the graph below.
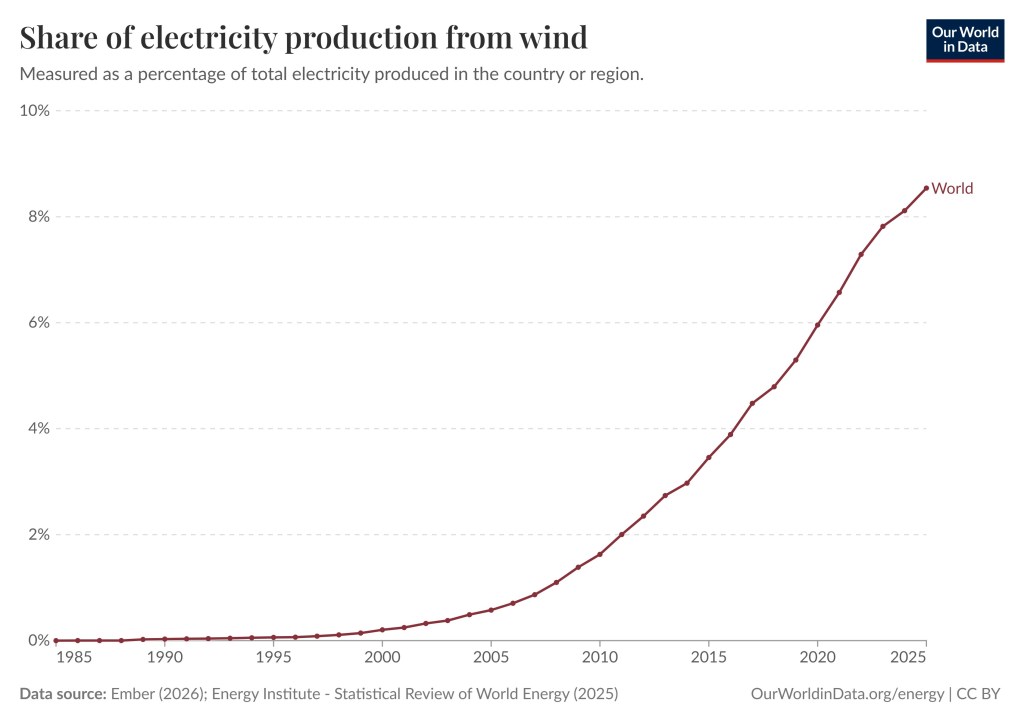
What is going on is that two sources of renewable energy, wind and solar, have increased their share of electricity generated substantially (wind: from 3.5% in 2015 to 8.5% in 2025) and (solar: from 1.1% in 2015 to 8.7% in 2025), which can be seen in the graph below. It should be noted that renewable energy encompasses solar, wind, hydropower, bioenergy, geothermal, wave, and tidal sources.
To play around with the graph above and other similar graphs click here and select and look at the bottom charts. To play around with the graph below and similar graphs click here and select and look at the bottom charts.
So far, I’ve been talking about the share of electricity production in the world by different energy sources. However, the world is using more and more electricity. Populations are growing, economies are growing, and the world is electrifying, for example, because of the worldwide adaption of EVs.
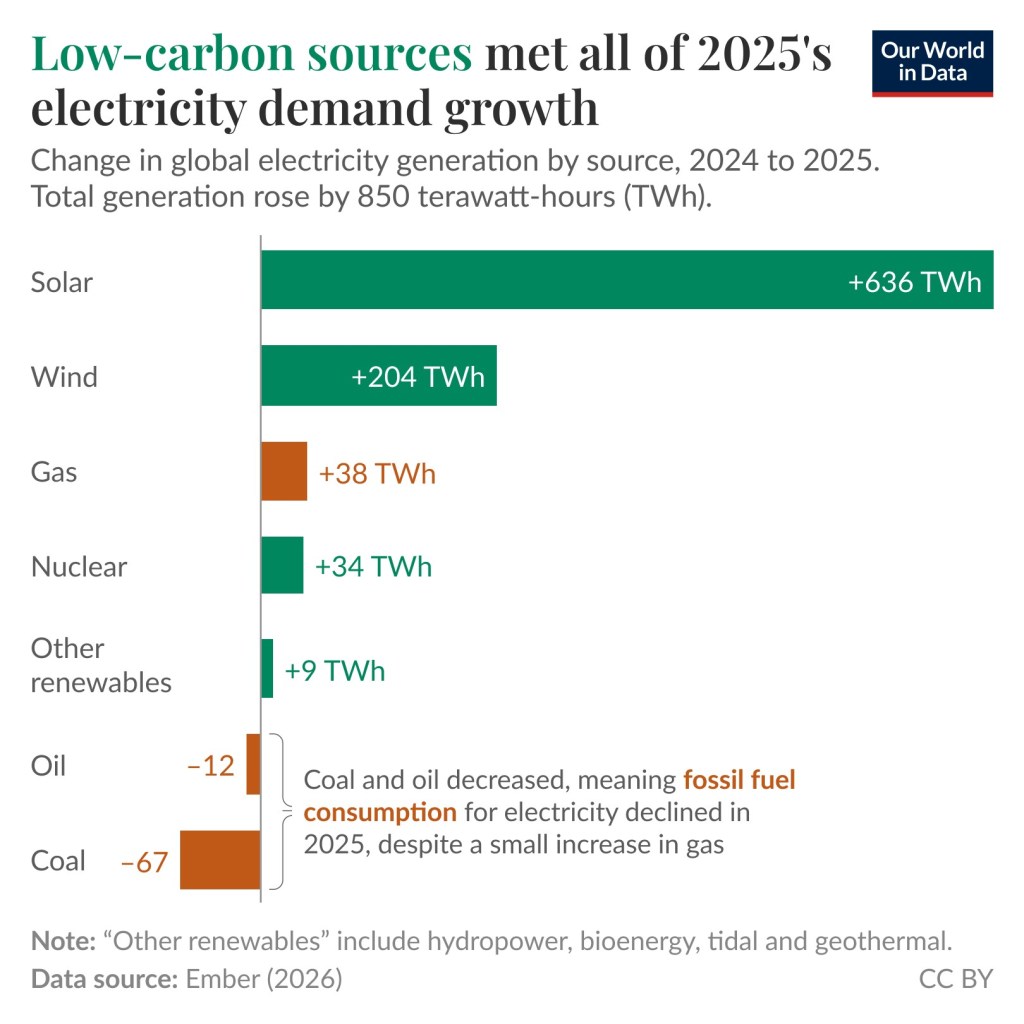
Just because an energy source’s share of electricity production is decreasing does not mean its total global electricity generation by that source is decreasing. In fact, as the share of electricity production by fossil fuels has decreased, the total production of electricity by fossil fuels has increased, well up until now. For the first time in history the total global electricity generation by fossil fuels went down in 2025. Note that since coal and oil decreased in the graph below fossil fuel consumption for electricity declined in 2025, despite s small increase in gas. This means that the use of fossil fuels is finally decreasing.
The practice of burning fossil fuels to generate electricity and for transportation is becoming less dominant. I believe this fact is surprising to many people, especially Americans since the current administration has taken a strong anti-renewable and anti-climate-science stance, and many Americans are not aware of what is happening in the rest of world in this regard. Superfact #100 is a super fact because the data is reliable, it is surprising to many people, and it is important.
It should be noted that we will likely keep using fossil fuels to produce fertilizers, plastics, medicines, and chemicals for a long time. However, this corresponds to only a few percent of our current use of fossil fuels and seems to be a lot better use of fossil fuels than burning it all up for energy. In fact, we may need the remaining fossil fuels for that purpose. In this post I am using data provided by Our World in Data which in turn got data from Ember Energy, or the International Energy Agency.
The Current Administration’s Opposition to Renewables and Climate Science
I am trying to keep politics out of my blog. However, the current administration’s strong opposition to and the misinformation they disseminate about renewables and climate science makes it difficult to discuss this renewable energy without bringing it up. It is an important piece in our understanding of what is going on. The misinformation about climate science (and other scientific topics) has bamboozled a lot of people and the actions taken to hinder the deployment of renewables have had real consequences. However, it is important to remember that the current situation here in the US is temporary and has a limited impact on the rest of the world.
Some actions that current administration has taken are:
- Science organizations such as NOAA and NFS-NCAR have had their budgets severely cut and have been threatened to be dismantled. Websites related to climate science have been taken down. Click here to read more. NASA is also threatened to have its science programs severely cut (by 47%), as well as other programs, but it has not yet been implemented. Click here to read more.
- Restricting or ordering the freezing of permits for renewables, canceling tax credits and investment credits for renewables, ordering the cancelation of renewables under construction, for additional information click here, or here.
- In 2009 the EPA found that atmospheric concentrations of greenhouse gases endanger both current and future generations, enabling EPA to regulate greenhouse gases. This, so called endangerment finding was overturned in February 2026 by the administration. This article explain why there is no Scientific justification to revoke the endangerment finding.
- The administration paid one billion dollars to France’s TotalEnergies in exchange for not developing windfarms on the east coast (kind of a bribe).
- The United States is the only country to have withdrawn from the Paris Agreement (January 27, 2026). Three other countries, Iran, Libya, and Yemen, did not join.
- 95,000 employees, including 10,000+ with PhD’s, at government science agencies (more than a third of them) have either been laid off / fired, or left, as a result of current policies. This effects CDC, NIH (National Institute of Health), and especially anything related to climate science. Many scientists have left the US for Europe.
There is not wonder many in the United States incorrectly believe clean energy is on its way out. I should say that even though support for solar and wind has declined in the US, solar and wind remain the sources of energy that most people want the federal government to encourage over any other source of energy, according to this Pew Research article.
Important Climate and Energy Facts
As I said, the misinformation about climate science has bamboozled a lot of people. As an example. We know that climate change / global warming is happening. We have also known for several decades that the current climate change / global warming is not natural. It is caused by us, chiefly due to the burning of fossil fuels. The scientific evidence is conclusive. It includes satellites directly measuring our greenhouse gases trapping heat, the upper troposphere is cooling whilst the lower atmosphere is warming, showing that the heating is from greenhouse gases, the unnatural speed of the warming, isotope studies, climate models, etc. How many people know about this? I believe very few people do. Below are eleven related super facts.
- (16) Wind power is providing more than a quarter of Texas Power
- (17) Wind power is not a major cause of bird death
- (25) Global Warming is Happening and is Caused by us
- (26) The Hockey Stick Graph is not Wrong
- (34) Scientists Agree that Global Warming is happening and that we are the Cause
- (52) Climate change worsens wildfires in the US
- (77) Landman Lies
- (87) Wind Energy is Indeed Clean Energy
- (91) Without carbon dioxide the Earth would freeze
- (96) Nuclear Energy is Relatively Clean and Safe
- (99) Carbon Capture and Storage an Unfulfilled Promise
The Share of EVs
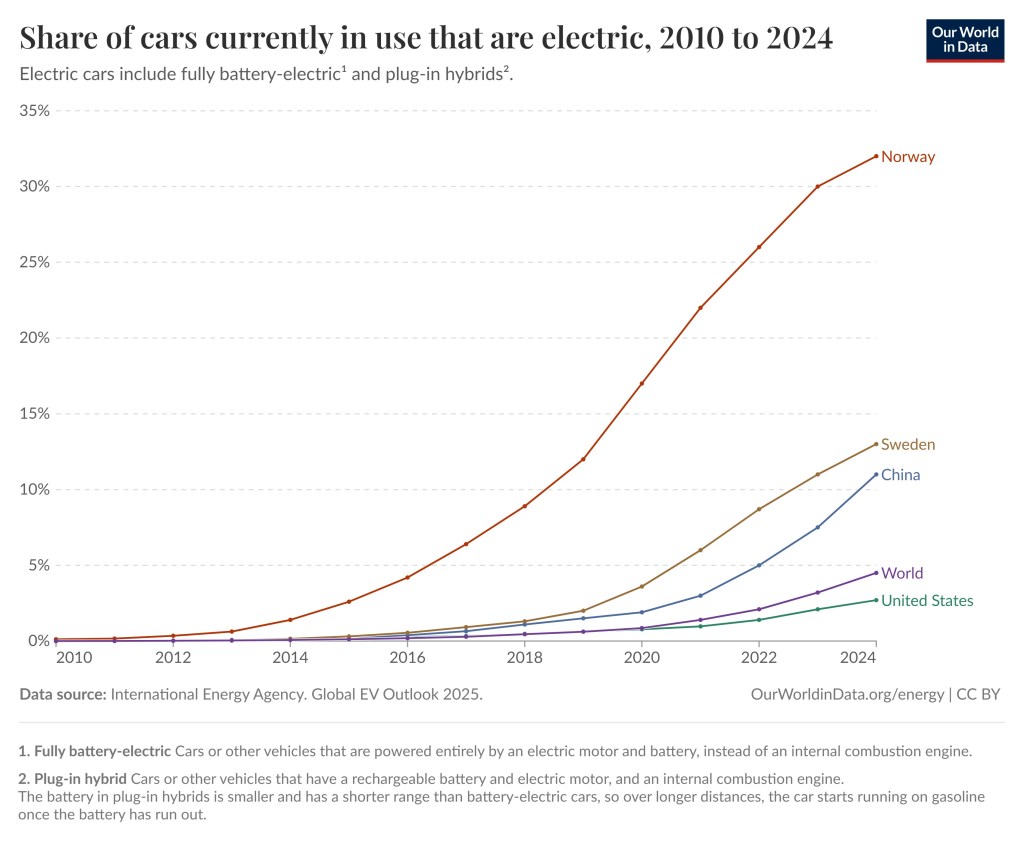
Another phenomenon that results in less burning of fossil fuels than we otherwise would have is that electric cars and plug-in hybrid are becoming more common in the world. Going from nearly non-existent in 2010 electric cars (EVs) are now starting to show up around the world. The share of electric cars on the roads in 2024 was in the United States was 2.7%, in the world 4.5%, in China 11%, in Sweden 13% and in Norway 32%.
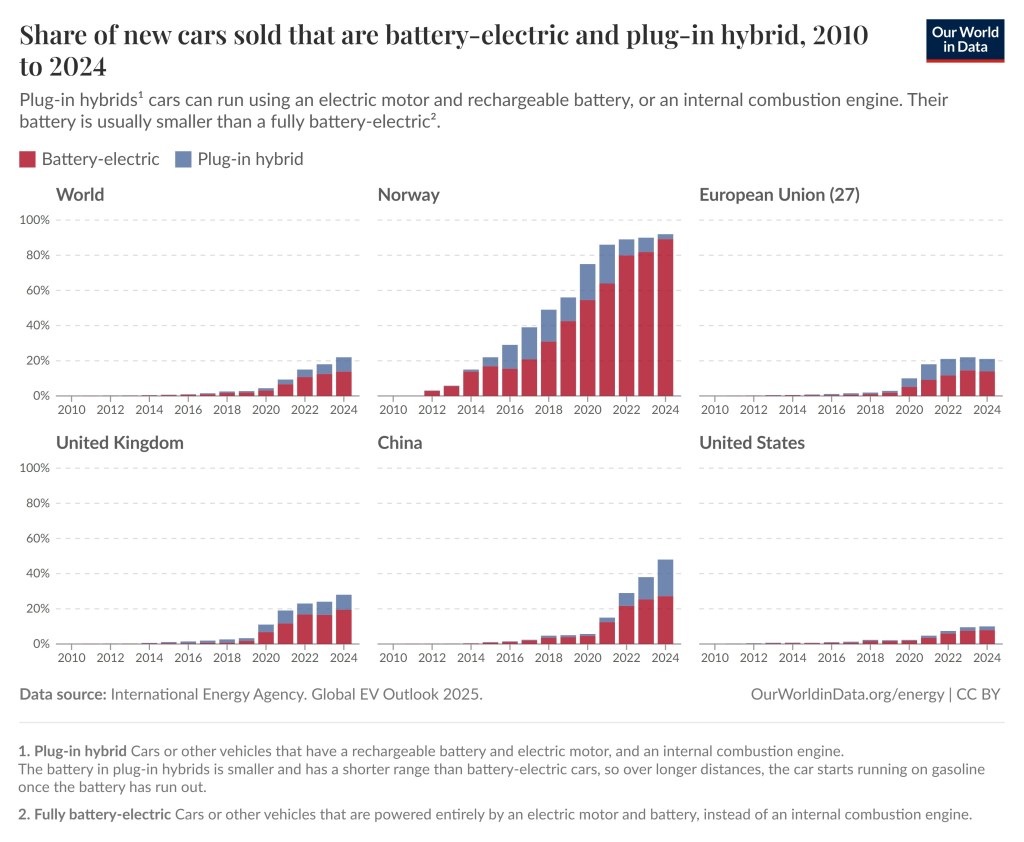
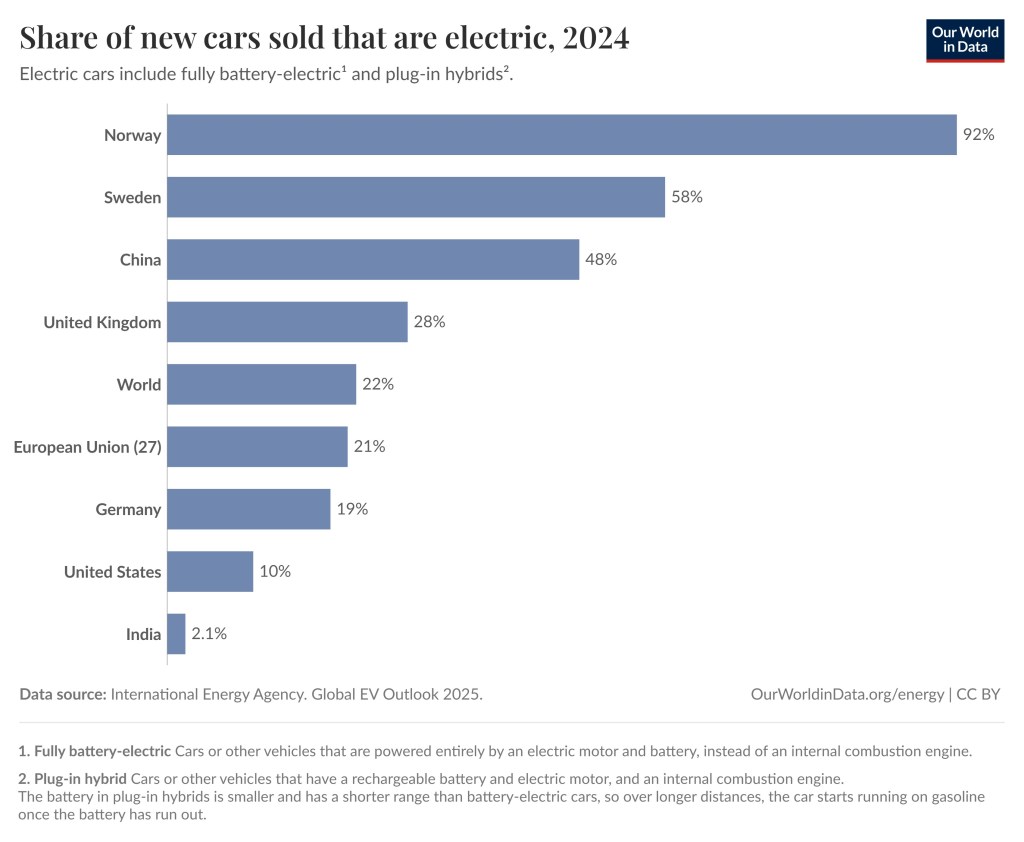
What matters more (for the future) is the sale of new EVs and plug-in hybrids. The share of new cars that are electric was 22% for the world, 10% in the United States, 21% in the EU, 28% in the United Kingdom, 48% in China, 58% in Sweden, 92% in Norway. In 2025 the share of new cars that were electric was 98% in Norway according to this website. To see more EV statistics and play around with various graphs visit this link.
One thing that might be surprising to Americans is that EVs are quite common in many other countries including EU, the Scandinavian countries, and China. Another is that EVs are indeed significantly cleaner than internal combustion engines, even when charged from a relatively dirty grid. See this super fact (29) EV Cars Indeed Emit Less Carbon Pollution.
Data source: International Energy Agency Global EV Outlook 2025. OurWorldinData.org/energy | CC BY
Share of electricity production by source EU, US, China
The first graph in this post depicted the share of electricity production by source for the world. The graph below breaks it up to show the share of electricity production by source for the three largest economies in the world, the United States, China and the EU. Again, the share of energy from coal, nuclear and hydro is decreasing whilst the share from wind and solar is going up for all three markets. One notable difference from the top graph is that gas keep increasing for the United States.
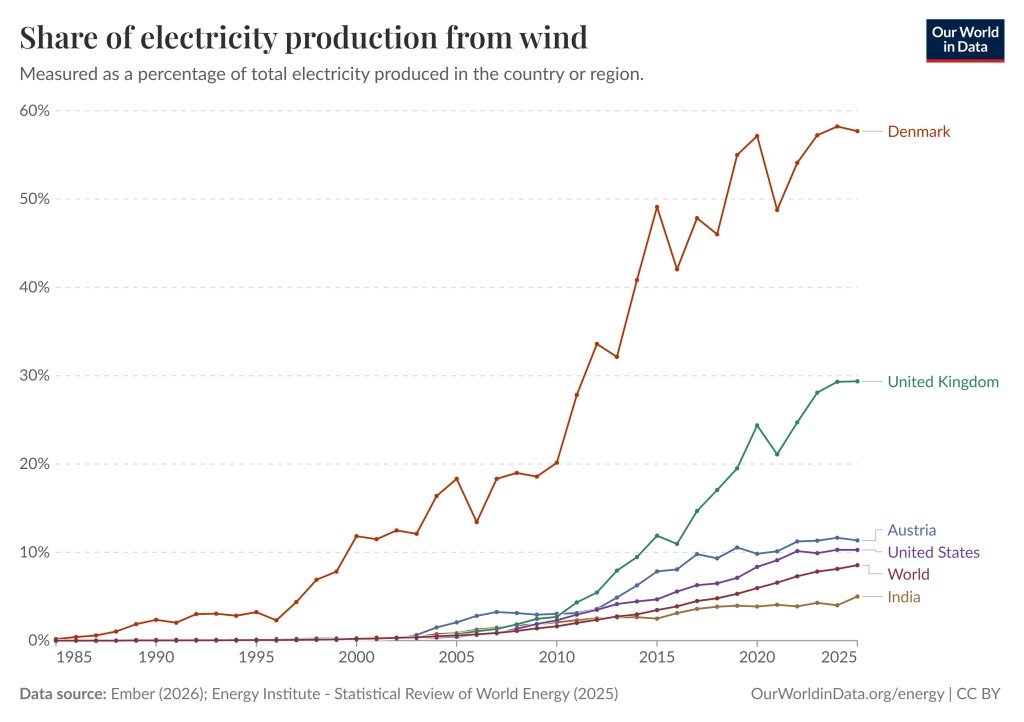
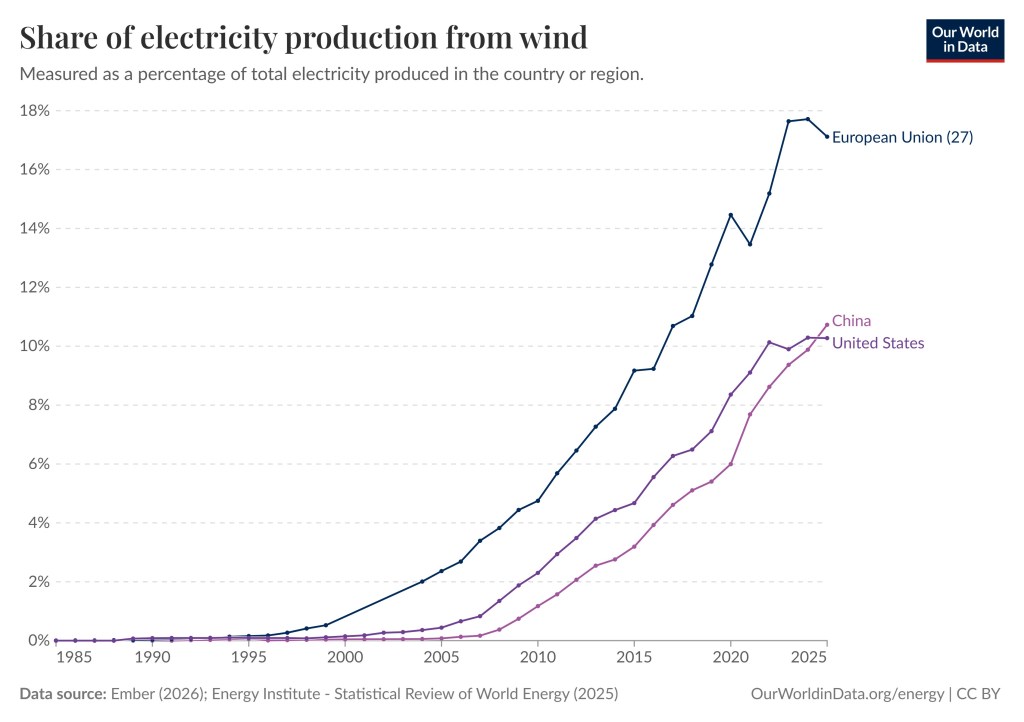
The Share of Electricity Production from Wind
Below are a few charts depicting the share of electricity production from wind. The first graph is already included in the second chart from the top (above). However, this is a close up. The second graph depicts the share of electricity production from wind for multiple countries. It should be noted that Denmark and the United Kingdom are prominent users of wind power. For Denmark the share of electricity production from wind is almost 60%. By clicking here you can play around with the graphs and generate as many different graphs as you wish.
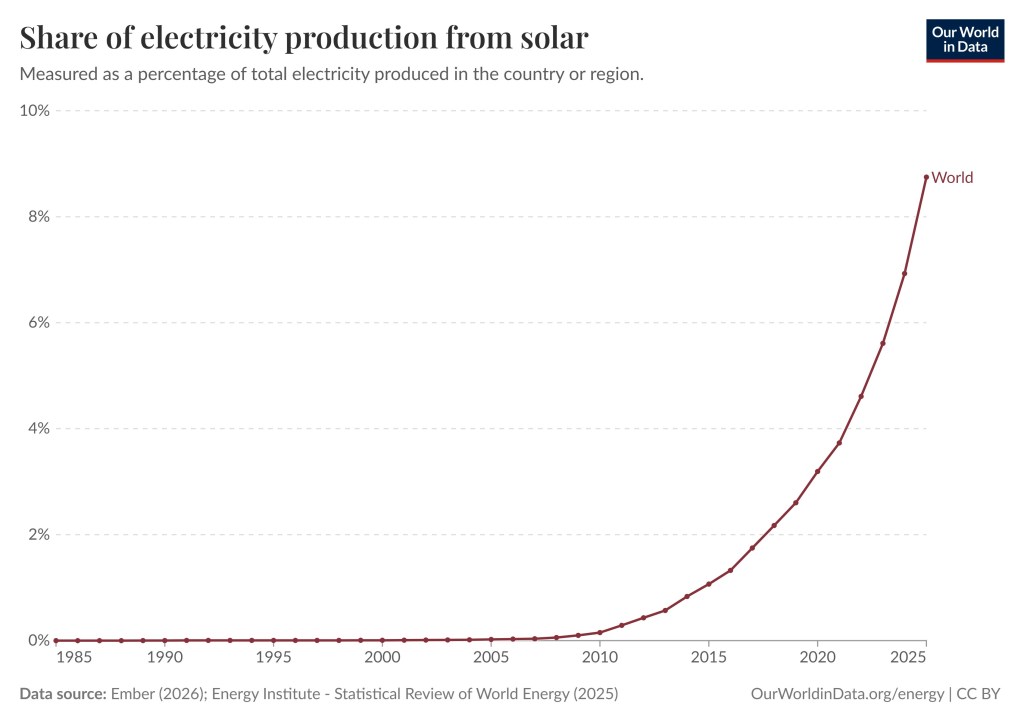
The Share of Electricity from Solar
The share of electricity from Solar for the world has grown from essentially 0% in the year 2000 to 3.19% in 2020 to 8.75% in 2025. For solar, the United States follows the rest of the world closely. Some countries have a higher percentage, such as the Cook Islands – 50%, Luxembourg – 30.52%, Chile – 25.06%. If you wish you can take a look here, or here, and you can play around with the different graphs. You can create millions of scenarios at your pleasure.
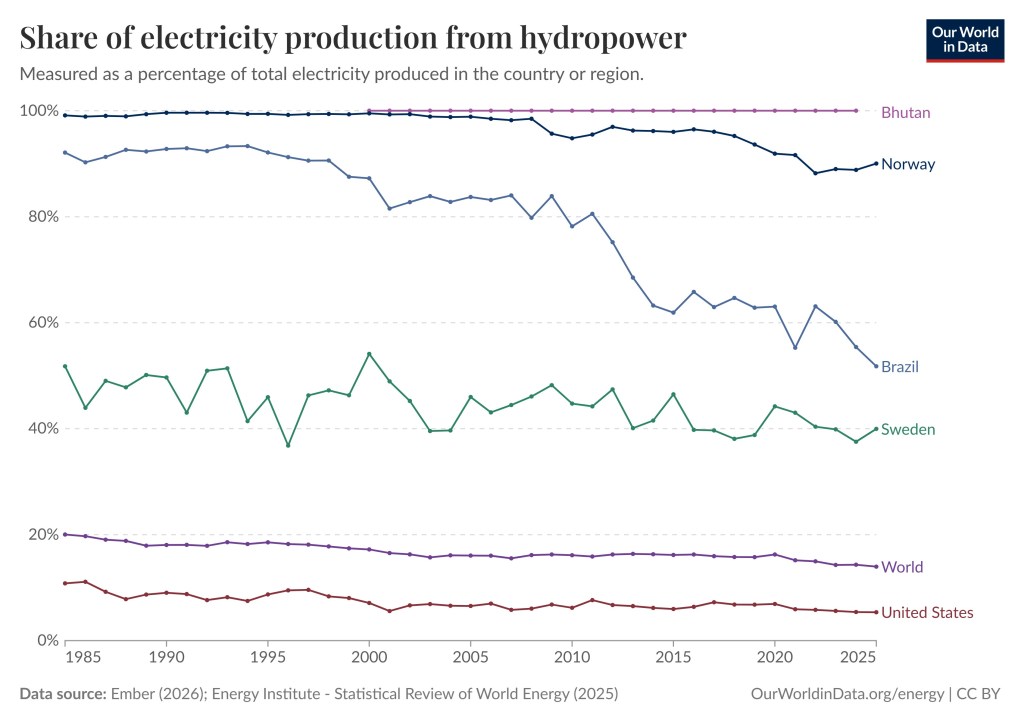
The Share of Electricity Production from Hydropower
Hydro is a renewable energy source but its share of electricity production in the world has gone down. Unlike solar and wind, hydro is not an intermittent source of energy, so that is not necessarily something to celebrate. The intermittency of solar and wind can be mitigated using batteries, or energy sources that are not intermittent, preferably clean energy sources such as hydro and nuclear. Hydro is still the world’s most popular renewable energy source but that is changing quickly.
The graph below shows that the share of electricity production from hydropower for the world is 13.96%, USA 5.35%, Bhutan 100%, Norway 90.03%, Brazil 51.78%, Sweden 39.97%. If you wish you can take a look here, or here, and you can play around with the different graphs. You can create millions of scenarios at your pleasure.
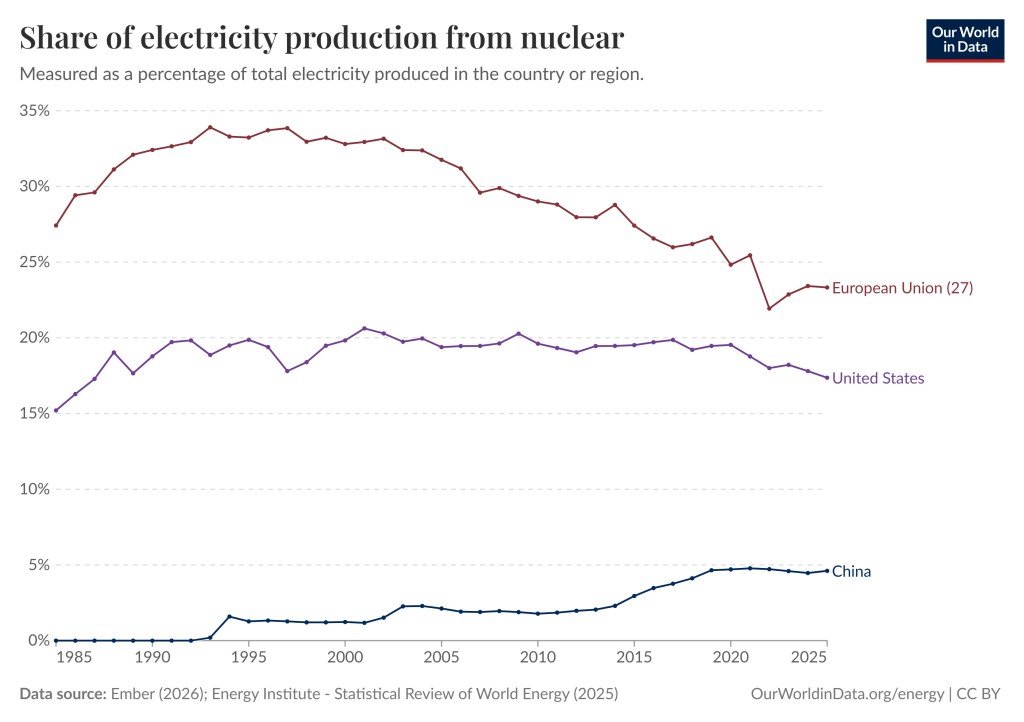
The Share of Electricity Production from Nuclear
The share of electricity production in the world from nuclear went down from 15.06% in 1985 to 8.85% in 2025, which is a significant drop. During the same time the share of electricity production from nuclear in the United States went from 15.20% in 1985 to 17.36% in 2025, for China the numbers are 0% in 1985 to 4.61% in 2025, and for EU the share of electricity production in 1985 was 27.42% and in 2025 23.32%. However, in 1993% the share of electricity production in 1993 was 33.90%.
So, nuclear has taken a big step back in EU. Germany cancelled nuclear power entirely, for better and for worse. To interact with the graphs shown below or see other (millions) related charts or maps click here, or here.
Geothermal a Promising source of Energy
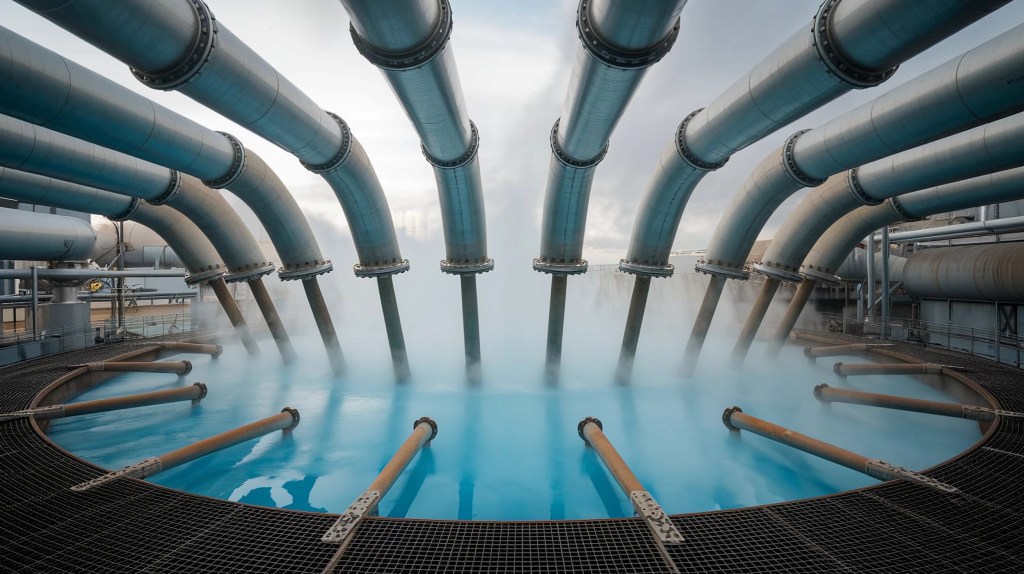
Another reason to believe that the energy transition away from fossil fuels has begun, is that in addition to fossil fuels losing share of total electricity produced, there are promising emerging renewables, such as Geothermal energy. Geothermal energy uses natural heat from deep within the Earth to generate electricity or heat buildings. Wells tap into underground hot water/steam reservoirs, forcing it up to spin turbines that power generators, after which the water is cooled and reinjected to replenish the source (see the picture below).
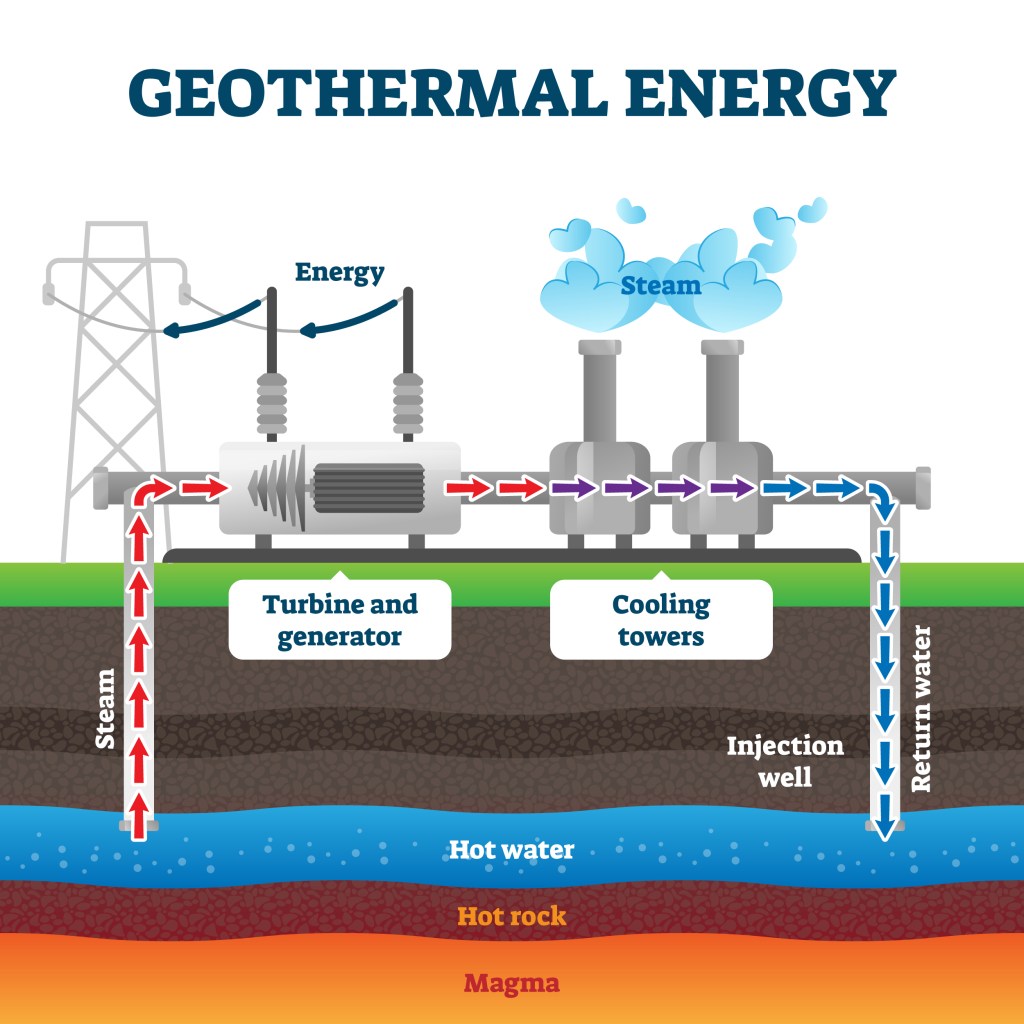
Just like renewables geothermal energy is low emissions energy source but unlike renewables it is not an intermittent energy source. It is as of yet not widely used and not cost effective. However, it appears that might change soon. The advanced drilling techniques needed are utilizing oil and gas expertise and could therefore provide a good transition from fossil fuels to geothermal.
Is Fusion Power the Future ?
Fusion power is a clean, and near-limitless energy source generated by smashing light atomic nuclei together, usually hydrogen isotope, to form heavier ones. It is a form of nuclear power that releases immense heat. It replicates the process that powers the Sun. Unlike wind and solar it is not intermittent and can generate carbon-free baseload electricity without long-lived radioactive waste. However, it cannot yet be used to produce energy. That does not mean it will not work in the future.
Conclusion
The share of fossil fuels for electricity generation is decreasing despite the fact that the share from hydro and nuclear is also decreasing. The reason is the spectacular increase in the share provided by wind and solar. In addition, EV cars are rapidly replacing internal combustion cars around the world, especially in the EU and China. There are also renewable or clean energy sources that show great promise even though they are not yet widespread. This means that fossil fuels, coal, natural gas, and oil, which are all dirty and dangerous energy sources, are finally being replaced by cleaner alternatives.

Thank you for this very informative post, Thomas. Yes, it’s difficult to avoid politics when looking at the environmental changes in your country. Unfortunately, Trump’s backward policies are not only affecting the U.S. but other countries, too. In our case, we have had to drop some of our climate change/clean energy initiatives because he’s trying to economically cripple us. We have had to opt for the quickest and most pragmatic ways of preserving our economy and that now means pivoting back to fossil fuels. Trump and his toady government is a scourge in many, many ways and is doing harm that will last decades.
LikeLiked by 2 people
I have been reading about Canada, and I don’t understand why anyone would attack Canada economically and with propaganda and misinformation. Canadians are the most harmless and friendliest people on earth and have been a very good ally to the US.
LikeLiked by 2 people
Thank you, Thomas. The reason why is that he wants to exploit our assets and natural resources. If we actually were to join the U.S., we would be a voiceless territory, certainly not a state or states.
LikeLiked by 2 people
Yes that is probably correct. I am glad Canadians are trying to stand up for themselves.
LikeLiked by 1 person
Looking forward to the day when clear energy surpasses fossil fuels. Thank you, Thomas, for this insightful information. Important within the global scenario! Light and blessings your way, my friend! ✨🙏🍀
LikeLiked by 1 person
Thank you Susana, me too. And Light and blessings your way too my friend.
LikeLiked by 1 person
Oh, how interesting! I hadn’t considered geothermal energy and fusion energy before. The information here about electric cars and plug-in hybrids is super. I am going to show this geothermal energy diagram to my son, as I’m not sure he’s aware of how it works. Thanks for sharing!
LikeLiked by 1 person
Yes geothermal and fusion are very promising clean energy that can provide on demand and baseload energy, but unfortunately they are not yet viable. Your son is truly amazing. Thank you Ada.
LikeLiked by 1 person
what is the impact to the energy sources with all the new big AI datacenters and can renewable energy ever keep those going ?
LikeLiked by 1 person
That is a good question. The big AI companies claim that they can provide 100% renewable energy for their operations, but what they mean is that they could produce as much renewable energy as the amount of energy that they consume. However, due to the intermittency of currently popular renewables (wind and solar) they need energy from other sources sometimes, and then make up for it later by producing more renewable than they use. well, unless they install a massive amount of batteries. However, there is also the issue with all the water they use.
LikeLiked by 1 person
Hi Thomas, this is interesting. As far as I recall, the iUS generates 60% of the world’s carbon emissions so what your administration is doing does effect everyone.
LikeLiked by 1 person
Well, it is not quite as bad as 60%. The US is the largest cumulative emitter of carbon at 34% largely because it indiustialized early. However, the current share of carbon emissions is about 13%, which is still more than average per capita since the US has 4.2% of the world population. China’s share of the world’s carbon emissions are between 30% to 35% but they have 18% of world’s population. India’s share of the world’s carbon emissions is around 7.5% to 8%, and they are also 18% of the world’s population so much less emissions per capita.
But you are right with respect to emissions the US administration effect everyone, like all of us do. I was more thinking about our administration’s ability to influence other countries energy policy. It is true that they can and do influence other countries energy policy, as well, but it does not seem to be very effective.
LikeLike
This is a thorough look at trends in energy generation, Thomas. I have been wondering what happened to the idea of reducing our need for energy, both through increased efficiency and simply choosing ways of life that require less energy. But in a world where infinite growth is the goal, I suppose that will never be a choice, until it is thrust upon us by the world itself.
I noticed a mention of AI data centres in another comment, and also wondered about their effects.
LikeLiked by 1 person
That is a very good thought. The economy in the US and in the world keeps growing. Everyone wants what we have in terms of wealth, and they are getting it, and the populations are growing, and we have data centers and also EVs which are becoming popular around the world also add to the demand for electricity. Reducing our need for energy isn’t going to happen. However, if all this energy becomes clean energy, we would be much better off. This isn’t going to happen soon, but unlike having less energy it is a viable scenario.
About the data centers, the big AI companies claim that they can provide 100% renewable energy for their operations, but what they mean is that they could produce as much renewable energy as the amount of energy that they consume. However, due to the intermittency of currently popular renewables (wind and solar) they need energy from other sources sometimes and then make up for it later by producing more renewable than they use. well, unless they install a massive amount of batteries. However, there is also the issue with all the water they use.
LikeLiked by 1 person
My son just bought a Tesla–self-driving–and I love the thing. The problem with electrical cars is electricity. It’s not dependable enough here in the US, why we had to buy a whole house generator in CA. You’ve seen that in Texas. But, The current administration is making some amazing moves to ramp up electrical power availability to meet demand. I’m pretty sure my next car will be a self-driving electric one.
LikeLiked by 1 person
Wow that is very interesting. Yes, access to EV charging is limited here in the US, unlike the Scandinavian countries. I’ve noticed that, and that is why I’d rather have a hybrid. But good for your son to be a pioneer. One big obstacle to the availability of electricity is that we have an outdated grid and getting powerlines as well as new energy plants (of any kind) approved is very difficult. Getting permit for a project and get it cleared for building takes 5 to 15 years (average 10 years). The queue for gas plants as well as renewable energy and power lines is enormous, and our population and economy and electricity needs keep growing. It is very good that they are making some amazing moves to ramp up electrical power availability to meet demand.
LikeLiked by 1 person
Interesting background. Thank you for that.
LikeLiked by 1 person
Thank you Jacqui. So called permitting reform has become a big deal in congress. Hopefully some more modern version of permitting rules will be passed in this congress.
LikeLiked by 1 person
Very helpful information, Thomas. Thank you for sharing this research. We’ve a long way to go.
LikeLiked by 1 person
Thank you so much for your very kind words Gwen
LikeLiked by 1 person
Good to know that progress is being made. At this point, hybrid would be best here in Canada, as there aren’t nearly enough charging stations, unlike the Scandinavian countries. Fusion power sounds intriguing! Thanks for another informative, educational Super Fact article, Thomas.
P.S. I agree with Lynette’s comments, especially in regards to the Trump administration.
LikeLiked by 2 people
Thank you so much for your kind words Debbie. Yes I’ve seen people struggle with getting their EVs charge while travelling. For the US and Canada it is probably best with hybrid like you say. That’s what we have. Fusion power would be gigantic progress once it becomes functional/viable. However, its been a couple of decades into the future for the last 50 years. Now some people are saying 10 years but we’ll see about that. It is great that you Canadians are standing up for yourself.
LikeLiked by 1 person
Most interesting, Thomas!
LikeLiked by 1 person
Thank you so much Chris
LikeLiked by 1 person
A powerful
Post and such a great breakdown with charts and data Thomas! You’re so write about the issue at hand of our current administration which truly mind boggling! Thanks for sharing your findings with us! 💕
LikeLiked by 2 people
Thank you so much for your kind words Cindy. I used the data and graphs from Our World in Data a lot in this post. However, Our World in Data is a very reputable source of data of all kinds and they make great interactive charts and it is all free to use (unlike for example Statista). That’s why I had so many charts in this post.
LikeLiked by 1 person
You never fail to amaze and you’re soooo welcome💕
LikeLiked by 1 person
Thank you so much for your kind words Cindy
LikeLike
Java Bean: “Ayyy, our Dada says he can’t even with the cartoonishly evil war on clean energy being waged by the current Administration! But apparently he can even since he is still here reading about it and complaining about it …”
LikeLiked by 1 person
Ha ha Java Bean. Your Dada is right. It is not only less good for the environment and climate but it is an obstacle to meeting our energy needs and it is putting us behind other countries when it is about developing the technology of the future. According to the economist 2025 was a great year for China, and it wasn’t so much because of what Xi did. Hopefully 2026 will not turn out the same.
LikeLike
Thanks for these great facts Thomas. Yes, the Orange one is bringing back fossil fuels. Insanity. Also, I wanted to add that AI sucks up a lot of water resources. It’s time for countries to up their solar energy games if they want to avoid coming shortages. 😊
LikeLiked by 1 person
Thank you so much Debby. You are right. Solar and wind still have issues with intermittency but you can use them a lot more than what we do without issue and they have become so cheap and they are so easy to build. We need the energy. You are also right about the data centers. It is not just energy. The other big issue is the water they use.
LikeLiked by 1 person