Scandinavian Mythology

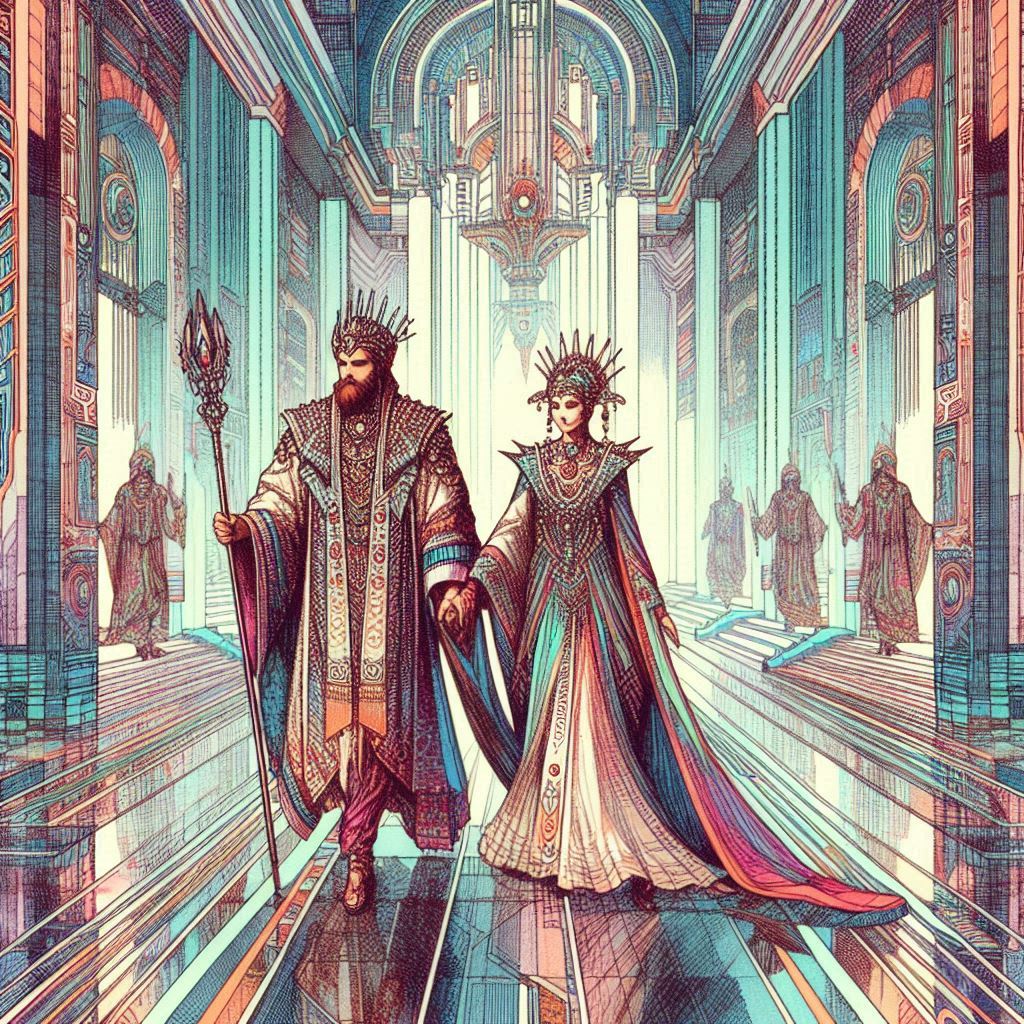
Since it is Halloween I thought I’d make a fun post (not a super fact) about Scandinavian Mythology or folklore. I live in Texas, but I am originally from Sweden so the various beings I’ll describe or mention below are beings that I grew up hearing about. When I was a kid, we kids used to scare each other with stories about these beings.

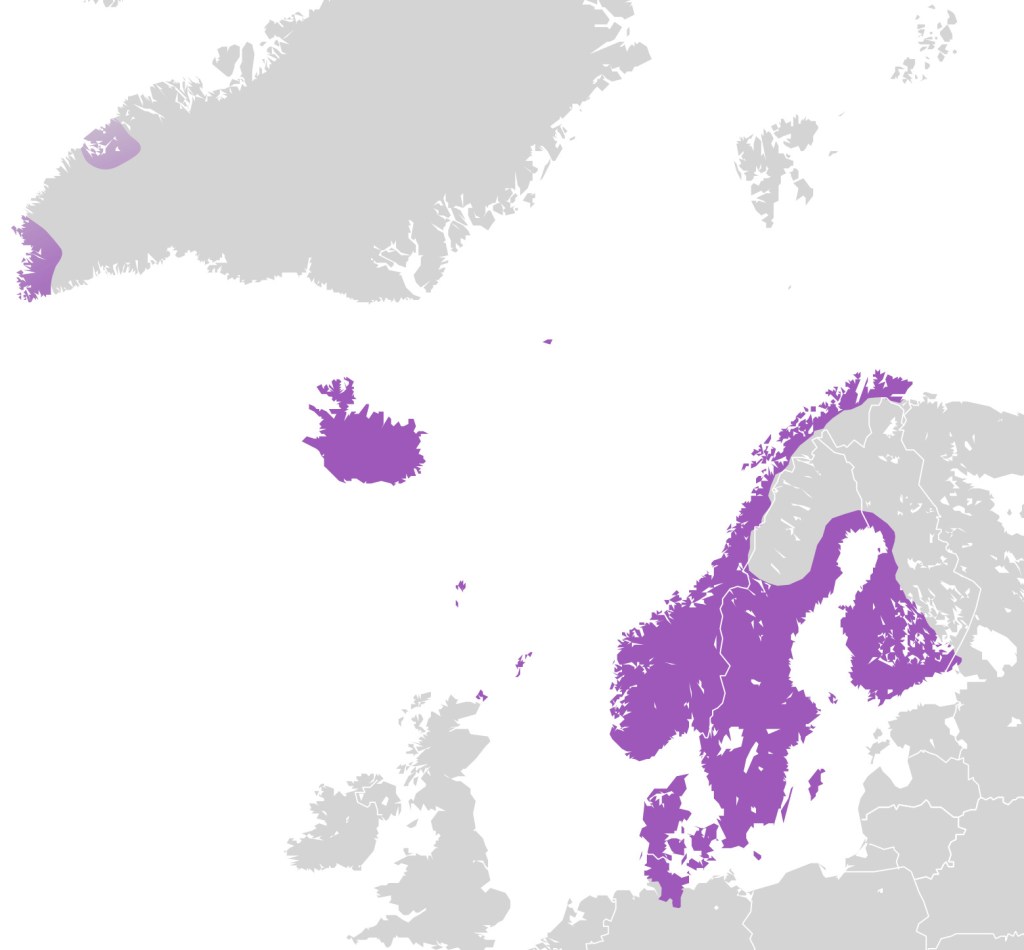
I should also point out that it is not ancient Viking mythology but more recent folklore that some people still believe in. I am focusing on Swedish folklore and Norwegian folklore since it is similar to Swedish folklore. Danish folklore is a little bit different, but it has many similarities to Swedish and Norwegian folklore. Denmark is a Scandinavian country, but the post would be too long if I included folklore that is specifically Danish.

I am providing one or more pictures for each being. These pictures are either in the public domain, for example via Wikipedia, or shutter-stock pictures (I have a subscription), or pictures I generated with the help of ChatGPT with varying success. The beings covered are Tomte, Vittra (Vitter folk), Elf, Skogsrå/ /Tallemaja/Huldra, Näcken/Fossegrim, Troll, Myling, Storsjö odjuret (the north Swedish equivalent of the Loch Ness monster), Kraken, and Skvader. Finally, Blodstämmare is not a being but a north Swedish magical practice that you use to remotely stop the blood flow in a person.
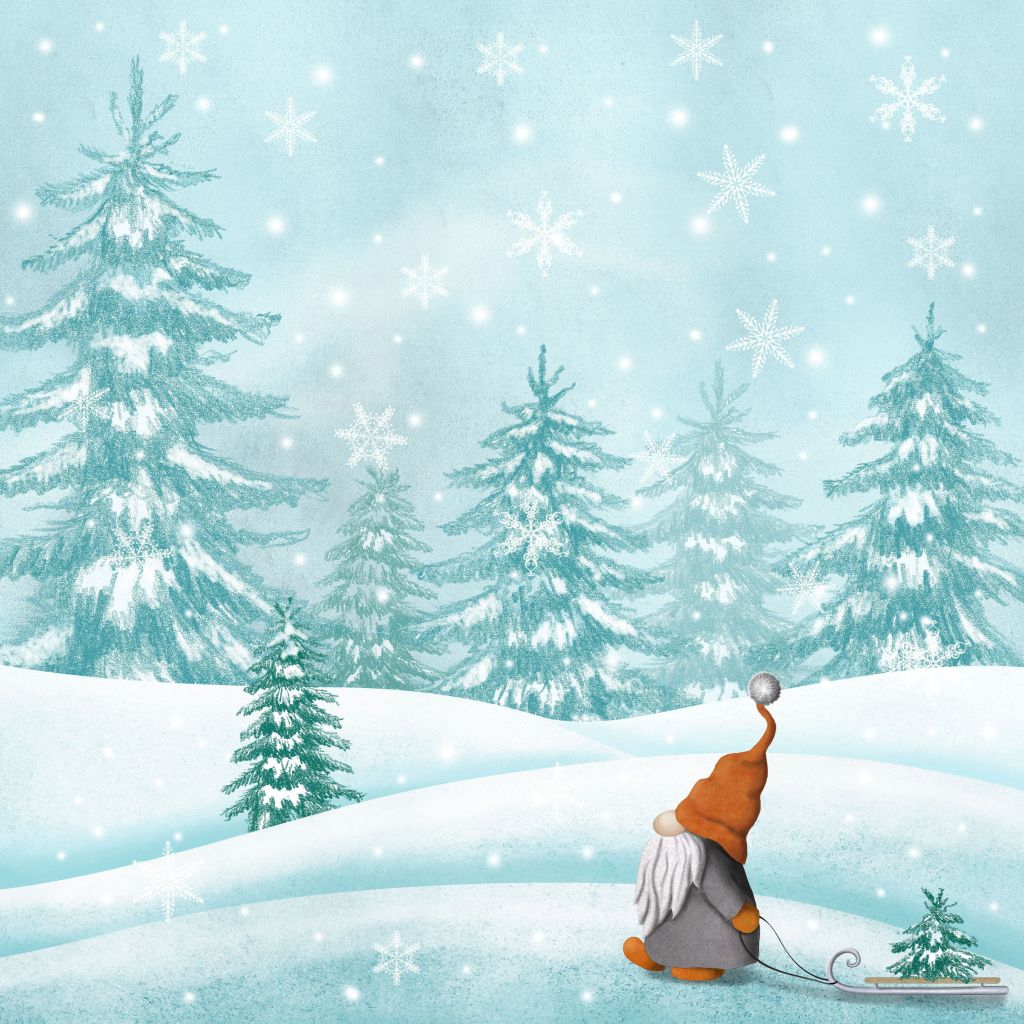
Tomte

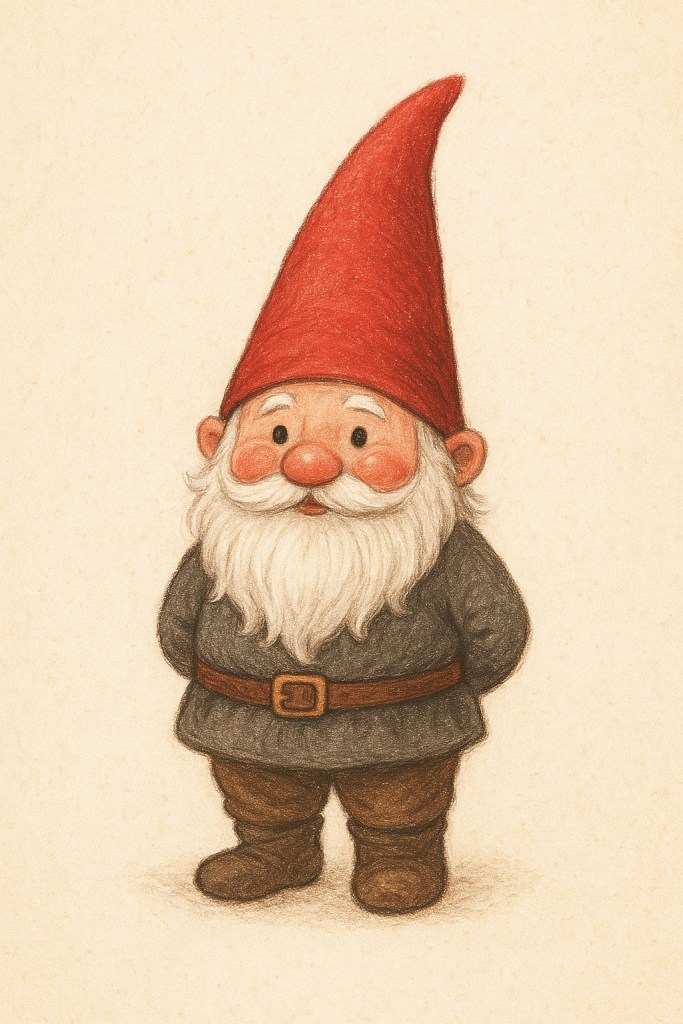
Tomtar (plural of Tomte) or Nisse in Norwegian is a type of small magical people, or gnomes, related to Vitter folk (described below). They are friendly and is the inspiration behind the Swedish version of Santa Claus, which is therefore a bit different from the Disney version of Santa Claus that has become so popular.

For one thing, the Disney version of Santa Claus works alone while delivering presents and therefore needs to move faster than the speed of light to cover all the good children. A Tomte may help you with your projects and duties if you are nice to them. They may help you with your farm and your animals, warn you of danger, and bring you gifts for Christmas if you in return put out food for them, such as porridge. As mentioned, there are many Tomtar, often one Tomte per house.

A Tomte wearing a red hat in a snowy winter forest. | Scandinavian Mythology
An illustration of a Tomte. Shutterstock ID: 2060057882 by PLIMPLUM.
An old illustration of a Tomte conversing with a sitting cat.
A Tomte or a Nisse, about as big as a cat, Erik Werenskiold, Public domain, via Wikimedia Commons
Tomte with a beard wearing a red pointed hat | Scandinavian Mythology
Tomte generated by ChatGPT

Vittra

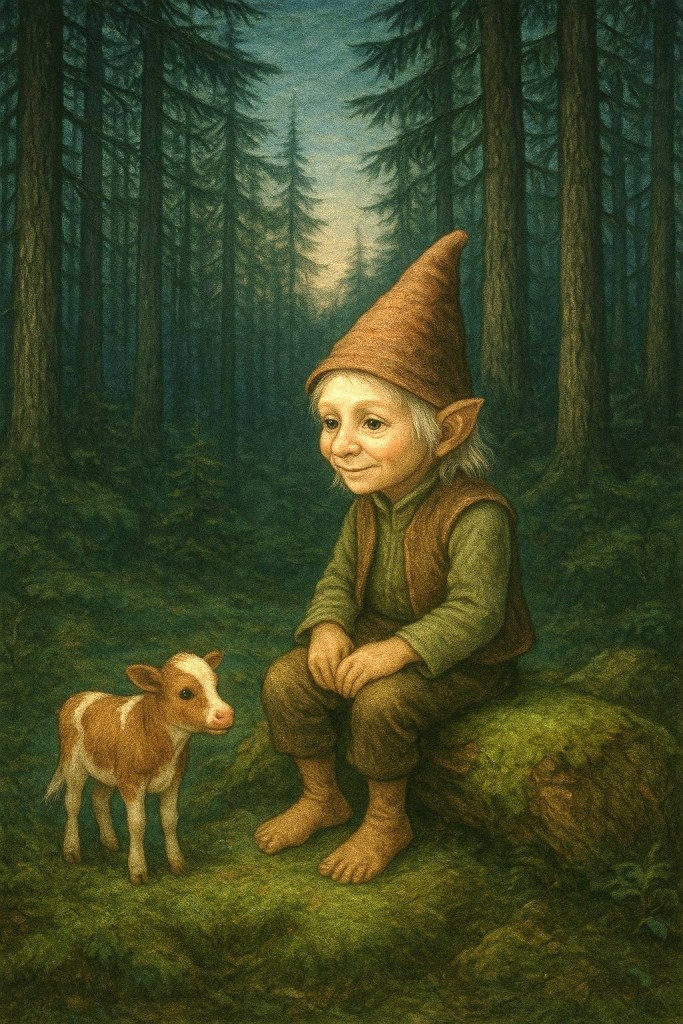
Vittra or Vitterfolk are supernatural spirits or small invisible people who have a lot in common with people as well as Tomtar. They own cattle and they sometimes interact with people. Usually, they stay out of your way, but if you hurt them, for example by throwing hot water out the window without warning them first, they may take revenge on you and burn down your house. Vittra are not evil but not friendly either.

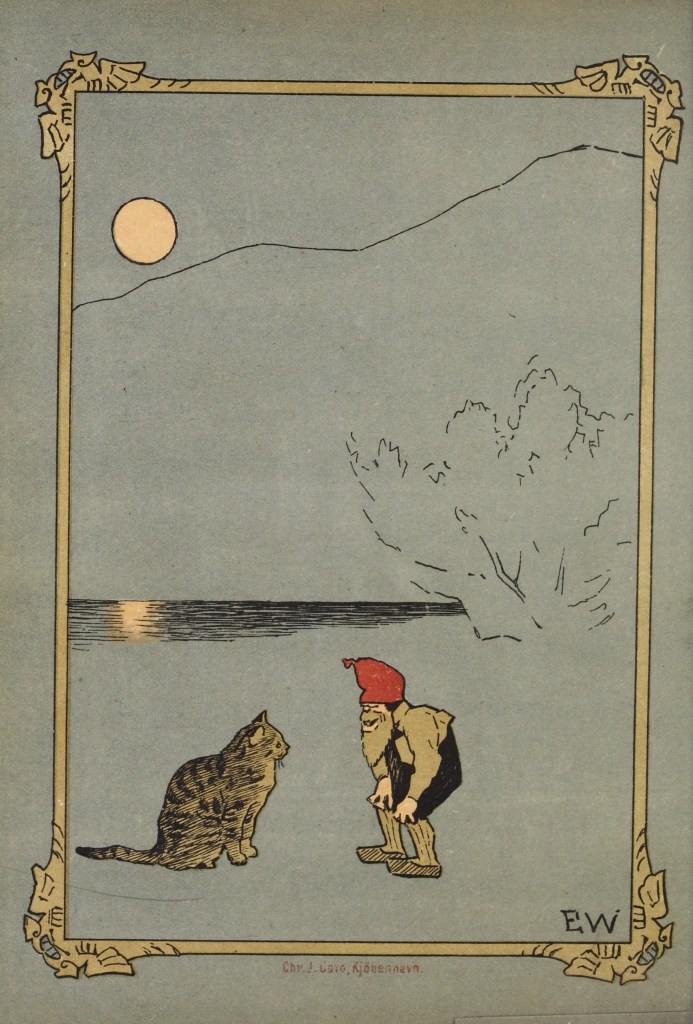
The belief in Vittra is especially prevalent in northern Sweden. On the Swedish island of Gotland, they are often referred to as “Di små undar jordi” in the Got/Goth dialect, or “De små under jorden” in proper Swedish, or “the small ones below ground” in English. They are sometimes depicted as looking similar to Tomtar, gnomes or elves, and sometimes as invisible, or near invisible little spirits. Below are some depictions of Vitter folk.
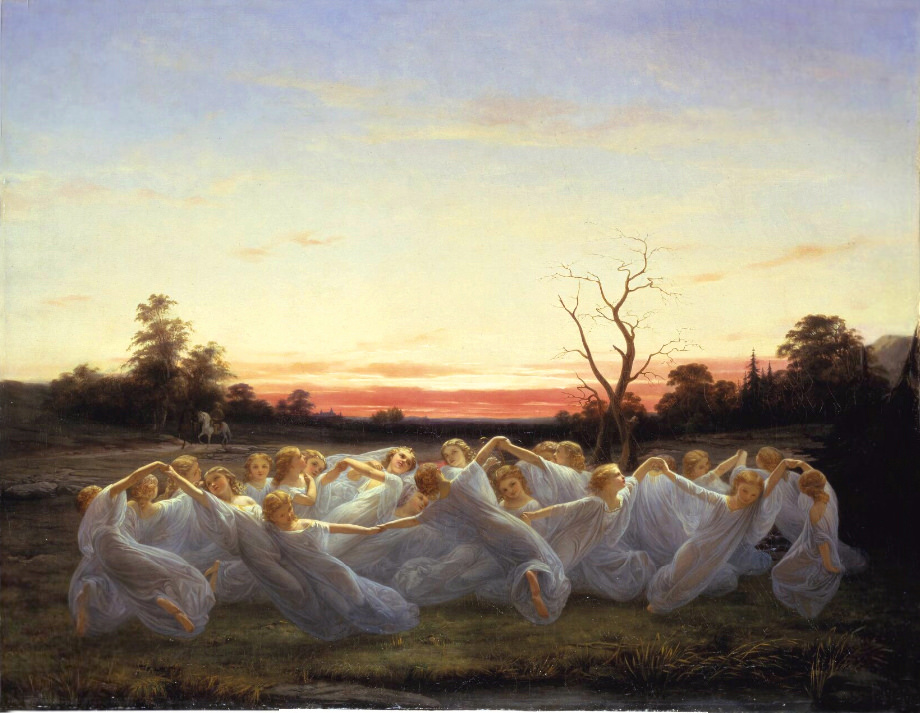
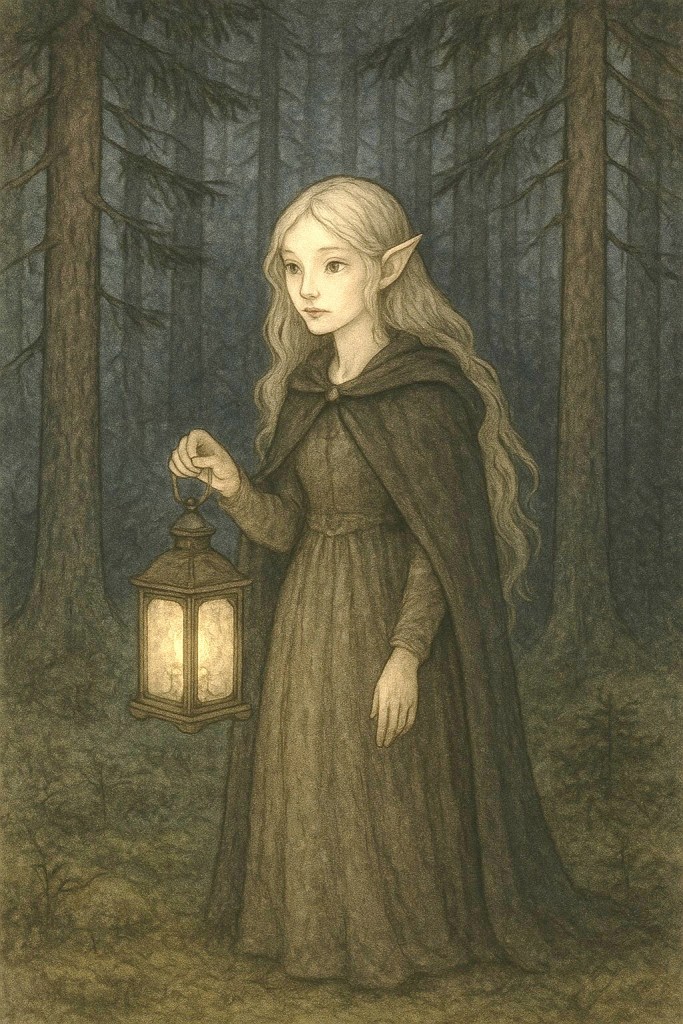
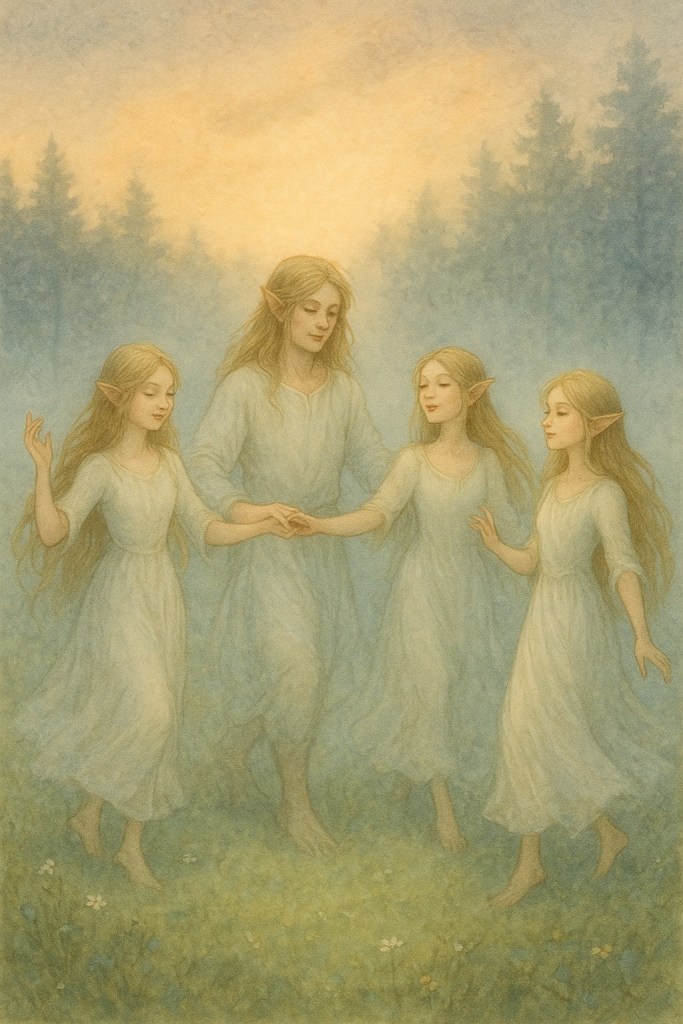
A Vitter is sitting on a log in the forest and baby cow is standing in front of him.
A Vitter and his mini calf. Generated with the help of ChatGPT

Elf

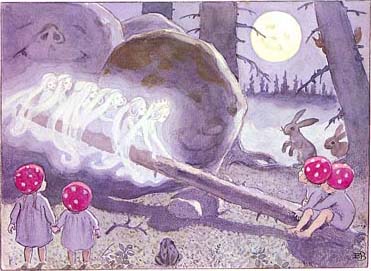
An elf, or elves in plural, is a type of human like supernatural being in Germanic folklore and especially Nordic/Scandinavian folklore. Since elves have been popularized around the world it is a well known being. In Scandinavian mythology they were initially often considered bad news but because of popular culture, such as Tolkien’s books, they have been redeemed into something positive. The first picture below is from a Swedish children’s book written in 1910. I read this book when I was a child. The wispy creatures are elves and the small kids with mushroom hats are Tomte children. In this book the elves are depicted in a Nordic pre-modern fashion, but they are nice.

Wispy spirit like elves are sitting on a log. The Tomte children are standing next to them and talking to them. The Tomte children are wearing red mushroom hats. | Scandinavian Mythology
Little älvor, playing with Tomtebobarnen. From Children of the Forest (1910) by Swedish author and illustrator Elsa Beskow. Elsa Beskow, Public domain, via Wikimedia Commons
Around 20 white dressed female elves are dancing on a meadow.
Ängsälvor (Swedish “Meadow Elves”) by Nils Blommér (1850). Nils Blommér, Public domain, via Wikimedia Commons.
A female elf in the forest. She is holding a lantern. | Scandinavian Mythology
A female elf that I generated with the help of ChatGPT
One male elf and three female elves standing in a clearing.
Four elves (one male, three females) standing in a forest glade. I generated this picture with the help of ChatGPT.

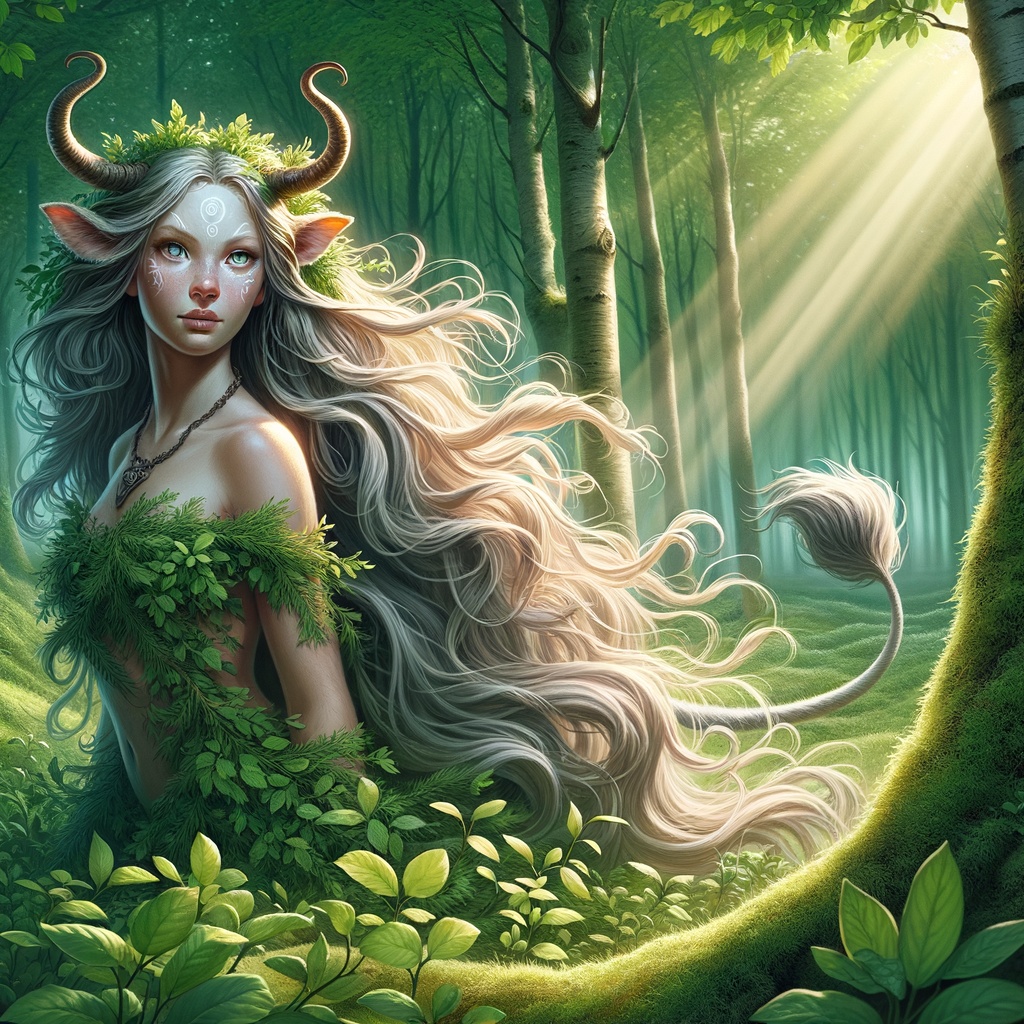
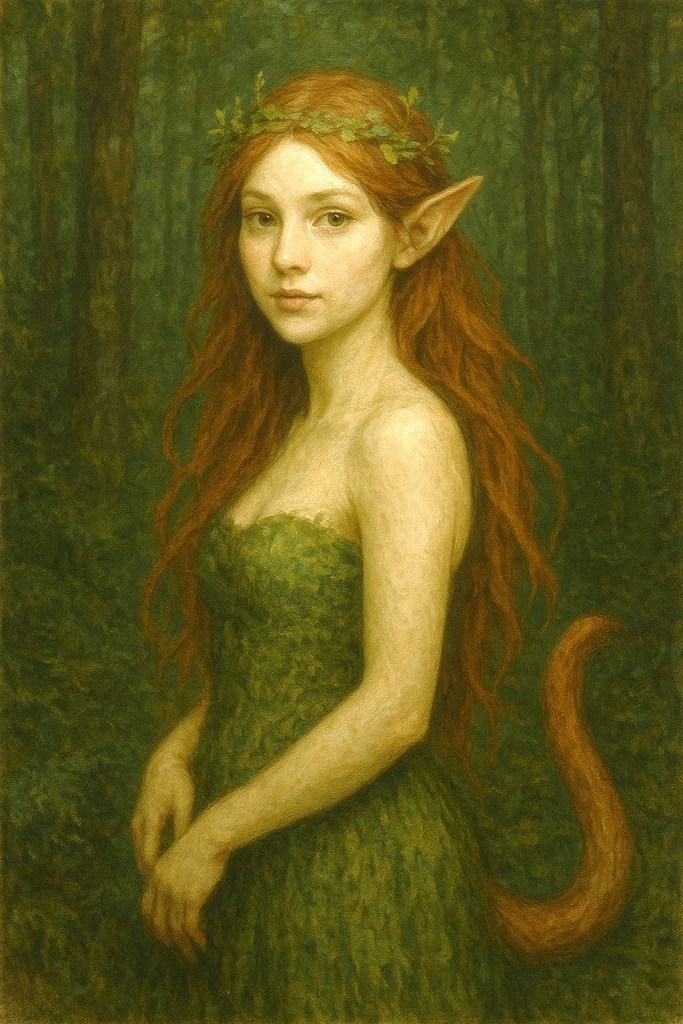
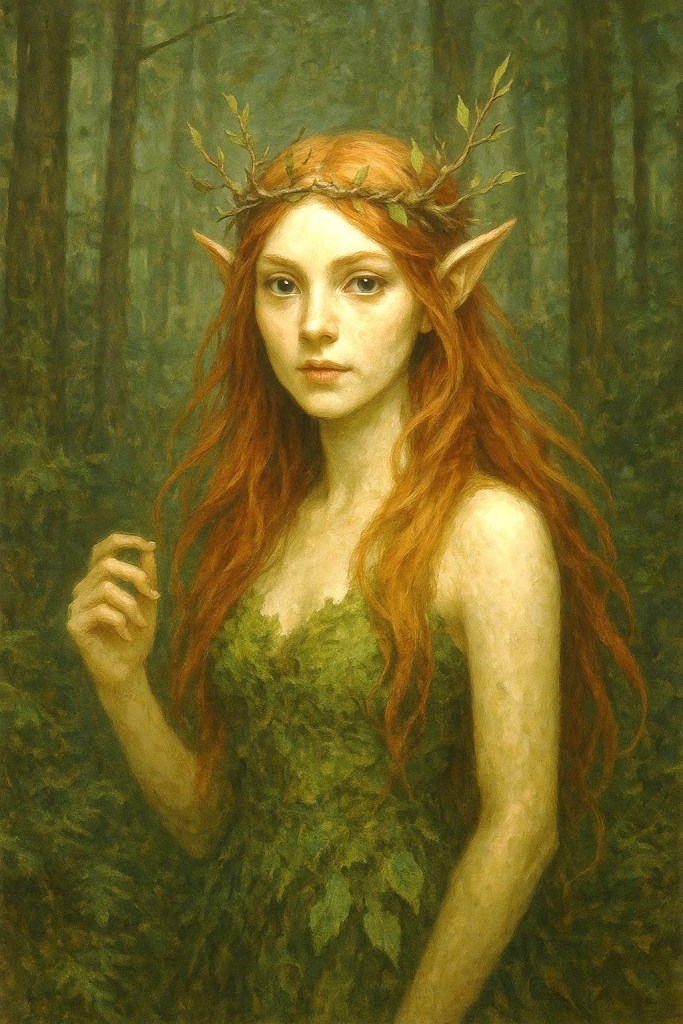
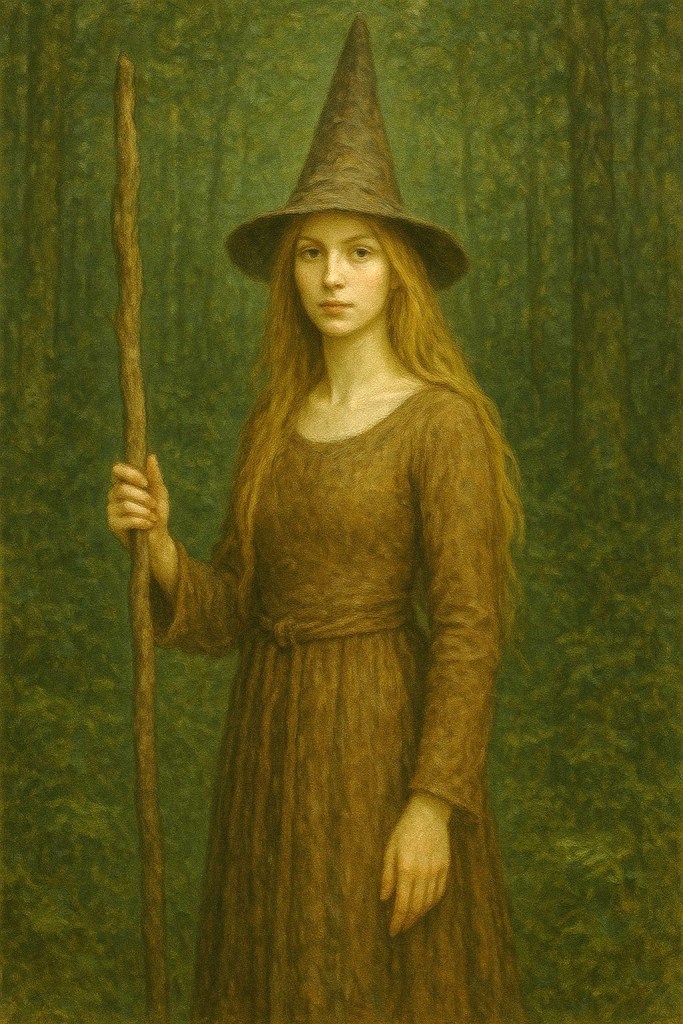
Skogsrå,  Tallemaja, Huldra

Skogsrå or Tallemaja in Swedish folklore is a seductive female creature who lures men with her beauty or beautiful singing and then kills the men. The Skogsrå / Tallemaja typically has a tail and a hollowed out back, which you can’t see if you are facing each other. In Norwegian this creature is called Huldra (Hulder in plural).

It should be noted that I read that if you meet a Huldra in the forest and you treat her with respect she will not kill you. She would just enjoy your company for a while, talk to you, sing to you, show you the beauty of the forest, and then she would let you go. It is only the rude and selfish men who don’t respect her boundaries whom she kills.

An image AI-illustration of a Huldra
Imagining how a Huldra would look like. Stock AI-generated image ID: 2400845203 by Shutterstock AI Generator.
Two lightly dressed huldras / nymphs resting by a creek in the forest. | Scandinavian Mythology
Huldra’s Nymphs (1909) by Bernard Evans Ward, Public domain, via Wikimedia Commons
A Tallemaja with pointed ears and red hair. She is wearing a green dress, and she is standing in the forest.
A Skogsrå, Tallemaja or Huldra that I generated with the help of ChatGPT
A Skogsrå with pointed ears and red hair. She is wearing a green leafy dress, a crown of leaves, and she is standing in the forest. | Scandinavian Mythology
Another picture of a Skogsrå, Tallemaja or Huldra that I generated with the help of ChatGPT.
A Tallemaja with long hair. She is wearing a brown dress, a pointy hat, and she is standing in the forest.
A Tallemaja that I generated with the help of ChatGPT.

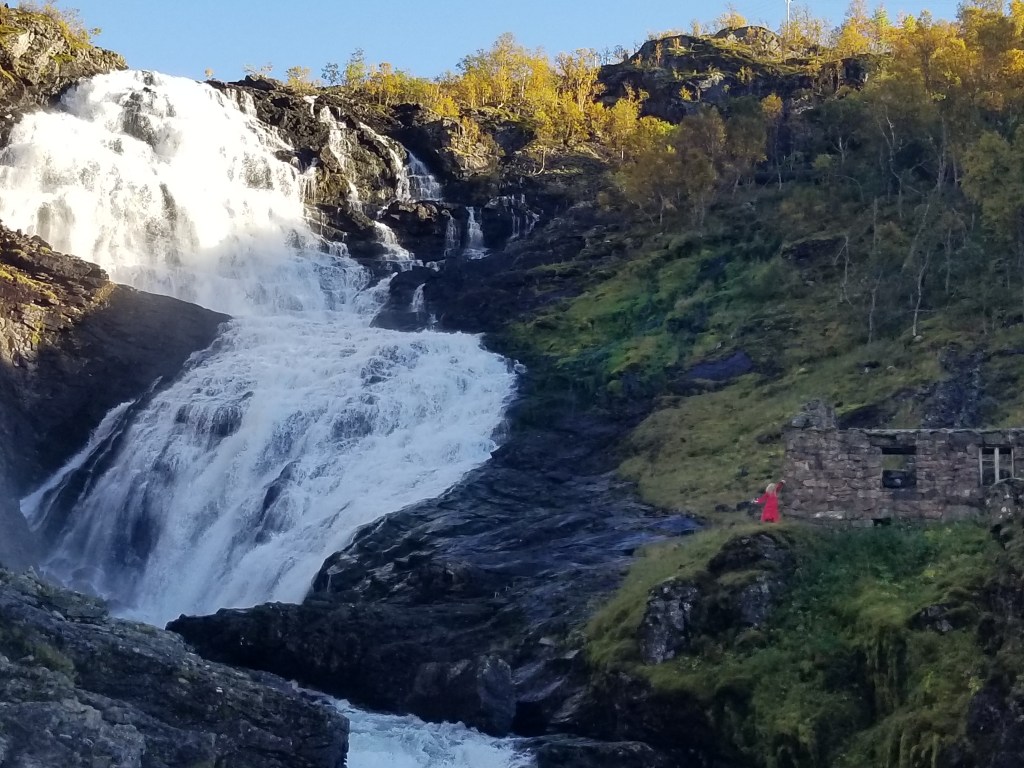
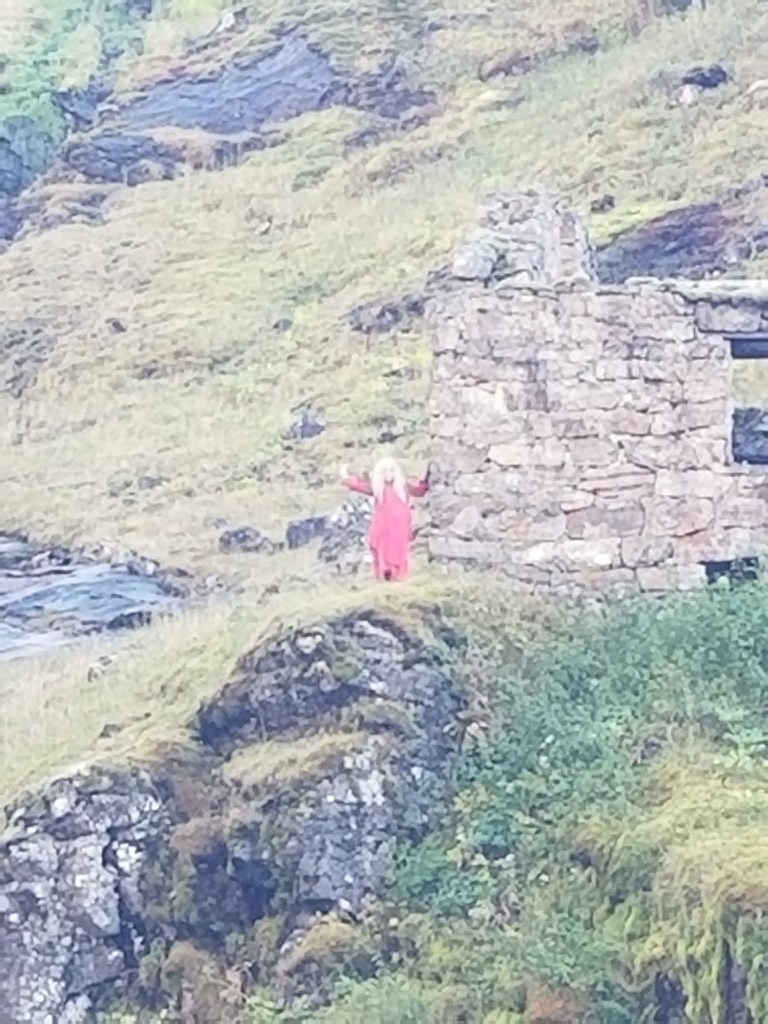
Last summer (a bit more than one year ago) we visited Sweden and Norway. One day we took a tour into the Norwegian mountains and fjords. We took a two-hour cruise on Sognefjord and after the cruise we took a train to the top of the surrounding mountains. Along the way we encountered a Huldra by a waterfall. She sang to us in her beautiful voice, and she seduced us all, both men and women, to take photos of her with our phones and posting them on social media. It was a tourist ploy of course. You can read more about our trip here .
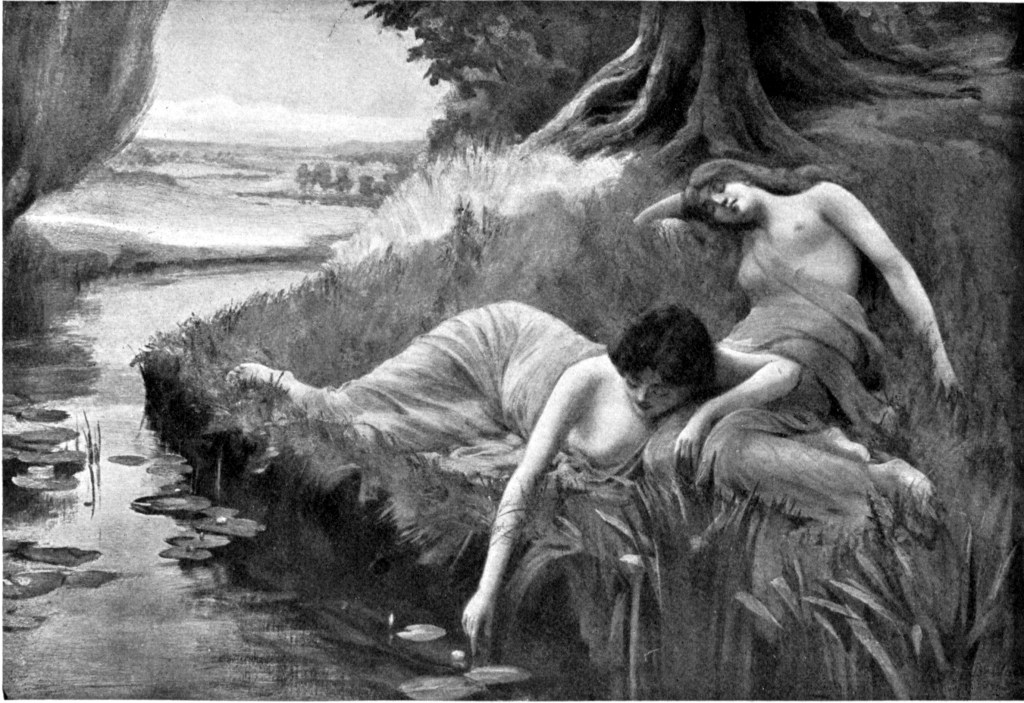
A waterfall in the mountains. A woman in a red dress is standing to the right of the waterfall.
My photo of the Huldra (in red) by the waterfall in the Norwegian mountains. She seduced us all into taking photos of her for Facebook. Her seductiveness was feared in medieval times, but in modern times we refer to the seductiveness of the Huldra as a “tourist trap”.
Blurry image of a Huldra dressed in red standing on a mountain side. | Scandinavian Mythology
A close up of the Huldra we encountered. Sorry, my phone camera is the best and it was at a distance.

Näcken, Fossegrim

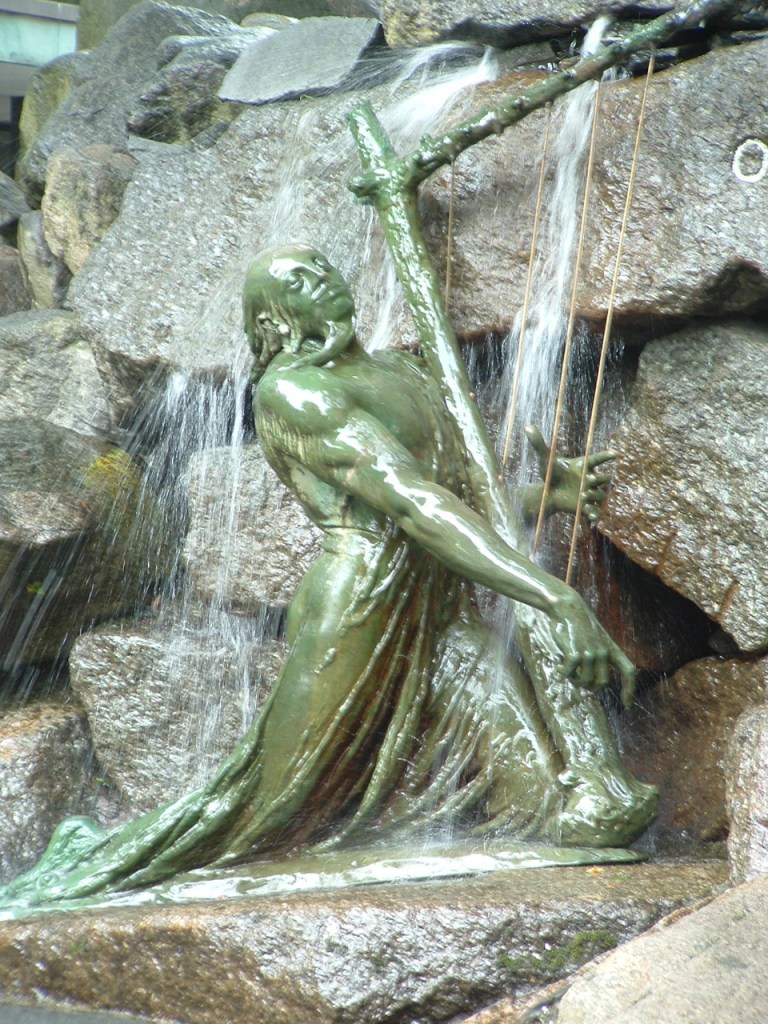
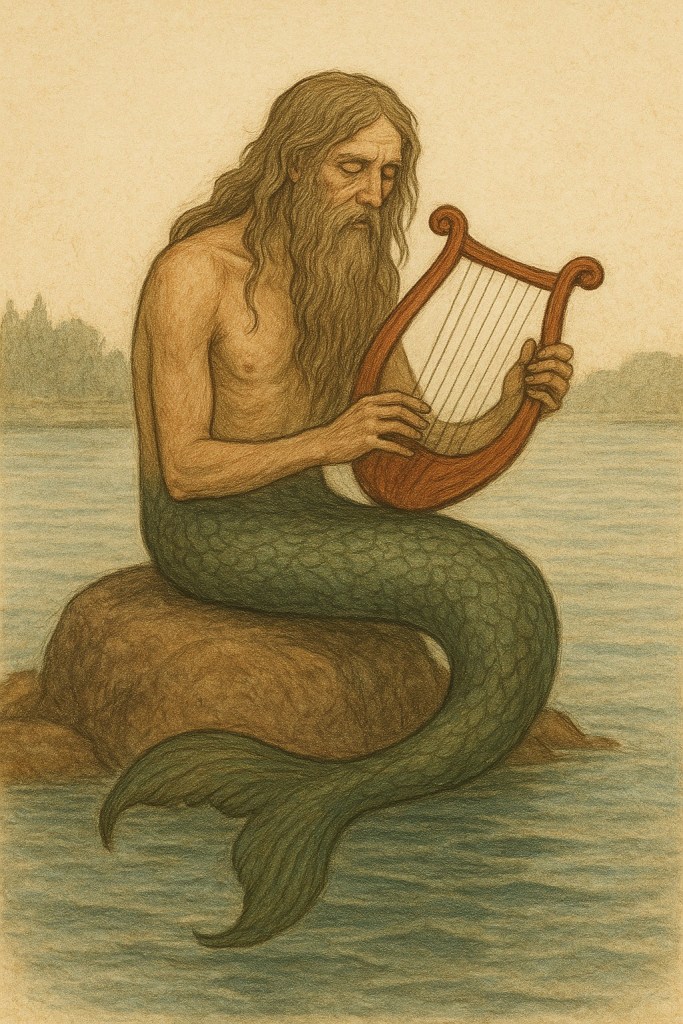
Näcken, Strömkarlen, or Fossegrim in Norwegian is a male creature who lives by the water, creeks, rivers, ponds and lakes. He plays a harp or a violin He lures children and others to their death. In southern Sweden (Scania) he seduces people by skillfully playing a violin thus creating irresistible music.
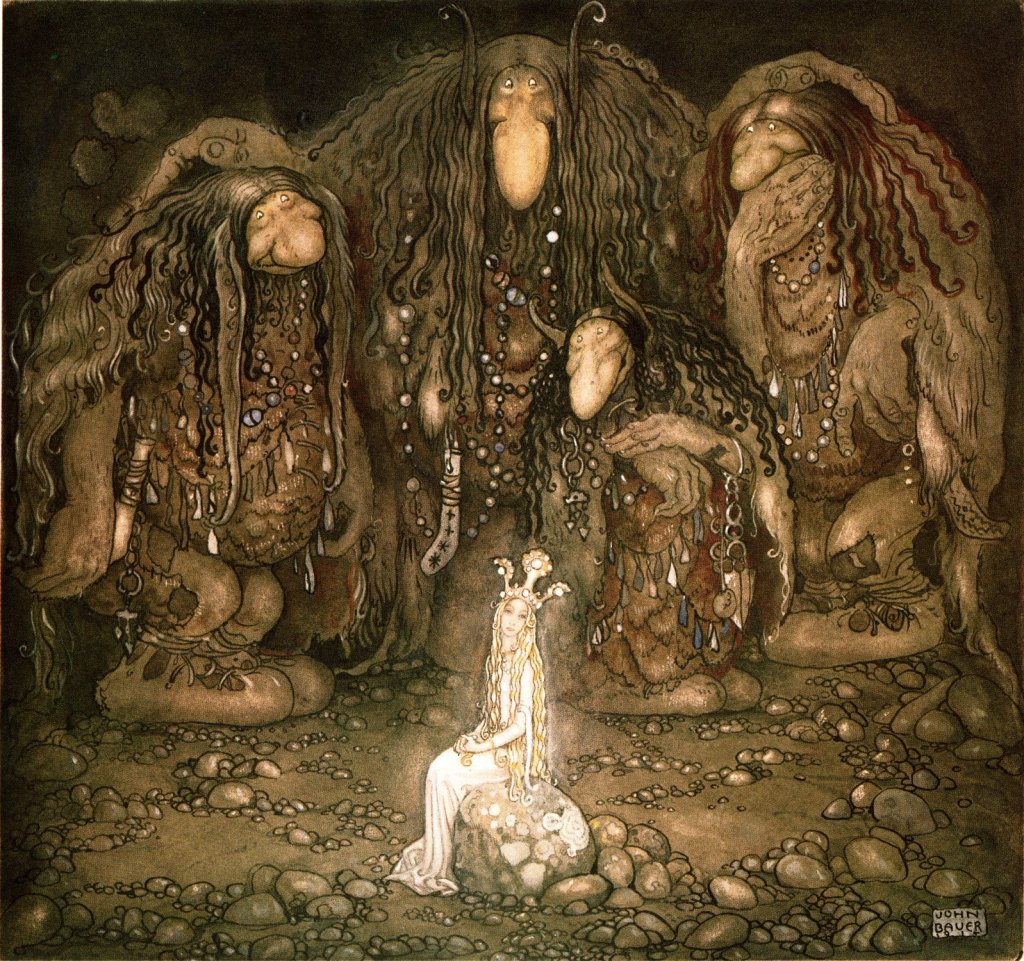
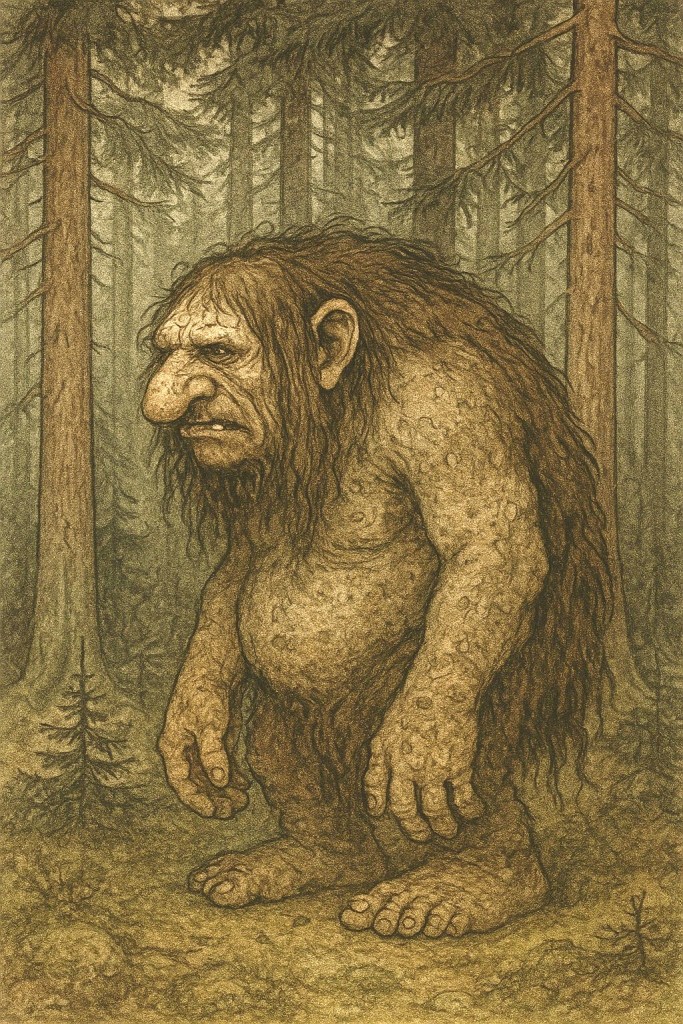
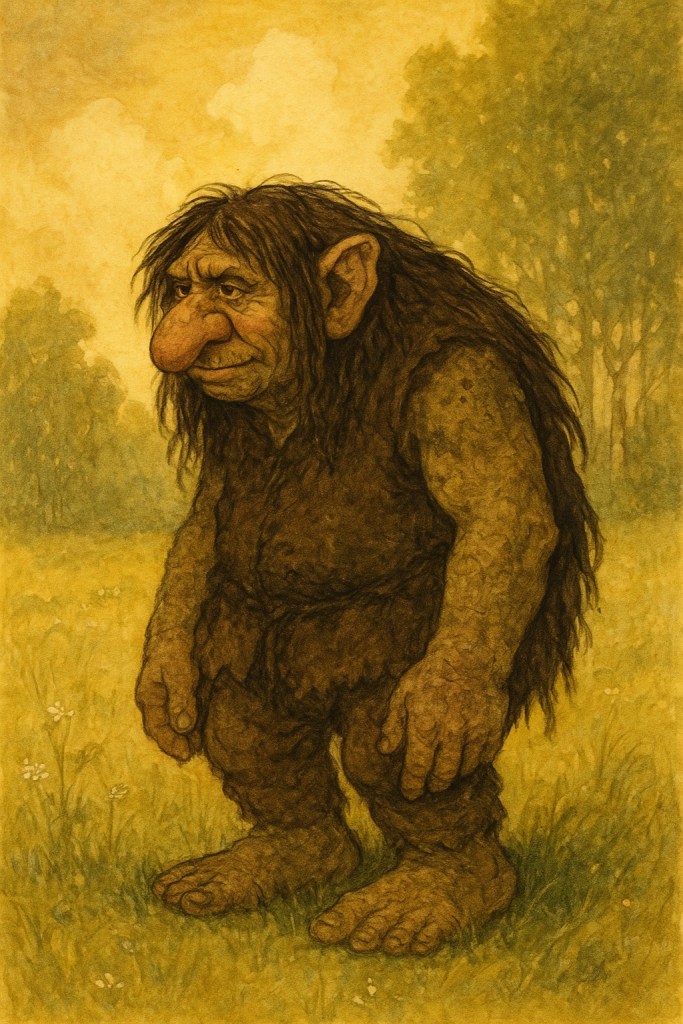
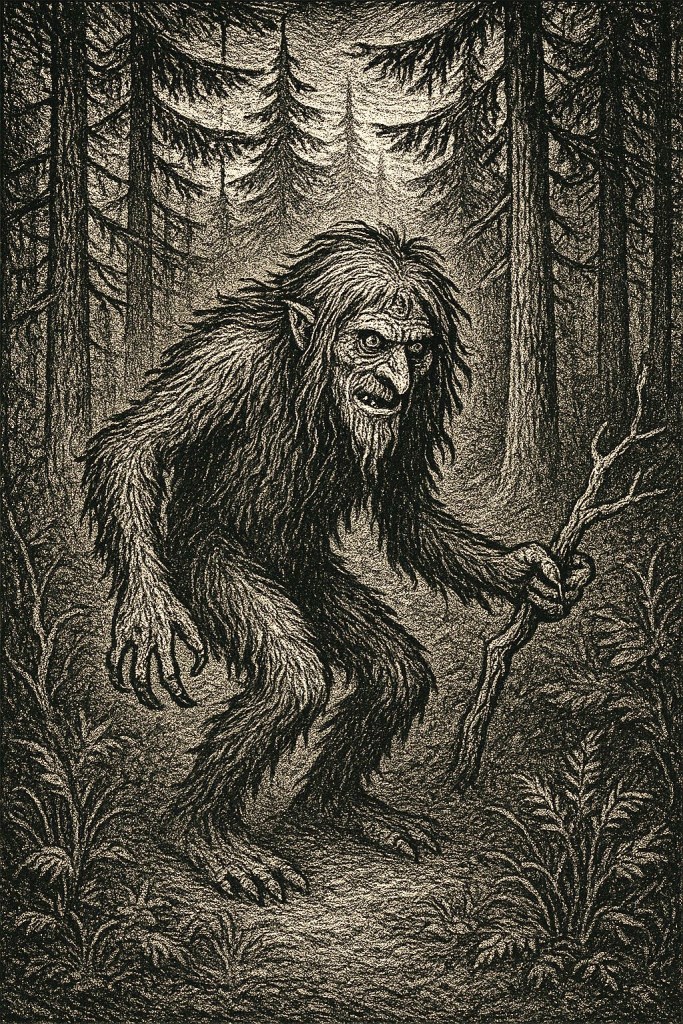
Greenish statue of Fossegrim standing in a small waterfall playing a harp. | Scandinavian Mythology
Bjørn som tegner, CC BY-SA 3.0 <https://creativecommons.org/licenses/by-sa/3.0&gt;, via Wikimedia Commons
Näcken or Strömkarlen is sitting on a rock in a creek playing a harp. | Scandinavian Mythology
A picture of Näcken that I generated with the help of ChatGPT

Troll

Troll, or Trolls in plural, are large ugly creatures with magical powers. They typically live in caves and sunlight is dangerous to them. They are typically hostile to humans and may kidnap people, including children, to work in their mines. Trolls are called Trolls in both Swedish and Norwegian.
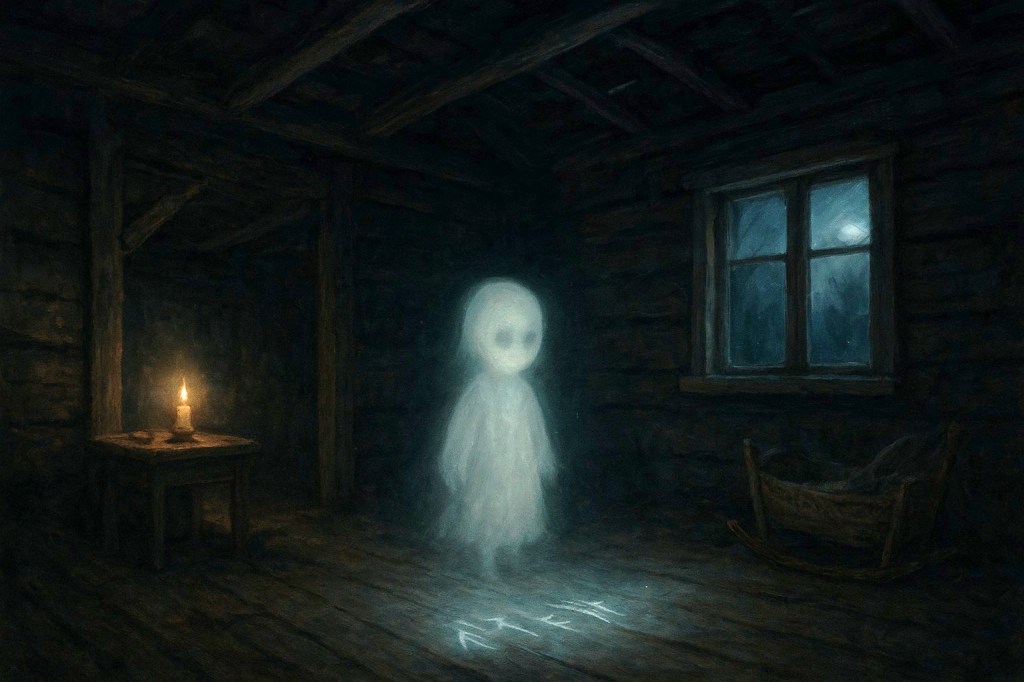
Four big Trolls sitting next a shiny white female elf.
Look at them, troll mother said to the elf girl. Look at my sons! You won’t find more beautiful trolls on this side of the moon. (1915) by John Bauer. John Albert Bauer (4 June 1882 – 20 November 1918) was a Swedish painter and illustrator. wikipedia public domain.
A troll standing in the forest
A picture of a troll that I generated with the help of ChatGPT
A troll standing in the forest | Scandinavian Mythology
Another picture of a troll that I generated with the help of ChatGPT
A very ugly troll standing in the forest
A picture of a troll, a slightly different style, that I generated with the help of ChatGPT

Myling

Before modern contraception, infanticide was one way for parents to limit the number of children they had. Unwanted and out of wedlock children were often killed. It is part of our human dark history. These babies were not baptized and in old Scandinavian mythology they became restless spirits seeking revenge on the mother or both parents. Alternatively, they caused mischief until they could convince someone to at least bury them properly. These restless baby spirits are referred to as myling or mylingar in plural.
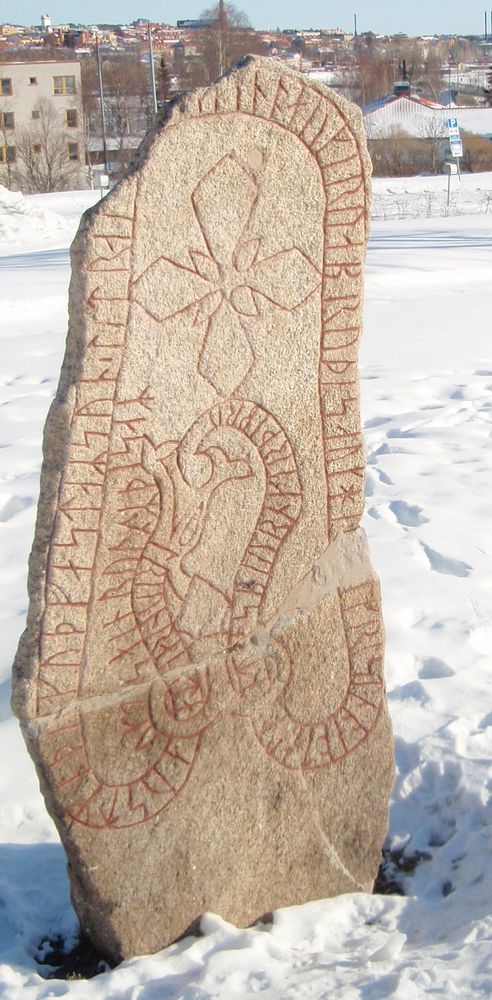
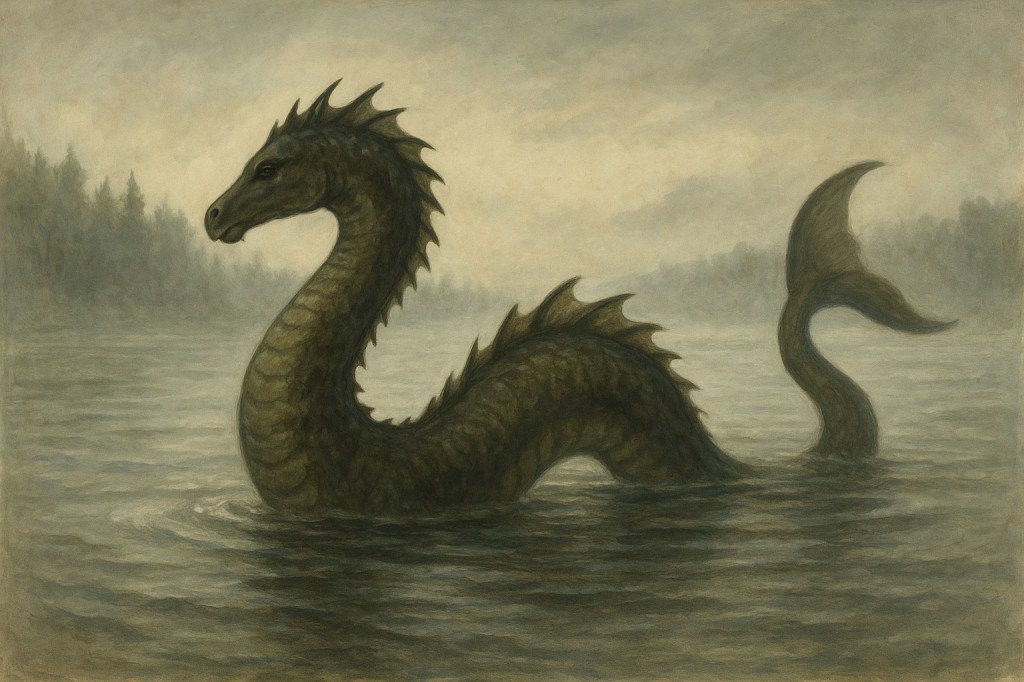
A myling in the middle of a room of a cottage. The myling looks like a small shiny ghost. It is dark in the cottage and there is a window and a candle. | Scandinavian Mythology
A picture of a myling that I generated with the help of ChatGPT

Storsjö odjuret

Storsjöodjuret is a large sea serpent like Swedish lake monster like the Loch Ness monster. It resides in a lake in northern Sweden. The English translation of Storsjö odjuret is the monster of the Great Lake. Storsjö / Great Lake is not far from where I grew up. I should say this monster has been hundreds of times since 1635 and seems to have been depicted on a rune stone from the 11th century.
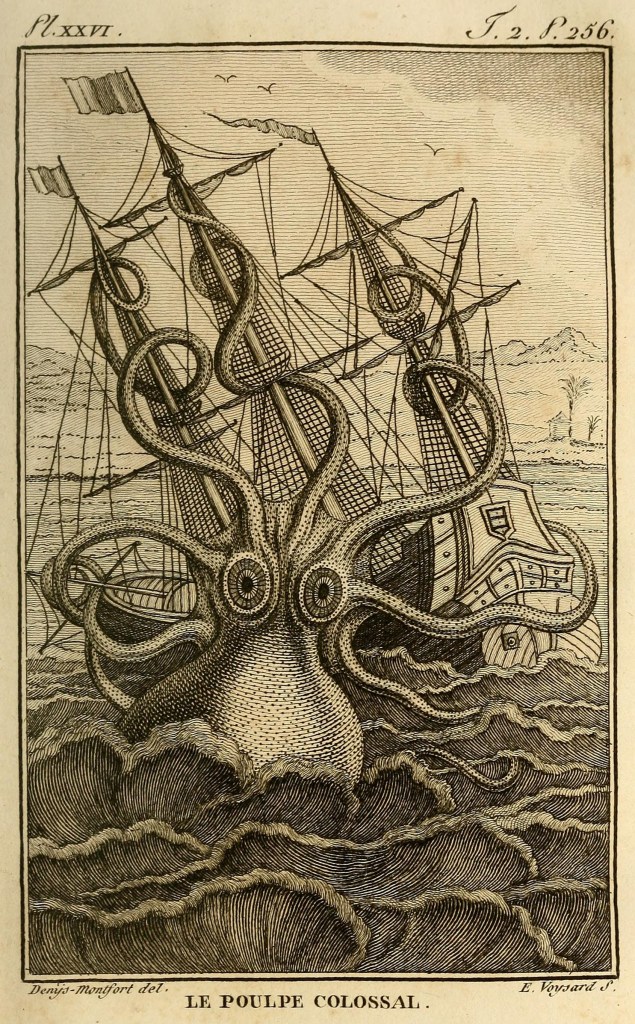
A runestone with runes and a picture of snake like creature.
The Frösö Runestone from the mid-11th century. Frösö is an island located in the middle of Storsjö. In the legend from 1635 Storsjöodjuret is said to be the serpent depicted on the stone. Andreaze, Public domain, via Wikimedia Commons
Depicted is a large sea serpent like creature with a horse like head and a fish tail. | Scandinavian Mythology
A picture of storsjoodjuret that I generated with the help of ChatGPT

Kraken

Kraken is a gigantic octopus that can bring down entire ships. It is more of a Norwegian creature but also Swedish.

An old illustration of a giant octopus climbing all over a ship.
Pierre Denys de Montfort (1766–1820) / Étienne Claude Voysard (1746–1812.), Public domain, via Wikimedia Commons

Skvader

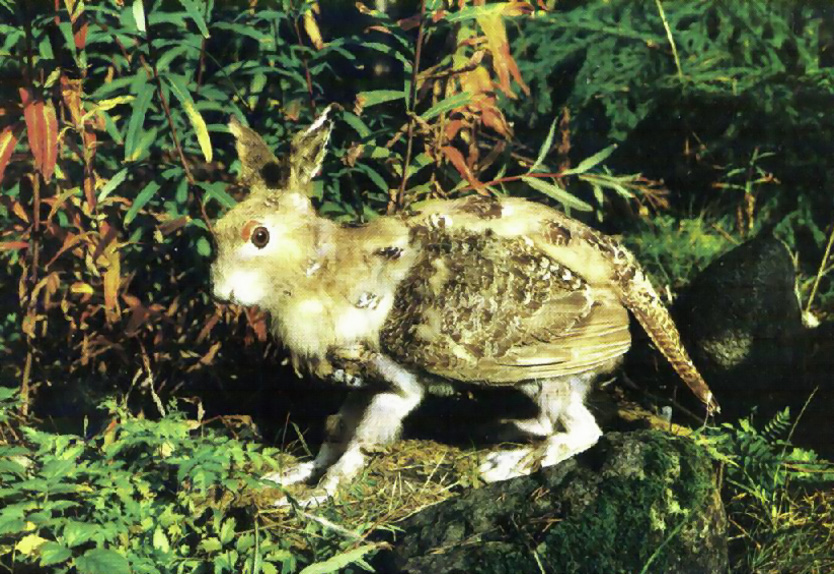
The skvader is a Swedish fictional creature that looks like a mix of a wood grouse and a hare. It started with a taxidermist creating a mixture of the two animals, taking a photo, and a rumor spread that it was real. I am remember watching debates on Swedish TV on whether the creature was real or not. People love to believe strange things. Yet another reason we scientifically valid evidence.

A photo of animal that looks like a mix of a wood grouse and a hare.
Unknown photographer, Copyrighted free use, via Wikimedia Commons

Blodstämmare

This is not a creature but a very common superstition in northern Sweden. There are people, blodstämmare, who can stop the flow of blood by uttering magical phrases while focusing their minds on the person in question. This power is usually used for helping people who are bleeding. It can also be used for evil, like black magic, to stop the blood flow in someone’s heart. This superstition is based on Sami (indigenous north Scandinavian people) Shamanism and north Swedish Christian fundamentalism (Laestadians). It is respected enough that some north Swedish hospitals have used blodstämmare in emergency situations.

The father of a close friend of mine called a blodstämmare when he had a bad nosebleed, and it worked. I know anecdotes are not valid scientific evidence. It is just a good story.

Happy Halloween


To see the Super Facts click here

We Exploded Thousands of Nuclear Bombs

Super fact 48 : Since 1945 we have set off more than 2,000 Nuclear Bombs corresponding to a yield of an estimated 42,000 times that of the Hiroshima Bomb.

According to the Arms Control Association there’s been 2,056 nuclear bomb tests. According to the UN there’s been more than 2,000 nuclear bomb tests, and according to Wikipedia there’s been 2,121 nuclear bomb tests, totaling 635 Megaton. Using the typical yield estimate for the Hiroshima bomb of 15 Kiloton that corresponds to more than 42,000 Hiroshima bombs. I think most of us know about the Hiroshima and Nagasaki bombs and we know about nuclear testing. However, I think the number of tests and the large total yield will come as a surprise to many, at least it was a surprise to me. That is why I consider this a super fact.

Atomic bomb explosion in a city - nuclear attack on a crowded city – 3D rendering of a mushroom cloud encompassing a city with skyscrapers | We Exploded Thousands of Nuclear Bombs
Nuclear bomb dropped on a big city. Shutterstock, asset id: 2188083835 by CI Photos.

Nuclear Landscaping

It may also come as a surprise that many of these tests were not for military purposes. Another usage for nuclear bombs is nuclear landscaping. Towards the end of the 1950’s the existing Panama Canal was thought to be insufficiently large and some people, including Edward Teller, the father of the Hydrogen bomb (Thermonuclear bomb), suggested that a new wider and deeper canal could be built simply by using nuclear bombs to blow multiple huge holes across Panama. The US was also interested in creating a new harbor in Alaska using nuclear bombs.

Thus, Project Plowshare was created to achieve this. As part of the Project Plowshare 35 nuclear warheads were detonated. The Soviet Union also had a similar program named “Nuclear Explosions for the National Economy” that included 124 nuclear bomb tests. Due to concerns over radioactive fallout the nuclear landscaping projects were eventually put to rest. The last Plowshare detonation was on May 17, 1973. The book Atomic Awakening by James Mahaffey recounts the history of nuclear testing and nuclear landscaping in greater detail.

An enormous nuclear bomb explosion in the dessert featuring a huge mushroom cloud.
Hydrogen bomb test by Alones Shutterstock Asset id: 2194195335.

Project Orion

Another non-military use of nuclear bomb testing was Project Orion. Project Orion was a study conducted from 1956 to 1964 by the US Air Force, NASA, and DARPA into the viability of a nuclear pulse spaceship that would be directly propelled by a series of atomic explosions behind the craft. A thick steel pusher plate would catch the blast and accelerate the ship forward.

The “Pascal B” shot in Operation Plumb Bob in 1957 was the first nuclear weapons test of the pusher concept. The Limited Test Ban Treaty of 1963 made it difficult to continue with the project. According to the book Atomic Awakening, if the design had been successfully completed, we could have created an interstellar spaceship that could have taken a crew and a large load to other planets and stars.

I can add that According to Atomic Awakening, in addition to Nuclear Landscaping and Project Orion, Nuclear Blasts were a tourist attraction.

Number of Nuclear Tests by Country

Below is a list of countries and the number of nuclear tests that they’ve performed according to the Arms Control Association and Wikipedia.

  • The United States – 1,030 – According to Wikipedia – 1,032
  • The USSR/Russia – 715 – According to Wikipedia – 727
  • France – 210 – According to Wikipedia – 215
  • United Kingdom – 45 – According to Wikipedia – 88
  • China – 45 – According to Wikipedia – 47
  • North Korea – 6 – According to Wikipedia – 6
  • India – 3 – According to Wikipedia – 3
  • Pakistan – 2- According to Wikipedia – 2

However, it should be noted that partially due to nuclear arms control legislation such as; the Limited Test Ban Treaty (LTBT): Signed in 1963,  the Threshold Test Ban Treaty (TTBT): Signed in 1974, and the Comprehensive Nuclear-Test-Ban Treaty (CTBT) opened for signing in 1996, the number of nuclear tests have been significantly reduced. This is illustrated by the graph below from Our World in Data. The last nuclear test was done by North Korea in 2017.

The histogram graph shows how many nuclear tests took place each year since 1945. The different countries, the portion by each country, the US, USSR/Russia, France, United Kingdom, China, North Korean, India, and Pakistan are colored differently. The histogram shows the 1961 was the year when most nuclear tests took place. The vast majority of the tests took place between 1950 and 1990 | We Exploded Thousands of Nuclear Bombs
Data Source: Arms Control Association (2024). OurWorldInData.org/nuclear weapons.

Tsar Bomba

The biggest nuclear bomb ever exploded was RDS-220, or AN602, or Tsar Bomba. It was detonated by the Soviet Union on October 30th, 1961, on the arctic island of Novaya Zemlya, and yielded more than 50 Megaton. In other words, it was 3,300 times more powerful than the Hiroshima bomb. According to Atomic Awakening, windows in Finland 1,900 kilometers (1,180 miles) away shattered. There are no cities large enough to match the size of the explosion. This is the kind of bomb that could obliterate states or small countries.

Tsar Bomba was a so-called thermonuclear device, or a hydrogen bomb as they are typically called. Hydrogen bombs are much more powerful than fission bombs, such as Uranium bombs or Plutonium bombs. To read my related post called “Ukraine Gave up Thousands of Nuclear Warheads” click here.

Russian Tsar Bomba mushroom cloud rising high above the clouds. High quality photo realist ( 3d make ) | We Exploded Thousands of Nuclear Bombs
This is an illustration of the Tsar Bomba explosion by by mbafai Shutterstock Asset id: 2208486661. To see a photo of the actual Tsar Bomba explosion click here (it is copyrighted).

Would you pay to watch a Nuclear Bomb Test? (Nuclear Bomb Test Tourism)


To see the other Super Facts click here

Gustav Vasa

Image above by Kevin from The Beginning at Last

Today, June 6 is the National Day of Sweden (or the Independence Day of Sweden). Gustav Vasa, or Gustav I, Sweden’s hero king and the father of modern Sweden, was elected king of Sweden on June 6th, 1523. This was after the Swedish War of Liberation from Denmark 1521 to 1523. Gustav rose to lead the Swedish War of Liberation following the Stockholm Bloodbath, where his father was executed.  Gustav Vasa or Gustav I was King of Sweden from 1523 until his death in 1560. Since I am originally Swedish (now living in Texas) June 6 is a significant date for me.

In the picture there muscular man holding up crown | Gustav Vasa
This picture is how I imagine Gustav Vasa at his coronation. BTW this is a submission for Kevin’s No Theme Thursday
A bearded king and his queen are marching down the middle of beautiful large building, perhaps a cathedral or a castle | Gustav Vasa
This is how I imagine Gustav Vasa’s marriage to Catherine of Saxe-Lauenburg on September 24th, 1531. This picture is also from Kevin’s No Theme Thursday

Depictions of Gustav Vasa

Kevin’s pictures above were, like I said, how I imagine Gustav Vasa. The depictions below might be closer to the truth.

Painting of Gustav Vasa with an interesting hairdo and wearing a large robe.
Painting of Gustav I Vasa. Fashion was somewhat different back in the day.
Gustav Vasa is wearing a big black robe and black beanie looking hat that is slanted on his head.
Portrait of Gustav Vasa (from Wikipedia Commons).

The Kalmar Union

In 1397 a union was formed between Denmark, Norway and Sweden called the Kalmar Union (Kalmar is a city a Sweden). The Kalmar Union came to be dominated by Denmark and there were occasional rebellions. During Gustav’s childhood, parts of the Swedish nobility tried to make Sweden independent. Gustav’s father Erik Johansson Vasa was part of that nobility.

Map showing Denmark, Sweden and Norway in purple. Iceland and Finland are also included.
The Kalmar Union. Finland was part of Sweden at the time. Ssolbergj, CC BY-SA 3.0 <https://creativecommons.org/licenses/by-sa/3.0&gt;, via Wikimedia Commons

After some problematic interactions with Denmark and the Danish King Christian II, King Christian massacred 100 Swedish nobles, November 7-9, 1520, on Stortorget in Stockholm, including Gustav’s father. In 1521 Gustav led a rebellion (or a civil war) against Denmark, which ended in the deposition of King Christian II from the throne of Sweden, effectively ending the Kalmar Union. I can add that King Christian is called Christian the Tyrant in Sweden and Christian the good in Denmark.

Sweden and Denmark has had a complicated history that included a lot of hostilities and eleven wars, but you wouldn’t know it if you looked at the situation today. There hasn’t been a war between Sweden and Denmark in more than 180 years and Swedes and Danes get along very well. However, it is best not to bring up the past. That is probably true for marriages as well.

On the left, a fist with a yellow and blue flag. On the right, a fist with a red and white flag.
Denmark vs Sweden. The yellow and blue flag is the Swedish flag. Red and white is the Danish. Shutterstock Stock Photo ID: 1114320377 by Hasanov Jeyhun.

Gustav Vasa’s Burial Place

Gustav Vasa died on September 29, 1560, and is buried together with three of his wives (while only two are engraved) in the Cathedral of Uppsala. Uppsala is an old city north of Stockholm famous for its Viking graves/mounds. During the Viking era Uppsala was the religious center of Sweden. Later as Sweden became Christian it remained the religious center of Sweden, however, the Viking temple in old Uppsala was replaced by a Christian church. Uppsala hosts one of the most prominent Universities in the world and it also happens to be where I studied Engineering Physics.

The largest cathedral in Sweden, Uppsala Domkyrka. This is where Gustav I Vasa is buried. Gustav I is arguably Sweden’s most prominent king.
Inside Uppsala Domkyrka
Inside Uppsala Domkyrka.
The tomb of Gustav I Vasa in Uppsala Domkyrka | Heavily decorated coffin shaped tomb placed in a large, decorated room filled with paintings.
The tomb of Gustav I Vasa in Uppsala Domkyrka. In the background is my son and his wife.

Photos from Sweden

Photo of a Leonberger standing on of a bench
I am a fan of Leonberger dogs, and this is a photo of the only Swedish Leonberger I met personally. Her name was Amie. We met her at an interesting place, at the top of a north Swedish mountain called Skule Mountain (Skull Mountain).
Three children sitting around a large table made of ice in a large room with columns of ice. There is an ice chandelier above the table.
One of the interesting tourist attractions in northern Sweden is the Ice Hotel in Jukkasjärvi . The ice hotel in Jukkasjärvi is the first/original and largest ice hotel in the world. My kids at the lobby of the ice hotel in northern Sweden.

A guard in a dark blue uniform wearing a golden helmet and a gun in standing in front of a booth in front of a big brick castle.
Sweden has a king (Carl XIV), and he owns a couple of big castles. This is my kids with the guard in front of the Winter Castle in Stockholm.
My photo of Drottningholm castle taken from the garden, a very large garden.
Drottningholm, one of the Royal Palaces in Sweden. It was built in the 1660’s and inspired by Versailles.
A photo of the Vasa Ship taken from below.
A photo of the Vasa ship from the bottom floor. My son is standing on the right in a green and black shirt.
This is a photo of a well-dressed 8-member royal family.
The Swedish Royal family. The two people in the middle are Queen Silvia and King Carl XVI Bernadotte. To the right of the king is the future monarch of Sweden princess Victoria and to the left of Queen Silvia is her husband. The others are their other two children and their spouses.
Yellow and Blue Swedish flag | Gustav Vasa
Finally, the Swedish Flag (Wikimedia Commons). All other photos above are mine

Other Scandinavian Posts


To see the Super Facts click here

Ukraine Gave up Thousands of Nuclear Warheads

Super fact 47 : In 1991, after the dissolution of the Soviet Union, Ukraine became the third largest nuclear power in the world after Russia and the United States. Ukraine held about one third of the former Soviet nuclear weapons and delivery systems. Ukraine agreed to transfer these weapons to Russia for dismantlement in exchange for economic compensation and assurances to respect Ukrainian independence and borders.

After the dissolution of the Soviet Union in 1991, Ukraine inherited an estimated 1,700 to 1,900 strategic nuclear warheads, 130 UR-100N intercontinental ballistic missiles (ICBM) with six warheads each, 46 RT-23 Molodets ICBMs with ten warheads apiece, and an estimated 2,650-4,200 tactical nuclear weapons. It should be noted that these nuclear warheads were not under Ukrainian control.

In 1994, Ukraine agreed to transfer these weapons to Russia for dismantlement in exchange for economic compensation and assurances from Russia, the United States and the United Kingdom to respect Ukrainian independence and sovereignty within its existing borders. These political agreements are referred to as the Budapest Memorandum.

These events are relevant to what is happening in Ukraine today, and yet it is seldom discussed, and many people are unaware of or have forgotten about this history. It also comes as a surprise to many that there are nuclear states who have relinquished their nuclear weapons. This is why I call this fact a super fact.

Atomic bomb explosion in a city - nuclear attack on a crowded city – 3D rendering of a mushroom cloud encompassing a city with skyscrapers.
Nuclear bomb dropped on a big city. Shutterstock, asset id: 2188083835 by CI Photos.

Nine Nuclear States

There are nine nuclear states in the world as of 2025 according to the Federation of Atomic Scientists. There are 12,331 nuclear warheads including 9,600 in active military stockpiles.

  • Russia – 5,449 warheads
  • The United States – 5,277 warheads
  • China – 600 warheads
  • France – 290 warheads
  • United Kingdom – 225 warheads
  • India – 180 warheads
  • Pakistan – 170 warheads
  • Israel – 90 warheads
  • North Korea – 50 warheads

There are also countries that are hosting nuclear warheads owned by other countries.

  • Italy (the United States) – 35 warheads
  • Turkey (the United States) – 20 warheads
  • Belgium (the United States) – 15 warheads
  • Germany (the United States) – 15 warheads
  • Netherlands (the United States) – 15 warheads
  • Belarus (Russia) – ? warheads
Nuclear bomb, chemical weapons, missile defense, a system of salvo fire.
Four missiles aimed at the sky at sunset.  Shutterstock, asset id: 2131803989 by Hamara

Four nations that relinquished their nuclear weapons programs

The four nations that relinquished their nuclear weapons programs are Belarus, Kazakhstan, South Africa, and Ukraine. Belarus, Kazakhstan, and Ukraine returned their inherited nuclear weapons to Russia after the dissolution of the Soviet Union. However, it should be noted that in 2023 Russia began deploying tactical nuclear weapons to Belarus. However, Belarus does not currently possess its own nuclear weapons. South Africa voluntarily dismantled its nuclear weapons program in 1991.

In 2023 Russia began deploying tactical nuclear weapons to Belarus.
Russia and Ukraine as well as the borders of Russia and Ukraine are colored and look different from other countries.
Russia (green) and Ukraine (brown) map on a world map. Ukraine is about the size of Texas. Russia is about twice the area of the United States. Belarus is the country located immediately to the north of Ukraine and Kazakhstan is the big country immediately to the south of Russia and east of Ukraine. Shutterstock Asset id: 2121271067 by buraktumler

How to Build a Nuclear Bomb

This section is just some extra reading that is only somewhat related to the topic. However, since it is an interesting topic somewhat related to the topic I might as well explain how to build a nuclear bomb. Don’t worry I will not present any engineering details, only general principals, which is all I know, and which are already all over internet. Besides if I were to give detailed engineering instructions some peacenik hippie might have a hissing fit and swear in the comment section (that was a joke).

Anyway, the main idea behind a nuclear fission bomb is to achieve a runaway chain reaction. A fusion bomb, or a so-called hydrogen bomb is different. To create a fission bomb you are not looking for the most radioactive materials there are. You are looking for a fuel which you can use to create a runaway chain reaction, and which is also stable enough to make a bomb possible, in other words not too radioactive. Basically, the fuel must be just right. The primary fuels used in fission bombs are uranium-235 and plutonium-239. These isotopes undergo fission when struck by neutrons, releasing a massive amount of energy in a chain reaction.

The image shows a Uranium atom on the left arrows in the middle and an alpha particle, a gamma ray, a proton, a neutron, and an electron on the right | Ukraine Gave up Thousands Nuclear Warheads
Uranium-235 and Uranium-238 are both not very radioactive and can be used for radiometric dating that stretches millions and billions of years. Uranium-235 is also the “just-right” uranium isotope that can be used for bomb making. Shutterstock Vector ID: 2417370135 by grayjay

I should explain, isotopes are different forms of an element. For example, hydrogen comes in three different forms, a nucleus with just a proton, a nucleus with one proton and one neutron (deuterium), and a nucleus with one proton and two neutrons (tritium). Isotopes for the same element are chemically identical but have different atomic weight and they may or may not be radioactive.

The three isotopes of Uranium are uranium-234, uranium-235, and uranium-238. The one we need is uranium-235, which has 92 protons and 143 neutrons in the nucleus. The isotopes of Plutonium include Pu-238, Pu-239, Pu-240, Pu-241, and Pu-242 but there are others. The one we need is plutonium-239, which has 94 protons and 145 neutrons in the nucleus. There are more than 3,500 known isotopes of which 3,000 are radioactive.

During Uranium-235 fission, an average of 2.5 neutrons are released. Specifically, the fission of U-235 typically releases 2 or 3 neutrons, with the average being close to 2.5. During the fission of plutonium-239, an average of 2.9 neutrons are released (depending on the energy of the incident neutron). The important thing for bomb making is that one atom/nucleus releases enough neutrons so that the neutrons from one nucleus cause more than one fission. For example, a nucleus releases three neutrons and two of those neutrons cause two more fission events, which in turn cause four fission events, etc. 2, 4, 8, 16, 32, 64, a trillion…

From left to right : a neutron strikes a uranium nucleus, and it breaks apart into a Krypton and Barium isotope and release three neutrons, which strike three uranium nucleuses, causing three fission events and releasing nine neutrons in total, etc | Ukraine Gave up Thousands Nuclear Warheads
Illustration of nuclear chain reaction. Uranium-235 fission. Unfortunately, the picture has an error in it. It is 92 protons not 95 in a U-235 isotope. – Shutterstock asset id: 73714504 by Mpanchenko.

By putting together enough U-235 you can make it so that one fission event will result in more than one additional fission event. This is called the critical mass. The critical mass for U-235 is 47 kilograms (104 pounds). Theoretically, you can achieve this by taking a 24-kilogram half sphere of U-235 in your right hand and a 24-kilogram half sphere of U-235 in your left hand and bring them together. You will achieve a limited chain reaction for a nano second, but you will just blow the two halves apart and kill yourself, but your city will survive. This is called a fizzle. To make most of the 48-kilogram mass undergo fission you have to force them together long enough for the chain reaction to complete (or almost complete). This requires force and precise calculations. See the illustration below.

A piece of arrow shaped uranium-235 is shot from the left to the right to collide with a larger half-sphere-shaped uranium-235 core thus achieving critical mass forcefully and quickly | Ukraine Gave up Thousands Nuclear Warheads
Components Inside of Uranium Nuclear Fission Bomb illustration – Shutterstock asset id: 2271462995 by BlueRingMedia.

Another difficulty is obtaining nearly 100% U-235 from natural uranium. 99% of the Uranium you find in nature is U-238. U-235 and U-238 chemically identical so extracting U-235 from natural uranium is difficult. However, U-235 is slightly lighter than U-238 so you can use centrifugal separation as you do to separate cream from milk. What is typically done is using a uranium compound, uranium hexafluoride, heat it into gaseous form and then utilize centrifugal separation to extract the uranium hexafluoride with U-235 isotopes. After that you can chemically extract the uranium, which is now U-235.

To see the other Super Facts click here

Developed nations have successfully reduced carbon emissions

Super fact 42 : The developed nations (rich countries) have reduced their carbon emissions since the 1990’s despite continued GDP growth, even if we take offshore production into account. In addition, many developing countries have succeeded in reducing their emissions as well. Other fast-growing developing countries have flattened or at least slowed their increase in carbon emissions. Many countries have decoupled economic growth from CO2 emissions. In other words, we do not need to increase carbon emissions or burn more fossil fuels to grow the economy.

This is good news as well as a surprise to many people who falsely believe that to grow the economy (grow GDP) you need to burn more fossil fuels and an increase in carbon emissions is inevitable if you want to grow the economy. The data shows otherwise. This is important news that is difficult to believe in for many people. It is a super fact.

Carbon Emissions and GDP

In the past carbon emissions were strongly correlated with national wealth. The wealthier a nation was the higher its carbon emissions were and as the economy grew so did the carbon emissions. This has not been true since the 1990’s. The developed nations of the world have continued growing their GDP whilst reducing their carbon emissions.

You may think that the reason is that we shipped much of our manufacturing overseas and that if you consider the consumers in the importing country responsible for the overseas emissions this decoupling of GDP and emissions would disappear. But you would be wrong. Even if you make the consumers in the importing country responsible for the emissions during production in the exporting country the emissions have gone down. One example taken from this article in Our World in Data is the United Kingdom.

In the graph below for the UK the GDP (adjusted for inflation) grew by 53.26% between 1990 and 2023 and the emissions were reduced by 57.66%. If make UK consumers 100% responsible for the emissions in China and India, etc., caused by the production of goods imported to the UK the reduction until 2022 was 38.59%. That is not as much but it is still impressive and demonstrates the decoupling between GDP growth and carbon emissions.

The graph shows three plotted graphs, a dark blue one showing GDP per capita, a light blue one showing UK carbon emissions per capita and a red one showing trade adjusted carbon emissions per capita. The GDP graph is increasing by more than 50% over 33 years and the CO2 emissions per capita graph is decreasing by almost 60% and the trade adjusted carbon emissions decline by almost 40% | Developed nations have successfully reduced carbon emissions
Data source: Data compiled from multiple sources by World Bank (2025); Global Carbon Budget (2024); Population based on various sources (2024). Note: GDP per capita is expressed in international dollars at 2021 prices. Graph taken from Our World in Data.

The text in the graph above is difficult to read so I’ve copied it below in larger text:

  • Consumption-based emissions: Consumption-based emissions are national or regional emissions that have been adjusted for trade. They are calculated as domestic (or ‘production-based’ emissions) emissions minus the emissions generated in the production of goods and services that are exported to other countries or regions, plus emissions from the production of goods and services that are imported. Consumption-based emissions = Production-based – Exported + Imported emissions.
  • Fossil emissions: Fossil emissions measure the quantity of carbon dioxide (CO2) emitted from the burning of fossil fuels, and directly from industrial processes such as cement and steel production. Fossil CO2 includes emissions from coal, oil, gas, flaring, cement, steel, and other industrial processes. Fossil emissions do not include land use change, deforestation, soils, or vegetation.
  • International dollars: International dollars are a hypothetical currency that is used to make meaningful comparisons of monetary indicators of living standards. Figures expressed in constant international dollars are adjusted for inflation within countries over time, and for differences in the cost of living between countries. The goal of such adjustments is to provide a unit whose purchasing power is held fixed over time and across countries, such that one international dollar can buy the same quantity and quality of goods and service no matter where or when it is spent. Read more in our article: What are Purchasing Power Parity adjustments and why do we need them?

Below is the same type of graphs for the United Kingdom as well as France, Germany, Sweden, United States and Finland. The numbers for these countries are as follows:

  • United Kingdom: GDP growth 53.26%, CO2 emissions reduction 57.66%, trade adjusted CO2 emissions reduction 38.59%.
  • France: GDP growth 39.74%, CO2 emissions reduction 40.64%, trade adjusted CO2 emissions reduction 28.82%.
  • Germany: GDP growth 49.04%, CO2 emissions reduction 46.72%, trade adjusted CO2 emissions reduction 33.95%.
  • Sweden: GDP growth 56.00%, CO2 emissions reduction 48.45%, trade adjusted CO2 emissions reduction 34.75%.
  • United States: GDP growth 68.05%, CO2 emissions reduction 29.25%, trade adjusted CO2 emissions reduction 17.04%.
  • Finland: GDP growth 45.69%, CO2 emissions reduction 50.54%, trade adjusted CO2 emissions reduction 42.79%.

Note these are emissions reduction numbers per capita (growth for GDP) not carbon emissions per capita. For example, the United States has three to four times larger carbon emissions per capita as, for example, Sweden or France.

All these graphs show the same trends as the UK graph.
Data source: Data compiled from multiple sources by World Bank (2025); Global Carbon Budget (2024); Population based on various sources (2024). Note: GDP per capita is expressed in international dollars at 2021 prices. Graph taken from Our World in Data.

Many Countries Have Reduced Their Carbon Emissions

However, the story does not end with these six countries or even with the developed world. The 30 graphs below all demonstrate significant reductions in carbon emissions as GDP is growing, demonstrating a decoupling between GDP growth and carbon emissions. Note that Azerbaijan’s GDP grew by 93% as its carbon emissions was reduced by 7% (all carbon emissions below are adjusted for trade).

This is 30 small graphs featuring a blue and red line. The blue line shows GDP growth since 1990 and the red line carbon emissions since 1990. All blue lines point up and all red lines point down | Developed nations have successfully reduced carbon emissions
Data sources: Global Carbon Project & World Bank. There are more countries that achieved the same, but only those countries for which data is available and for which each exceeded 5% are shown. The graphs are from Our World in Data <<Link-1>>. All carbon emissions in the graphs above are adjusted for trade.

The World’s Carbon Emissions Per Capita Has Flattened

World GDP per capita has increased by 83.54% since 1990 while carbon emissions per capita have grown by 9.48%. That may not be as impressive but note two things. That is still a decoupling between economic growth and if you look in the graph, you’ll see that carbon emissions were higher in 2008 to 2019. The curve has flattened and gone down a bit. Global Warming caused by our burning of fossil fuels may be the greatest environmental challenge in recorded history, but we are slowly and steadily turning things around. We are not doing it fast enough to avoid major damage to our eco systems and perhaps civilization, but we are still turning things around. If you have any doubts about global warming / climate change or that we are causing it click here for a summary of the evidence.

The graph shows two graphs. The dark blue one shows GDP growth per capita and the light blue the carbon emissions per capita.
Data source: Data compiled from multiple sources by World Bank (2025); Global Carbon Budget (2024); Population based on various sources (2024). The graph is taken from Our World in Data <<Link-1>>.

China’s Carbon Emissions

One reason the world’s carbon emissions per capita have not been reduced much despite the fact that so many countries have reduced their emissions is that the world’s largest emitter China, has grown their carbon emissions steadily since 1990. Between 1990 and 2023 China’s GDP per capita (and adjusted for inflation) grew by 1,245.28% and their emissions grew by 288.43% per capita. Remember that China has 1.4 billion people so that is a big carbon blast for the world.

However, before you blame China too much remember that China’s carbon emissions per capita is less than that of the United States and that of many other developed countries, and the country with the largest cumulative carbon emissions is the United States. China’s economic growth has been immense, and its immense population of 1.4 billion people explains its huge impact on the world’s carbon emissions.

Fortunately, it now appears that China’s emissions have finally peaked.

To see the other Super Facts click here