US Violent Crime Nearly Cut in Half Since 1990

Superfact 8 : US Violent Crime Nearly Cut in Half Since 1990

Despite all the news reports about rampant crime, the US violent crime rate has fallen to half of what it was in the early 1990’s.

I’ve known for a while that violent crime in the US has been going down substantially since 1990. However, quite often when I mention this people refuse to believe it. When I visit NextDoor, the hyperlocal social networking service for neighborhoods, I see people complaining about rising crime, and especially rising violent crime. The news media and the newspapers are filled with violent crime stories, murders, mass shootings, assaults, rape, and robberies. It seems to be getting worse and worse. We are living in scary times, aren’t we?

The Better Angels of our Nature

A couple of years ago I bought a book by Steven Pinker with the title The Better Angels of our Nature, why violence has declined, which contradicted the violence is getting worse narrative. In the book he claims that violence is trending down worldwide and that includes US violent crime.

In 1987 I received a Christmas present from the parents of a fellow student whom I had been tutoring. I was an exchange student to the United States from Sweden at the time. The Christmas present in question was the World Almanac of 1987. I loved it and ever since I’ve bought the World Almanac every year. If you open the pages for crime statistics in the United States in the World Almanac you see the same thing, violent crime in the US is declining.

The colorful front page of The World Almanac and Book of Facts 2023. It features photographs of events in 2023 as well as a picture of the northern hemisphere of Earth.
The World Almanac and Book of Facts 2023.

Statistics

Below is what the World Almanac 2023 says about the violent crime rate per 100,000 residents in the United States (page 114). The data sources were : Federal Bureau of Investigation, U.S. Department of Justice, Uniform Crime Reporting Program, Crime in the United States 2020. I also included property crimes in the last column to show that non-violent crimes have declined as well.

YearAll violent crimeMurder and nonnegligent manslaughterRapeRobberyAggravated assaultAll property crime (non-violent)
1990729.69.441.1256.3422.95,073.1
1995684.58.237.1220.9418.34,590.5
2000506.55.532.0145.0324.03,618.3
2005469.05.631.8140.8290.83,431.5
2008458.65.429.8145.9277.53,214.6
2011387.14.727.0113.9241.52,905.4
2014361.64.426.6101.3229.22,574.1
2016386.65.430.0102.9248.32,451.6
2017383.85.330.798.6249.22,362.9
2018370.45.031.086.1248.22,209.8
2019368.65.131.481.8250.42,130.6
2020387.86.527.673.9279.71,958.2

The graph below is taken from this article from the Pew Research Center tells the same story. The graph. It shows that the US violent crime rate has nearly halved since the 1990’s. There is a slight uptick in crime for the years 2020 and 2021 but according to this PBS article the downward trend has continued in 2022 and 2023.
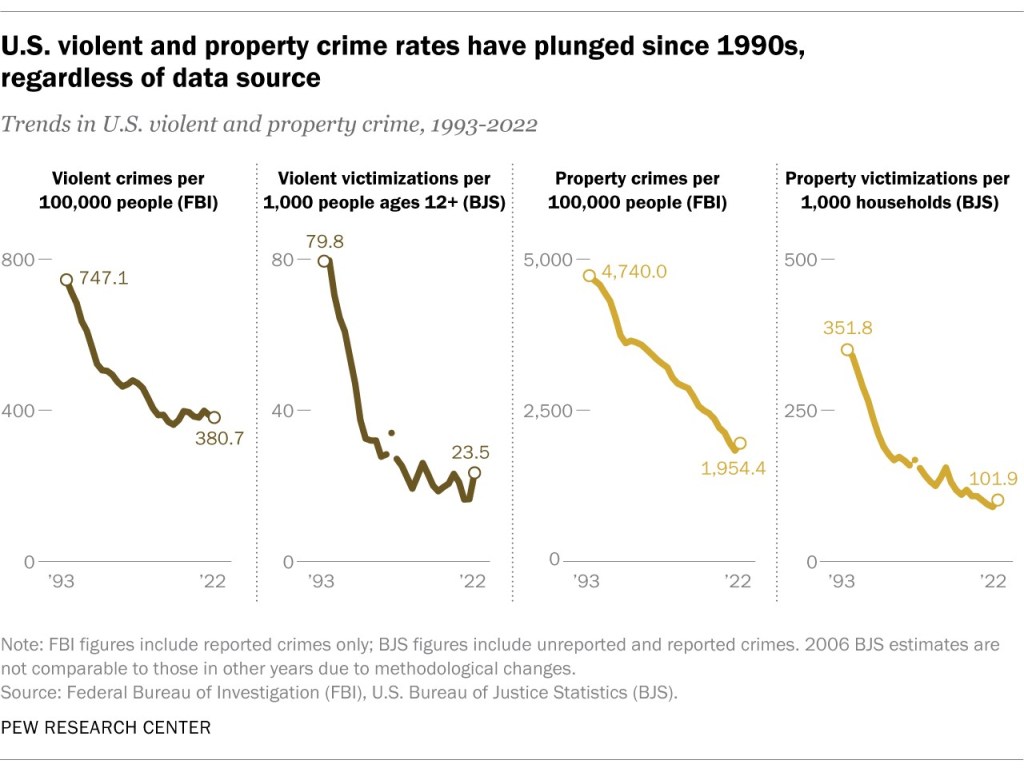
The first graph shows that violent crime per 100,000 people (FBI) has gone from 747.1 in 1990 to 380.7 in 2022. The next three graphs show the same trends | US Violent Crime Nearly Cut in Half Since 1990
The four graphs show that both violent crime and property crime has declined since 1990. Click on the picture to see the Pew Research article it is taken from.

Since this is a surprising fact that some does not even want to acknowledge (in my experience) I consider this a super fact.

Do you feel it is hard to believe that violent crime in the US has been declining over the last few decades?
To see the other Super Facts click here

Poverty and child mortality has been sharply reduced worldwide

Superfact 7 : Poverty and child mortality has been sharply reduced worldwide.

Extreme poverty as well as child mortality has been sharply reduced the world over. The countries that are the worst-off today are still better off than the countries that were doing the best at the beginning of the 19th century. Over the last 20 years extreme poverty and child mortality has continued to decline sharply.

In Hans Rosling’s book Factfulness, “Ten Reasons We’re are Wrong About the World – and Why Things Are Better Than You Think”, the author presented a quiz that he wanted the reader to take before reading the book. Below is the third question of the quiz. I should say that Hans Rosling posed this and other questions to thousands of people around the world.

In the last 20 years, the proportion of the World population living in extreme poverty has…

  • A. Almost doubled
  • B. Remained more or less the same
  • C. Almost halved

The correct answer is C. Almost halved. Around 7% of the quiz takers got the right answer. Around 5% in the United States got it right. That the proportion of the World population living in extreme poverty halved in 20 years is a true fact. This is also an important fact about the world. Despite that most people got it wrong. In fact, monkeys randomly picking answers would do better (33%). I did pretty well on this quiz, but since I was reading the book and the book’s title is “Ten Reasons We’re are Wrong About the World – and Why Things Are Better Than You Think”,  I got some help just looking at the front cover. In any case, I think this fact qualifies as a super fact, as do the other fact below (There has been a steep decline in child mortality).

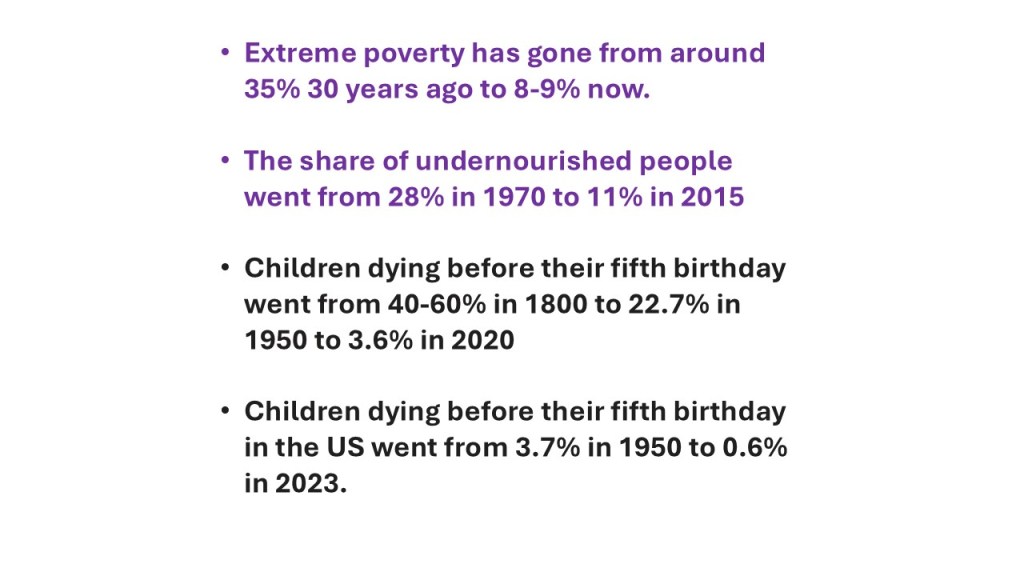
This picture feature five statements (1) Extreme poverty has gone from around 35% 30 years ago to 8-9% now. (2) The share of undernourished people went from 28% in 1970 to 11% in 2015. (3) Children dying before their fifth birthday went from 40-60% in 1800 to 22.7% in 1950 to 3.6% in 2020. (4) Children dying before their fifth birthday in the US went from 3.7% in 1950 to 0.6% in 2023.
These are selected facts from the data.

There has been a steep decline in extreme poverty

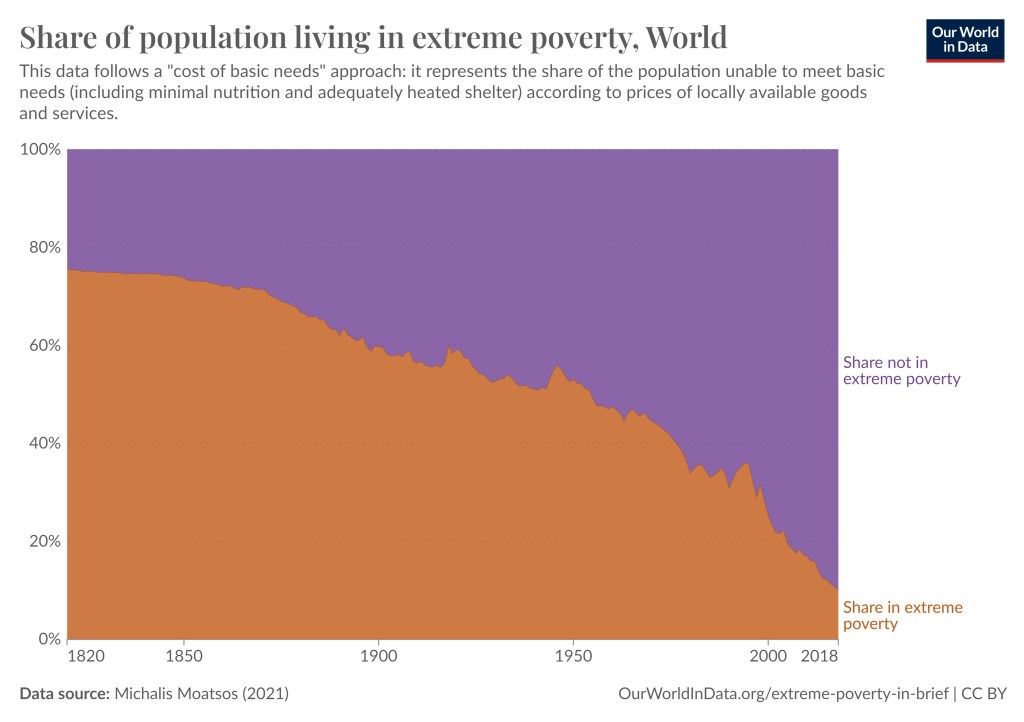
According to the World Bank and Our Data World in Data, an organization which makes data in databases easily accessible to public, extreme poverty went from almost 80% 200 years ago, 60% 100 years ago, about 45% 50 years ago, 34.3% 30 years ago, 23.6%  20 years ago, 8.4% in 2019, then it went up to 9% during the covid epidemic but it seems to be back down to a bit above 8% again. See the graph below as well as the two linked articles in this paragraph.

I should say that extreme poverty is (by the UN, World Bank, etc.) “a condition characterized by severe deprivation of basic human needs, including food, safe drinking water, sanitation facilities, health, shelter, education and information” and is currently defined to be below $2.15. In 2011 it was below $1.90.

The graph shows share living in extreme poverty in brown and share not living in extreme poverty in purple. The graph begins in 1820 at ends in 2018.
This graph from Our World In Data shows a steep decline in extreme poverty over time. Click on the picture to visit the original article.

Other related statistics mentioned in Hans Rosling’s book is that the share of undernourished people went from 28% in 1970 to 11% in 2015. That is despite the earth’s growing population. Related to this is that cereal yield per hectare went from 1.4 ton in 1961 to 4 ton in 2014. This is due to modern agricultural techniques. The share of people with water from protected sources went from 58% in 1980 to 88% in 2015. This statistic was taken from WHO, UNICEF, the World Bank and FAO (the UN Food and Agriculture Organization).

There has been a steep decline in child mortality

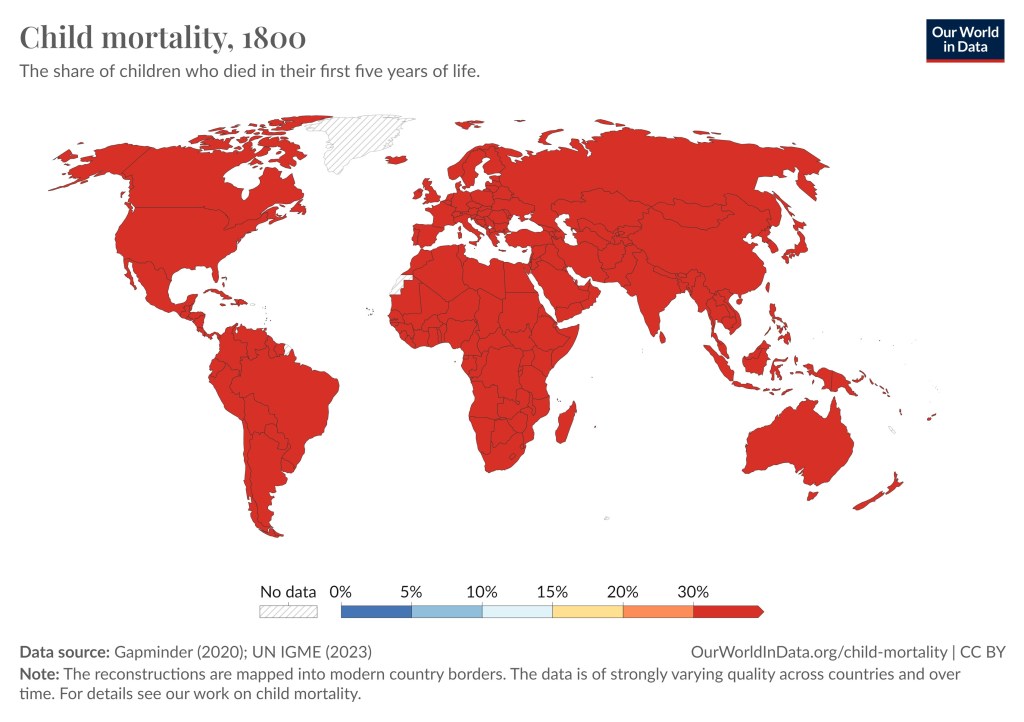
According to Hans Rosling’s book the percent of children dying before their fifth birthday went from 44% in 1800 to 4% in 2016. To get a more complete picture see these articles from Our World In Data, article1, article2, as well as the graph below. For most of humanities existence virtually all societies suffered a child mortality rate between 40% and 60%, but that changed drastically over the last 100 years.

This graph is a world map showing the child mortality rate in different countries as indicated by colors. All countries are red, meaning it is above 30%.
Child mortality rate worldwide in 1800. Some of the data are estimates and may not be reliable. Data sources are UN IGME and Gapminder (an organization similar to Our World In Data).
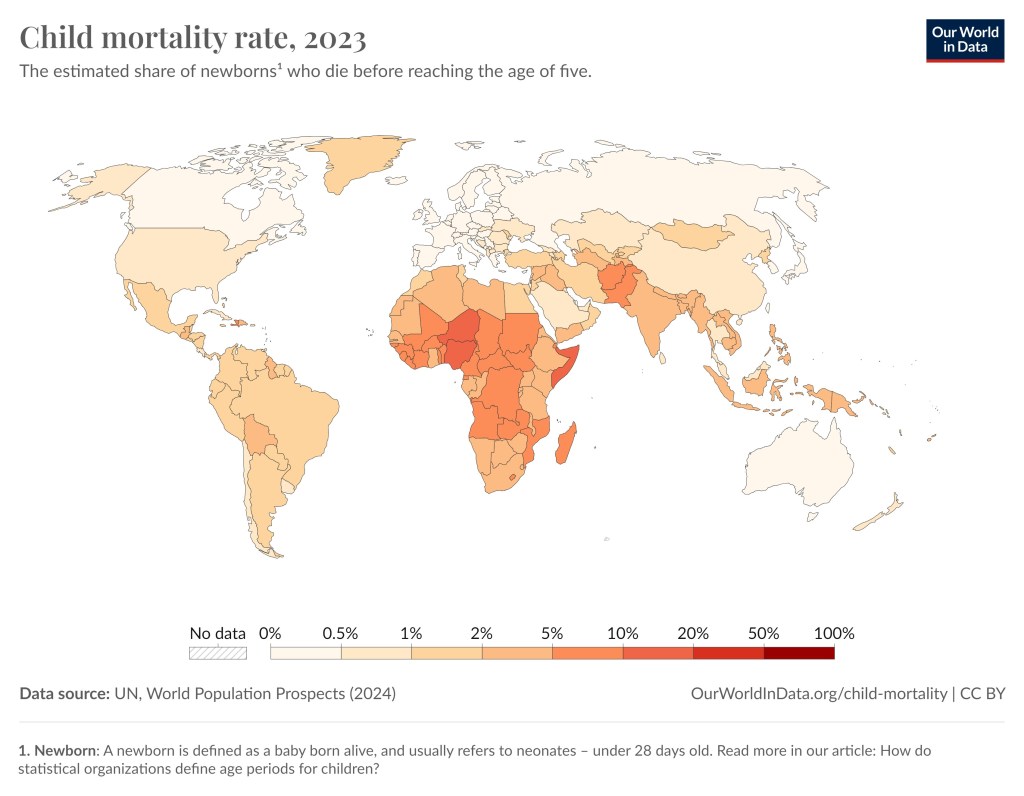
This graph is a world map showing the child mortality rate in different countries as indicated by colors. Niger has the highest child mortality rate of 11.6% and Iceland the lowest at 0.2%.
Child mortality rate worldwide in 2023. Niger has the highest child mortality rate of 11.6% and Iceland the lowest at 0.2%.
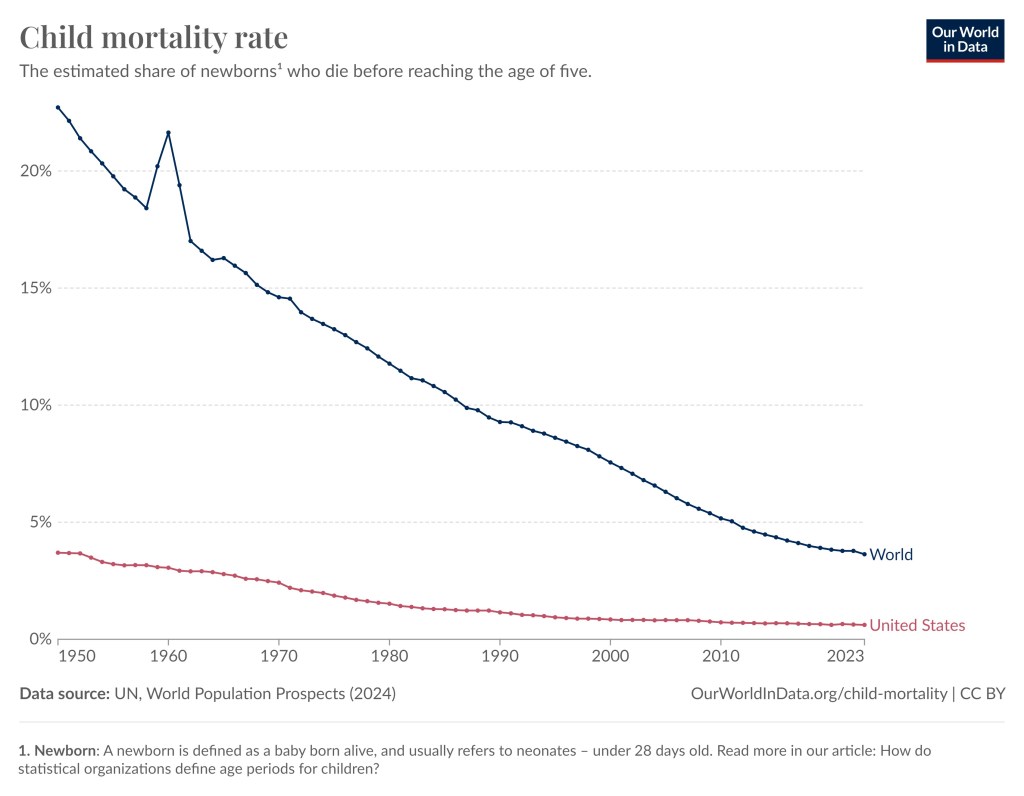
This graphics contain two graphs one for the world (blue) and for the United States (red) | Poverty and child mortality has been sharply reduced worldwide
Child mortality in in the world since 1950. The spike you see around the end of 1950 to 1960 is the great leap forward famine in China. In 1950 the child mortality rate was 22.7% and 2023 the child mortality rate was 3.6%.

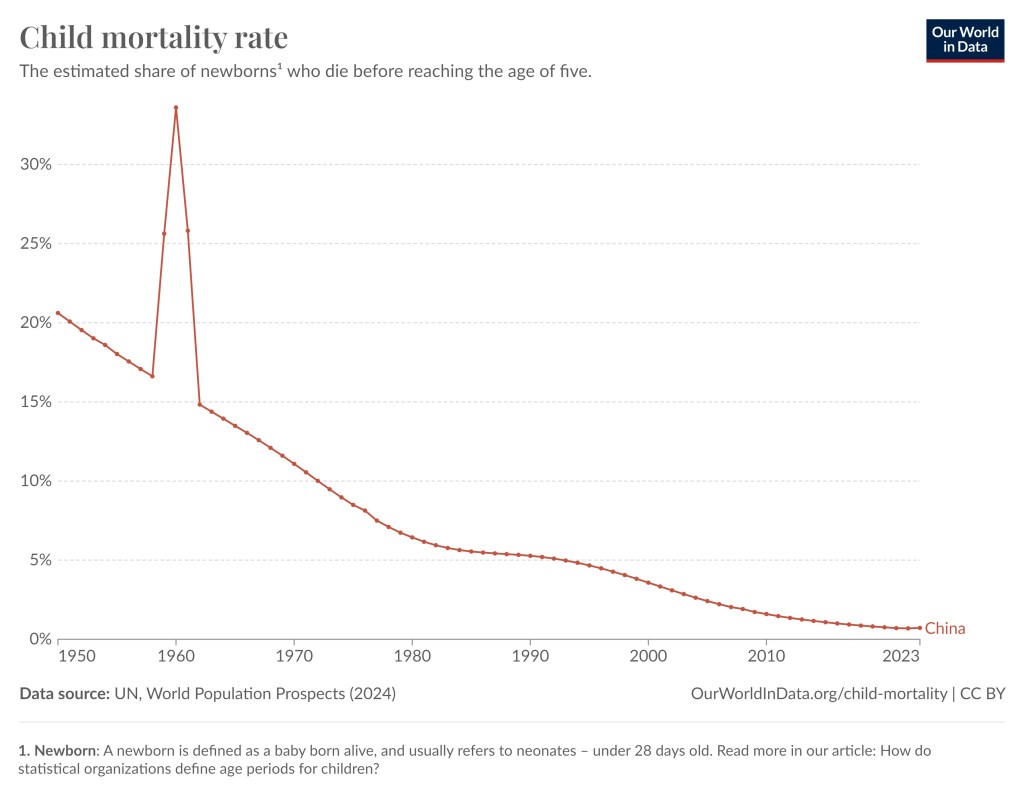
Below is the child mortality rate since 1950 for a few selected countries.

The red graph is showing a decline from 20% in 1950 to 0.7% in 2023 with a spike of almost 40% around 1960 | Poverty and child mortality has been sharply reduced worldwide
Child mortality in China since 1950. The large spike you see around the end of 1950 to 1960 is the great leap forward famine. 15 to 55 million died from starvation. In 2023 the child mortality rate was 0.7%.
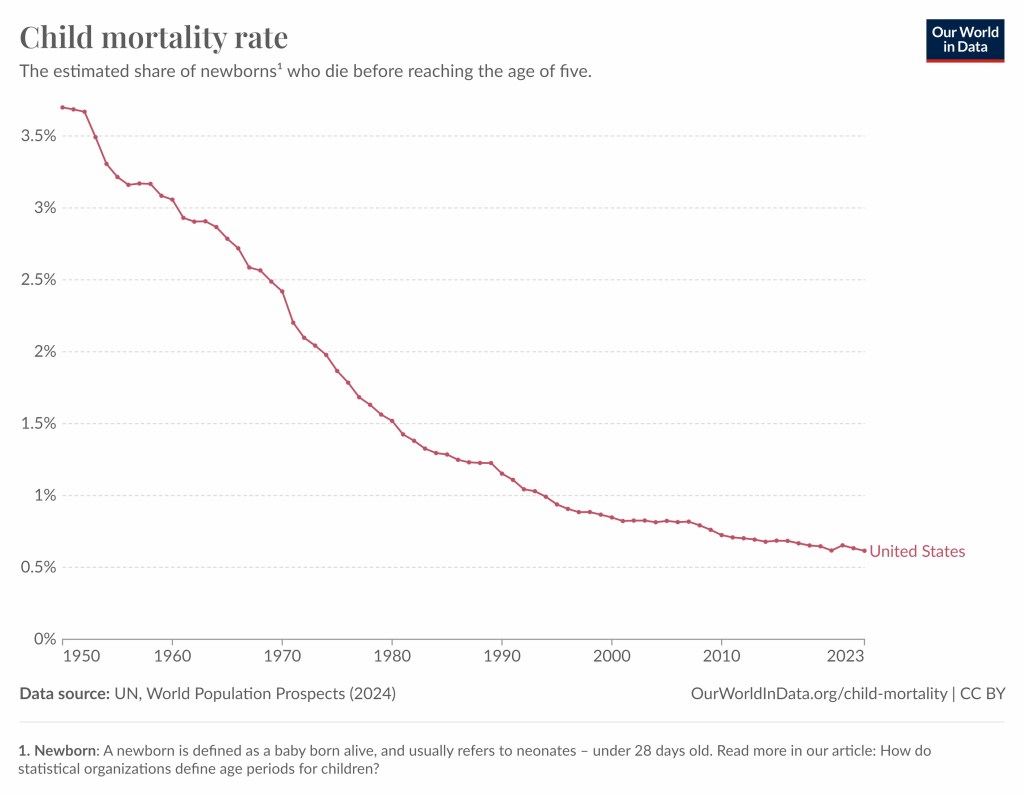
The graph shows a steady decline from 3.7% in 1950 to 0.6% in 2023. The decline of the graph is slower towards the end | Poverty and child mortality has been sharply reduced worldwide
Child mortality in the United States since 1950 (3.7%). In 2023 the child mortality rate was 0.6%.
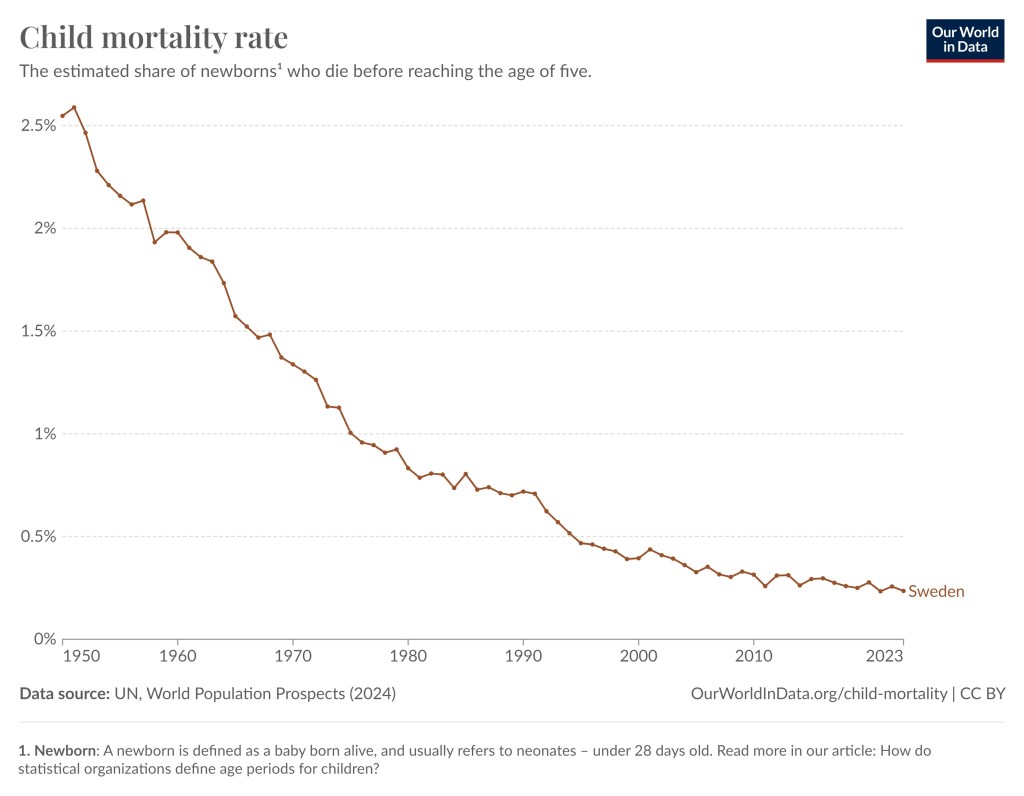
The graph shows a steady decline from 2.6% in 1950 to 0.2% in 2023 | Poverty and child mortality has been sharply reduced worldwide
Child mortality in Sweden since 1950 (2.6%). In 2023 the child mortality rate was 0.2%.


To see the other Super Facts click here