The goal of this blog is to create a list of super facts. Important facts that are true with very high certainty and yet surprising, misunderstood, or disputed by many. This blog aims to be challenging, educational, and fun, without it being clickbait. I determine veracity using evidence, data from reputable sources and longstanding scientific consensus. Prepare to be challenged (I am). Intentionally seek the truth not confirmation of your belief.
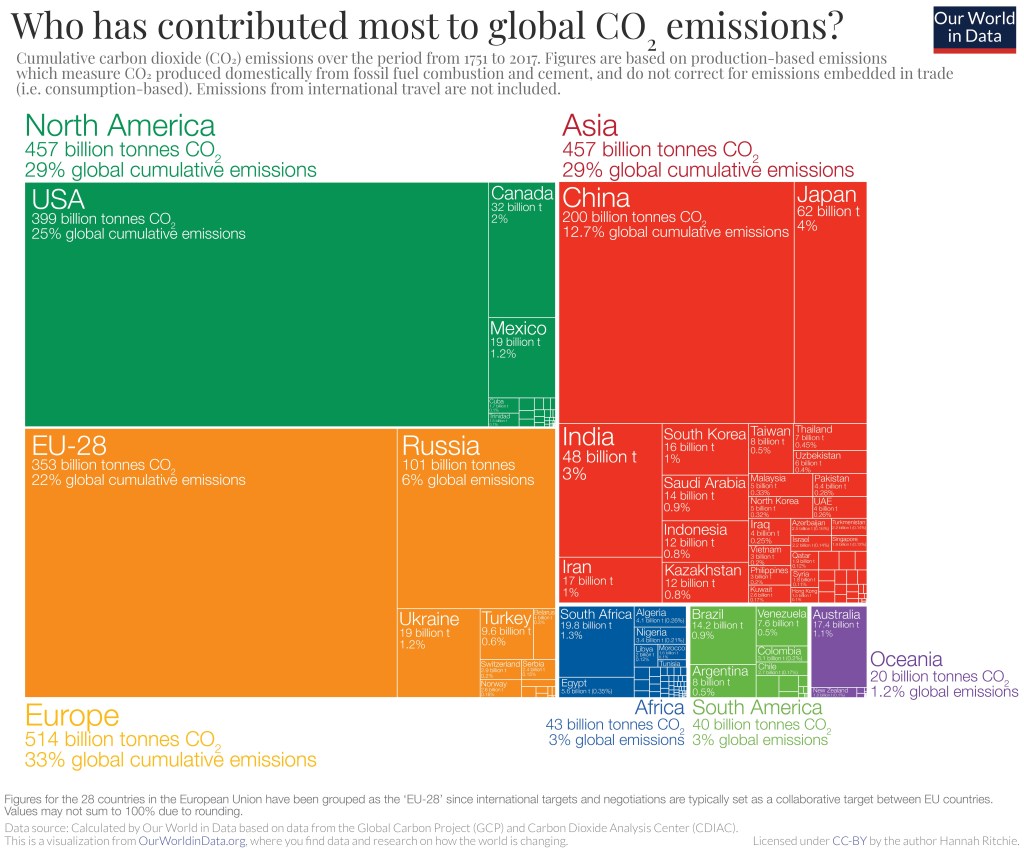
Super fact 43 : The United States has emitted more CO2 than any other country to date, around 400 billion tons since 1751. It is responsible for 25% of historical emissions. Click here.
But what about China? That is 12.7%, or around half. This is surprising information to many Americans, yet it is true, and therefore a super fact. In the US it is very common to blame China for our carbon emissions. In China they blame the US. In Europe they blame the US and China. Who is right? It turns out that the blame game is complicated and futile.
Carbon Emissions Around the World
Who should we blame the most for our carbon emissions?
On the other hand, the US carbon emissions per capita (14.3 ton) is considerably larger than that of China (8.4 ton). China has 1.4 billion people after all and the US only 340 million people.
On the other hand, China used to be very poor and is quickly catching up to our standard of living with the help of fossil fuels, just like the western world once did.
It should also be noted that the countries that are emitting the most carbon emissions per capita are several smaller developing (third world) countries including Palau, Qatar, Kuwait, Brunei, New Caledonia, Bahrain, United Arab Emirates, Trinidad and Tobago, Gibraltar, Saudi Arabia, Oman, etc.
On the other hand, according to this analysis presented in the Guardian, the Netherlands has the highest per capita historical emissions, followed by the UK in second place. The analysis calculates the national cumulative emissions from 1850 per person, based on today’s population, among countries with populations of at least 1 million.
In other words, if you want to blame another country for the carbon emissions, take your pick, well your cherry pick. Why should we do something about our carbon emissions when X is worse? Those who want no action on the global warming / climate change problem love the blame game. Like denial or despair, which are both irrational positions, the blame game hinders action. The blame game can also get very complicated and contentious.
The graph shows the fossil fuel emissions (in carbon dioxide equivalents) per capita from 1750 to 2023 for the World, the United States, Canada, China, European Union, India, South Africa, United Kingdom, and Kenya. Notice that the United Kingdom dominated the emissions in the 1700’s and 1800’s. Data source: Global Carbon Budget (2024); Population based on various sources (2024). The graph is from Our World in Data .
Note regarding the graph above: By clicking here you can find this graph and then select to display any set of countries or regions. Have fun experimenting.
Note regarding Fossil emissions: Fossil emissions measure the quantity of carbon emissions (CO2) emitted from the burning of fossil fuels, and directly from industrial processes such as cement and steel production. Fossil CO2 includes emissions from coal, oil, gas, flaring, cement, steel, and other industrial processes. Fossil emissions do not include land use change, deforestation, soils, or vegetation.
Overview of Cumulative Carbon Emissions
As you can see in the graph below the cumulative carbon emissions from 1751 to 2017 are 25% for the United States, 22% for the EU (28 countries), 12.7% for China, 6% for Russia, 4% for Japan, and 3% for India. If you count the entire continent of Europe, you get 33% for Europe.
Figures for the 28 countries in the European Union have been grouped as the EU-28 since international targets and negotiations are typically set as a collaborative target between EU countries. Values may not sum up to 100% due to rounding. Data Source: Calculated by Our World in Data from the Global Carbon Project (GCP) and Carbon Dioxide Analysis Center (CDIAC). This is a visualization from Our World in Data, where you can find data and research on how the world is changing.
Super fact 42 : The developed nations (rich countries) have reduced their carbon emissions since the 1990’s despite continued GDP growth, even if we take offshore production into account. In addition, many developing countries have succeeded in reducing their emissions as well. Other fast-growing developing countries have flattened or at least slowed their increase in carbon emissions. Many countries have decoupled economic growth from CO2 emissions. In other words, we do not need to increase carbon emissions or burn more fossil fuels to grow the economy.
This is good news as well as a surprise to many people who falsely believe that to grow the economy (grow GDP) you need to burn more fossil fuels and an increase in carbon emissions is inevitable if you want to grow the economy. The data shows otherwise. This is important news that is difficult to believe in for many people. It is a super fact.
Carbon Emissions and GDP
In the past carbon emissions were strongly correlated with national wealth. The wealthier a nation was the higher its carbon emissions were and as the economy grew so did the carbon emissions. This has not been true since the 1990’s. The developed nations of the world have continued growing their GDP whilst reducing their carbon emissions.
You may think that the reason is that we shipped much of our manufacturing overseas and that if you consider the consumers in the importing country responsible for the overseas emissions this decoupling of GDP and emissions would disappear. But you would be wrong. Even if you make the consumers in the importing country responsible for the emissions during production in the exporting country the emissions have gone down. One example taken from this article in Our World in Data is the United Kingdom.
In the graph below for the UK the GDP (adjusted for inflation) grew by 53.26% between 1990 and 2023 and the emissions were reduced by 57.66%. If make UK consumers 100% responsible for the emissions in China and India, etc., caused by the production of goods imported to the UK the reduction until 2022 was 38.59%. That is not as much but it is still impressive and demonstrates the decoupling between GDP growth and carbon emissions.
Data source: Data compiled from multiple sources by World Bank (2025); Global Carbon Budget (2024); Population based on various sources (2024). Note: GDP per capita is expressed in international dollars at 2021 prices. Graph taken from Our World in Data.
The text in the graph above is difficult to read so I’ve copied it below in larger text:
Consumption-based emissions: Consumption-based emissions are national or regional emissions that have been adjusted for trade. They are calculated as domestic (or ‘production-based’ emissions) emissions minus the emissions generated in the production of goods and services that are exported to other countries or regions, plus emissions from the production of goods and services that are imported. Consumption-based emissions = Production-based – Exported + Imported emissions.
Fossil emissions: Fossil emissions measure the quantity of carbon dioxide (CO2) emitted from the burning of fossil fuels, and directly from industrial processes such as cement and steel production. Fossil CO2 includes emissions from coal, oil, gas, flaring, cement, steel, and other industrial processes. Fossil emissions do not include land use change, deforestation, soils, or vegetation.
International dollars: International dollars are a hypothetical currency that is used to make meaningful comparisons of monetary indicators of living standards. Figures expressed in constant international dollars are adjusted for inflation within countries over time, and for differences in the cost of living between countries. The goal of such adjustments is to provide a unit whose purchasing power is held fixed over time and across countries, such that one international dollar can buy the same quantity and quality of goods and service no matter where or when it is spent. Read more in our article: What are Purchasing Power Parity adjustments and why do we need them?
Below is the same type of graphs for the United Kingdom as well as France, Germany, Sweden, United States and Finland. The numbers for these countries are as follows:
United Kingdom: GDP growth 53.26%, CO2 emissions reduction 57.66%, trade adjusted CO2 emissions reduction 38.59%.
France: GDP growth 39.74%, CO2 emissions reduction 40.64%, trade adjusted CO2 emissions reduction 28.82%.
Germany: GDP growth 49.04%, CO2 emissions reduction 46.72%, trade adjusted CO2 emissions reduction 33.95%.
Sweden: GDP growth 56.00%, CO2 emissions reduction 48.45%, trade adjusted CO2 emissions reduction 34.75%.
United States: GDP growth 68.05%, CO2 emissions reduction 29.25%, trade adjusted CO2 emissions reduction 17.04%.
Finland: GDP growth 45.69%, CO2 emissions reduction 50.54%, trade adjusted CO2 emissions reduction 42.79%.
Note these are emissions reduction numbers per capita (growth for GDP) not carbon emissions per capita. For example, the United States has three to four times larger carbon emissions per capita as, for example, Sweden or France.
Data source: Data compiled from multiple sources by World Bank (2025); Global Carbon Budget (2024); Population based on various sources (2024). Note: GDP per capita is expressed in international dollars at 2021 prices. Graph taken from Our World in Data.
Many Countries Have Reduced Their Carbon Emissions
However, the story does not end with these six countries or even with the developed world. The 30 graphs below all demonstrate significant reductions in carbon emissions as GDP is growing, demonstrating a decoupling between GDP growth and carbon emissions. Note that Azerbaijan’s GDP grew by 93% as its carbon emissions was reduced by 7% (all carbon emissions below are adjusted for trade).
Data sources: Global Carbon Project & World Bank. There are more countries that achieved the same, but only those countries for which data is available and for which each exceeded 5% are shown. The graphs are from Our World in Data <<Link-1>>. All carbon emissions in the graphs above are adjusted for trade.
The World’s Carbon Emissions Per Capita Has Flattened
World GDP per capita has increased by 83.54% since 1990 while carbon emissions per capita have grown by 9.48%. That may not be as impressive but note two things. That is still a decoupling between economic growth and if you look in the graph, you’ll see that carbon emissions were higher in 2008 to 2019. The curve has flattened and gone down a bit. Global Warming caused by our burning of fossil fuels may be the greatest environmental challenge in recorded history, but we are slowly and steadily turning things around. We are not doing it fast enough to avoid major damage to our eco systems and perhaps civilization, but we are still turning things around. If you have any doubts about global warming / climate change or that we are causing it click here for a summary of the evidence.
Data source: Data compiled from multiple sources by World Bank (2025); Global Carbon Budget (2024); Population based on various sources (2024). The graph is taken from Our World in Data <<Link-1>>.
China’s Carbon Emissions
One reason the world’s carbon emissions per capita have not been reduced much despite the fact that so many countries have reduced their emissions is that the world’s largest emitter China, has grown their carbon emissions steadily since 1990. Between 1990 and 2023 China’s GDP per capita (and adjusted for inflation) grew by 1,245.28% and their emissions grew by 288.43% per capita. Remember that China has 1.4 billion people so that is a big carbon blast for the world.
However, before you blame China too much remember that China’s carbon emissions per capita is less than that of the United States and that of many other developed countries, and the country with the largest cumulative carbon emissions is the United States. China’s economic growth has been immense, and its immense population of 1.4 billion people explains its huge impact on the world’s carbon emissions.
Super fact 34: Climate Scientists agree that Global Warming or if you call it Climate Change is happening, and that it is caused by us primarily because of our burning of fossil fuels. There is a long-standing scientific consensus on these two facts because the evidence is conclusive. Typically, studies show an agreement of at least 97% or 98% among climate scientists.
This is a super fact because surveys show that this is not what the public believes and yet it is true. The public incorrectly believes that there is a large disagreement among scientists on this topic. A note, to understand why the evidence is conclusive as to why global warming is happening and is caused by us click here.
Note : I will use the term “global warming” in this review. Whether you call the phenomenon climate change, climate disruption, or global heating, is not important.
The Scientific Consensus
This extensive survey from 2013 of 12,000 climate papers (papers published over two decades) by Dana Nuccitelli and Cook, etc., concluded that 97.1% of climate scientists endorsed the consensus position that humans are causing global warming.
They also did a science author self-rating which concluded that 97.2% of climate scientists endorsed the consensus position that humans are causing global warming. Another conclusion from the survey was that the consensus had increased from around 90%, perhaps less, in the early 1990’s.
A later review of six independent, peer-reviewed studies examining the scientific consensus about global warming have concluded that between 90% and 100% of climate scientists are convinced human-caused global warming is happening. A more recent study (2021) found that as many as 98% of climate scientists are convinced global warming is happening and is human-caused. Numerous other surveys have concluded the same thing.
People’s Beliefs About Global Warming
This 2024 survey from Yale University show that most Americans (61%) understand that global warming is mostly human caused. By contrast, 28% think it is caused mostly by natural changes in the environment. Most Americans (58%) <<Link-6>> understand that most scientists think global warming is happening. This percentage has trended generally upward since this survey began in 2008. By contrast, about one in five (22%) think there is a lot of disagreement among scientists about whether global warming is happening.
The green graph corresponds to “most scientists think global warming is happening (%).” The black graph corresponds to “there is a lot of disagreement among scientists (%)”. The yellow graph corresponds to “Most scientists think global warming is NOT happening (%)”. Graph taken from the Yale Program on Climate Change Communication.
However, only one in five Americans (20%) understand that nearly all climate scientists (more than 90%) think that human-caused global warming is happening. The aforementioned Dana Nuccitelli refers to this in his book Climatology versus Pseudoscience as the consensus gap. Again, this large discrepancy between public perception and reality makes the consensus gap a super fact. Research has shown that this discrepancy has a large impact on people’s other beliefs regarding global warming.
The question was, To the best of your knowledge what percentage of climate scientists think that human-caused global warming is happening? Graph taken from the Yale Program on Climate Change Communication.
Why is there a Consensus Gap?
In his book Climatology versus Pseudoscience Dana Nuccitelli explains that a relatively small group of so-called climate skeptics, or more accurately called climate contrarians have received a lot of attention from media. Even though their science is bad, and they’ve published their error ridden papers in obscure or discredited journals, and the fact that their predictions have failed repeatedly many times over, they have had an enormous influence on public discourse. Conservative politicians, and many talk show hosts are blindly devoted to their falsehoods, whilst real scientists are being attacked.
It is not just rightwing media who are using them for their purposes, but mainstream media are giving the contrarians undue attention as well. Sensationalism is one issue. A science contrarian claiming that all the climate scientists are wrong, and that he is the only one who finally got it right is a lot more interesting of a story than a repeat of the consensus. Another issue is false balance. Journalist should not feel that they must give equal time to evidence-based science and nonsense, but that is often the case. To read my review of this book click here.
The Oregon Petition
I am mentioning the Oregon petition because I fell for it myself. The Oregon petition was an official looking petition circulated by climate contrarians, claiming that there is no evidence that human-caused global warming will cause catastrophic heating of earth’s atmosphere and disruption of earth’s climate, and that adding more carbon dioxide to the atmosphere would even be beneficial for plants and animals. It got an impressive number of signatures, 32,000 after some years.
However, it turned out that the signatories rarely had climate expertise, and were not scientists, and the survey listed many falsified names such as the names of the Spice Girls and several fictional characters. Less than 200 of the signatories were climate researchers.
It was a con, but it was touted in a lot of media as the truth. I saw it over and over and I believed it. I was later surprised to learn that it was a con and that a scientific consensus existed on global warming / climate change. Learning that I had been bamboozled on this matter was one of the red flags that prompted me to start doing some fact checking on the issue global warming.
Super fact 33: Actions such as eating locally, buying organic produce, using paper straws, and recycling can be good for the environment but can also be worse for the environment and these actions often have a much smaller positive impact than alternative rarely considered actions. What are popular actions for the environment is often different from what is effective.
I consider this a super fact because the beliefs regarding what is good for the environment and what is bad for the environment and what has a significant impact and what has not, are often based on popular trends and culture rather than knowledge. We need to educate ourselves. Following trends is not the answer to good stewardship of the planet.
This content was generated by an Artificial Intelligence (AI) system. Asset id: 2531547331
Is Locally Grown Food Really Better for the Environment?
As I explained in this post eating locally is not necessarily ecological. Agricultural products that are grown off season or in non-native environments are often grown in greenhouses, which require a lot of energy and generate significantly more emissions than shipping the produce across oceans would. This is especially true for crops like tomatoes, cucumbers, mangoes and bananas, that require warmer climates to be grown in open fields.
From pexels.com by Julia Nagy.
In some cases, the crop requires significant water resources or chemical inputs to thrive and may not be suitable for warmer climates, for example, apples. Some crops, like avocados or almonds require a lot of water but despite that they are grown in dry places like California (80% of California’s freshwater is used for agriculture). From an environmental perspective it would be better to grow these crops in a suitable environment and then transport them.
Is Eating Organic Really Good for the Environment?
As explained in this post eating organic is not necessarily ecological. Despite strong public perception of organic agriculture producing better environmental outcomes, conventional agriculture often performs better on environmental measures including land use, greenhouse gas emissions, and pollution of water bodies. There are, however, some contexts where organic agriculture may be better for the environment.
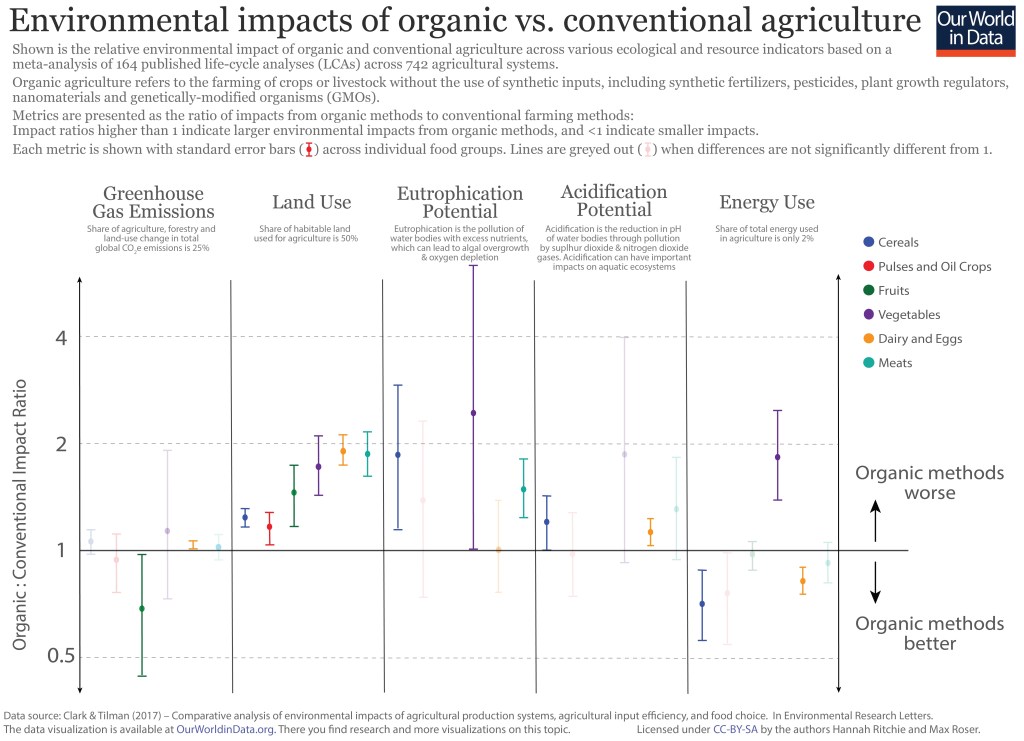
The graph below gives an overview of the environmental impact of various types of crops grown organically and conventionally. As you can see organic crop often require double as much land compared to conventionally grown crops. It is complicated.
Shown is the relative environmental impact of organic and conventional agriculture across various ecological and resource indicators based on a meta-analysis of 164 published life-cycle analyses (LCAs) across 742 agricultural systems. Roughly, lower in the graph means organic is better and higher up in the graph means conventional farming is better. Data source: Clark & Tilman (2017) – Comparative analysis of environmental impacts of agricultural production systems, agricultural input efficiency, and food choice. In Environmental Research Letters. The data visualization is available at OurWorldinData.org<<Link-10>>. There you can find research and more visualizations on this topic. Licensed under CC BY-SA by the authors Hannah Ritchie and Max Roser.
What really matters though is the type of food you eat, not whether it is organic or not. For example, beef (from beef herd) causes emissions 188 times larger than nuts do for the same amount of protein provided. Another thing to note is that if you eat 300 steaks per year you will have a 100 times larger environmental impact from your meat eating compared to someone who eats 3 steaks per year. You don’t have to become a vegetarian to have a smaller environmental impact but quantity matters.
Is Recycling Important?
The common perception that recycling is one of the best things you can do for the environment is not correct. Its impact is often not very large and if not done properly it can be counterproductive. If you throw a greasy pizza box in the recycling, you can ruin the entire batch.
Surveys across 21,000 adults in 30 countries showed that the two actions among twelve that people believed saved the most greenhouse gases were recycling (59%) and upgrading lightbulbs (36%). As it turns out, those two saved the least greenhouse gases among the twelve options. The option saving the most greenhouse gases among the 12 was giving up an SUV, which saved 18 times as much greenhouse gases as recycling. 17% of respondents picked that one.
According to Our World in Data (and the book Not the End of the World page 114<<Link-6>>), which is based on this research, giving up an average SUV for a sedan would save 3.6 metric ton, or 22.5% of the carbon emissions for the average American. Switching to a plant-based diet would save 2.2 metric ton per person, or 13.8%. Recycling comes in at a savings of 0.2 metric tons according to the same data. EPAs estimates are slightly higher but still low in comparison.
Plastic straws versus paper straws
Producing a plastic straw requires 39 kilojoules of energy and produces 1.5 grams of carbon dioxide emissions. However, producing a paper straw requires 96 kilojoules of energy and produces 4.1 grams of carbon dioxide emissions. So, plastic straws are better for the environment from that perspective. However, this could be compared to a typical passenger vehicle, which emits about 4.6 metric tons of CO2 per year according to EPA. That corresponds to more than 3 million plastic straws and more than one million paper straws.
According to the same article the average passenger vehicle emits about 400 grams of CO2 per mile. So, driving just one mile corresponds to hundreds of plastic straws and paper straws.
One advantage of paper straws is that they are easier to recycle, at least under ideal circumstances. Unfortunately, they often get soggy, and recycling plants don’t want that so they often throw them out. Another advantage is that paper straws decompose and don’t end up in our ocean.
However, not only are straws very small items, most of the plastic pollution in the ocean does not come from north America(1%) or Europe (1%). Paper straws versus plastic straws seem like a complex riddle but it may not be an important one. Whether you drive more or drive less is probably a lot more important.
Plastic bags versus paper bags
As with plastic straws versus paper straws plastic bags versus paper bags is a complicated question. From an environmental perspective they both have advantages and disadvantages. Plastic bags are less carbon intensive to produce, are easier to reuse several times, and the production of plastic bags require on average four times less energy than the production of paper bags.
On the other hand, paper bags are decomposable and easier to recycle. However, the chemicals and fertilizers used in producing paper bags create additional harm to the environment. It is a complicated question.
Plastic Ocean pollution. Whale Shark filter feeds in polluted ocean, ingesting plastic. Asset id: 1120768061 by Rich Carey
Having a Significant and Positive Impact on the Environment
Some of the allegedly sustainable practices and actions mentioned above are counter productive and others have a very small effect, for example, carbon emissions savings that are a few grams. According to the “Our World Data” and the book “Not the End of the World” page 114, a compilation of data research, some actions that you can take that will significantly reduce carbon emissions are (savings in metric tons per year, for flight it is per trip):
Giving up an SUV 3.6 tons
Go car free (average car) 2.4 tons
Switch to plant-based diet 2.2 tons
Avoid transatlantic flights 1.6 tons
Buy green energy 1.5 tons
Switch to electric car (from average sedan) 1.2 tons
Switch from electric car to none 1.2 tons
Avoid medium flight 0.6 tons (1,700 miles each way going and returning)
Laundry in cold water 0.25 tons
Hand-dry clothing 0.2 tons
Recycle 0.2 tons
Upgrade light bulbs 0.1 tons
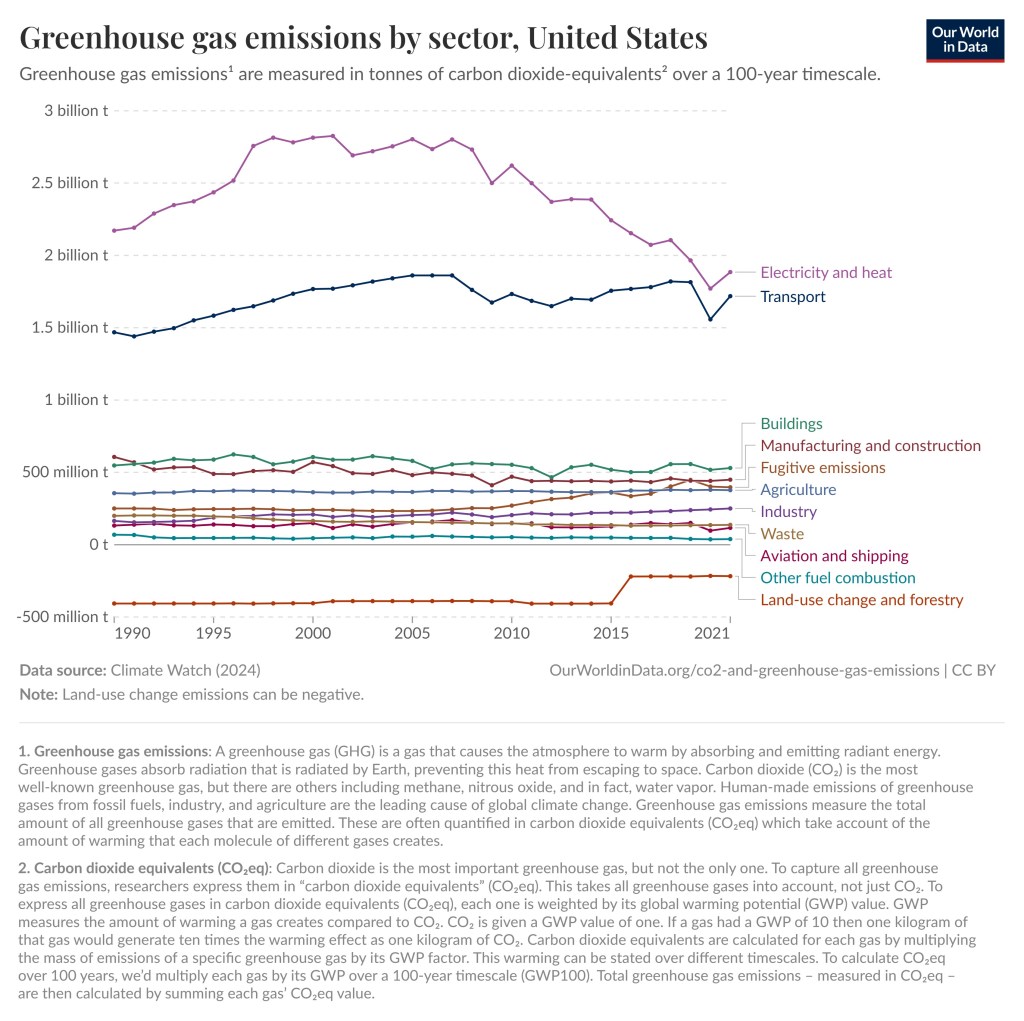
As you can see in the graphs below, the largest contributor of greenhouse gas emissions in the World and in the United States is electricity and heat. Unfortunately, the composition of the electric grid is something we as consumers have very little control over. We can save energy, get solar panels for our roof, or buy our electricity from green energy companies, but we cannot easily change the composition of the grid. Energy companies and politicians must do that.
However, we can make our voices heard by calling and writing to our representatives. This might be the single most impactful action that you as an individual can take. Your congressman, senator, or state legislator will probably not read your letter. They have hundreds of thousands or millions of constituents and get lots of letters every day. What is likely to happen is that a staff member will skim the letter and note the concern in a database.
Just make sure that your letter is politely written so it does not go in the wastebasket. Also make sure that you are a constituent. Writing to Ted Cruz when you live in Florida is not going to have an impact. They are interested in finding out what the concerns of their constituents are and according to staff members and other information I have come across, this really has an impact.
Data source : Climate Watch (2024). Note : Land use emissions can be negative. OurWorldinData.org/co2-and-greenhouse-gas-emissions| CC BYData source : Climate Watch (2024). Note : Land use emissions can be negative. OurWorldinData.org/co2-and-greenhouse-gas-emissions| CC BY
Conclusion
The survey mentioned above showed that among the twelve environmental actions an individual could take, the one with the second to smallest positive impact was the one that the majority thought had the biggest positive impact, despite it having a relatively tiny impact. The actions that could really make a huge difference were hardly considered.
We, the public, are very bad at determining what is good or bad for the environment and what has a significant and positive impact or not, even though the data is out there and we easily can look it up. Maybe the biggest positive impact one could have on the environment is to look up the facts and get better educated.
The goal of this blog is to create a list of what I call super facts. Important facts that we know to be true and yet they are surprising, shocking or disputed among non-experts. It is a type of myth busting. However, I also create posts that are not super facts but other interesting information, such as this book review and book recommendation.
Climatology versus Pseudoscience: Exposing the Failed Predictions of Global Warming Skeptics by Dana Nuccitelli
Climatology versus Pseudoscience by Dana Nuccitelli is a book about human-caused Climate Change, or global warming, and how we know that is happening and how we know that we are the cause of it. If you want to see more about why we know this click here.
The book pays a lot of attention to so called climate skeptics; more accurately called climate contrarians. They are not true skeptics but agenda driven contrarians. Even though their science is bad, and their predictions have failed repeatedly many times over, they have had an enormous influence on public discourse. Conservative politicians, and many talk show hosts are blindly devoted to their falsehoods, whilst real scientists are being attacked. Large segments of the population in the United States, and to some extents elsewhere, have been bamboozled by the pseudo-science.
The good news is that people are waking up to the reality that they have been bamboozled. We know that global warming, or if you call it climate change, is not only real, but we also know that the current rapid warming is caused by us, primarily via our carbon emissions. I was bamboozled by the pseudo scientists myself, but then I took a serious look at the science, and I realized that that I had been bamboozled. This book will walk you through the faulty arguments of the climate contrarians, and it does so in a logical and convincing manner. It features hundreds of references. I bought the hardback version of this book.
Hardcover – Publisher – Praeger; Illustrated edition (March 3, 2015), ISBN-10 : 1440832013, ISBN-13 : 978-1440832017, 232 pages, item weight : 1.3 pounds, dimensions : 6.14 x 0.56 x 9.21 inches, it costs $11.96 – $53.00 on US Amazon. A new copy is $53.00. Click here to order it from Amazon.com.
Kindle – Publisher – Praeger; Illustrated edition (March 3, 2015), ASIN : B0C71FFTQT, 230 pages, it costs $50.35on US Amazon. Click here to order it from Amazon.com.
Front cover of Climatology versus Pseudoscience. Click on the image to go to the Amazon page for the hardcover version of the book.
Amazon’s Description of Climatology versus Pseudoscience
This book explains the science of climate change in plain language and shows that the 2 to 4 percent of climate scientists who are skeptical that humans are the main cause of global warming are a fringe minority—and have a well-established history of being wrong.
Although some politicians, pundits, and members of the public do not believe it, global warming predictions by mainstream climate scientists have been remarkably accurate while those made by climate deniers have not. And if mainstream global warming predictions continue to prove correct, the window of opportunity to prevent a climate catastrophe is quickly closing. This book is the first to illustrate the accuracy—and inaccuracy—of global warming predictions made by mainstream climate scientists and by climate contrarians from the 1970s to the present day. Written in simple, non-technical language that provides an accessible explanation of key climate science concepts, the book will appeal to general audiences without previous knowledge about climate science.
A Journey into Climate Science and a Debunking of Climate Contrarianism
The author starts out by giving us an overview of climate science starting with the discovery of the greenhouse effect by Jean Baptiste Joseph Fourier in 1820’s. He explains that the planet would be much colder than it is if it wasn’t for the greenhouse effect. The greenhouse effect acts like a blanket. He also explains why we know that the global warming that we have seen in recent decades is a greenhouse effect chiefly caused by our burning of fossil fuels, and not natural causes.
The warming is leaving behind various fingerprints, such as the upper atmosphere cooling while the lower atmosphere is warming (like a blanket would), which wouldn’t happen if it was the sun or an orbital cycle causing the warming. The conclusion is that we know that global warming is real, and we know that we are the ones causing it.
Note : I will use the term “global warming” in this review. Whether you call the phenomenon climate change, climate disruption, or global heating, is not important.
The author also discusses climate models, and he notes the astounding accuracy of the early climate models. He takes us on a journey through the development of modern climate science into the 1950’s, and the rapid growth of climate science in the 1960’s and 1970’s and then into the 1980’s, 1990’s and the 2000’s. He describes the increasingly advanced and increasingly accurate climate models. In addition, he discusses sulfate aerosols and global warmings forgotten evil twin ocean acidification.
This is all very interesting to any science nerd and it makes you understand why we know that we are causing the global warming we are seeing. It also makes it obvious why there is a consensus on the topic. Several studies have shown that at least 97% of climate scientists believe that global warming is real and that we are the cause of it.
However, despite the scientific rigor of peer reviewed mainstream climate science, despite the impressive success of climate models, and despite the scientific consensus, the public is very confused about the topic. Enter a small group of so-called global warming skeptics, or more accurately, global warming contrarians. They are not true skeptics but agenda driven contrarians. Even though their science is bad (pseudoscience) and the fact that their predictions have failed repeatedly many times over, they have an outsized presence in the media and often a large enthusiastic following.
It is not just rightwing media who are using them for their purposes, but mainstream media are giving the contrarians undue attention as well. Sensationalism is one issue. A science contrarian claiming that all the climate scientists are wrong, and he is the only one who finally got it right is a lot more interesting of a story than a repeat of the consensus. Another issue is false balance. As a journalist you should not feel that you must give equal time to evidence based science and nonsense.
The author also discusses various myths and false claims spread by climate science contrarians. He mentions that unfortunately most Republican congressmen stand with the contrarian pseudoscientists rather than with the science. Well, with the exception for a few brave souls. On average the American public believe that 55% of scientists agree that we are the cause behind the global warming while the consensus is more than 97% and growing stronger. The author refers to this as the consensus gap.
It is easy to be confused. I have a degree in physics and a PhD in electrical engineering / robotics and yet I was bamboozled by the climate science contrarians. I read books by the contrarians including some of the ones the author discusses, and I believed them. I also followed pretty much only rightwing media at the time and as a result I became misinformed. It was not until I took a deep dive into the subject and read what the actual science said that I realized that I had been bamboozled. Some of the science articles that initiated my change of heart were written by the author. That was back in 2012 and 2013.
This book is a great start if you want to take a serious look at climate science. The book is well organized, and the author is an expert on the subject, as well as a great communicator. Even though many of the things he discussed in the book were not new to me, I very much enjoyed reading the book and I learned some new things. If you don’t know much about climate science but are interested in science, then this book is a must read.
Back cover of Climatology versus Pseudoscience. Click on the image to go to the Amazon page for the Kindle version of the book.
About the Author of Climatology versus Pseudoscience
Dana Nuccitelli is an environmental scientist and climate blogger for The Guardian and SkepticalScience.com. He’s been researching and writing about climate science since 2006. He has a bachelor’s degree from UC Berkeley in astrophysics, and a master’s degree from UC Davis in physics.