The goal of this blog is to create a list of super facts. Important facts that are true with very high certainty and yet surprising, misunderstood, or disputed by many. This blog aims to be challenging, educational, and fun, without it being clickbait. I determine veracity using evidence, data from reputable sources and longstanding scientific consensus. Prepare to be challenged (I am). Intentionally seek the truth not confirmation of your belief.
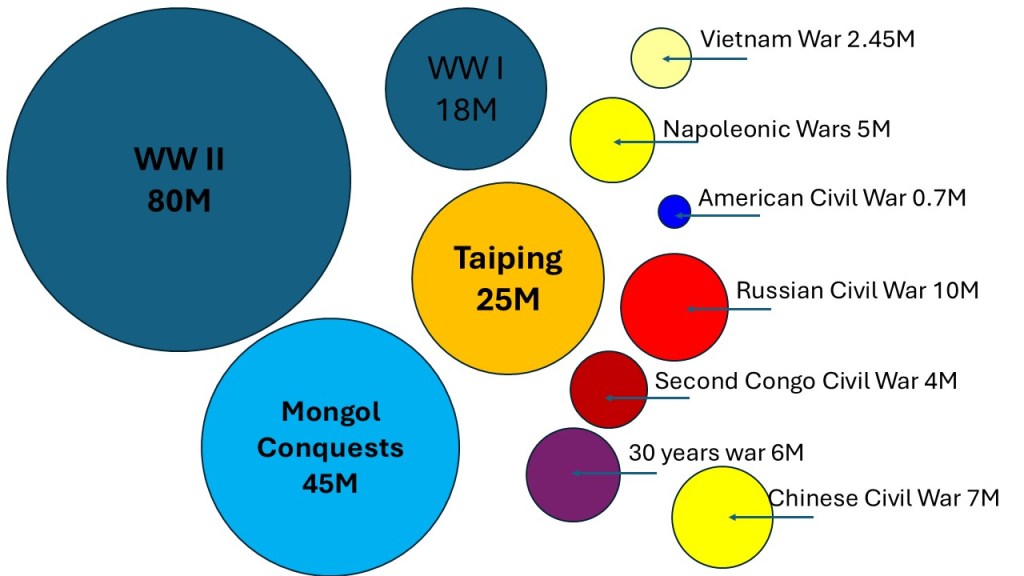
Superfact 93 :Around 20 to 30 million people died in the Taiping Rebellion, 1850 to 1864. It is the deadliest civil war in known history, the deadliest war in the 19th century, and the second deadliest war in all of known history. World War II was the deadliest.
The number of deaths cited in the graphics above are rough midpoint values of the estimates. The area of the circles corresponds to these midpoint estimates. Note Mongol conquests correspond to multiple wars during a time period of 162 years. The ‘M” corresponds to millions.
The Taiping rebellion is estimated to have caused the deaths of 20-30 million people. However, some estimates estimate that as many as 70 million people might have died in the Taiping rebellion. The Mongol invasions and conquests cost 30-60 million lives, but they comprised many wars and took place during a time period of 162 years (1206 – 1368). Therefore, you typically don’t count that as one war. Also note that the estimate for deaths caused by World War I does not include the Spanish flu.
I consider this a super fact because it is true, an important history fact and despite the enormous losses in the Taiping rebellion, a lot of people have never heard of it.
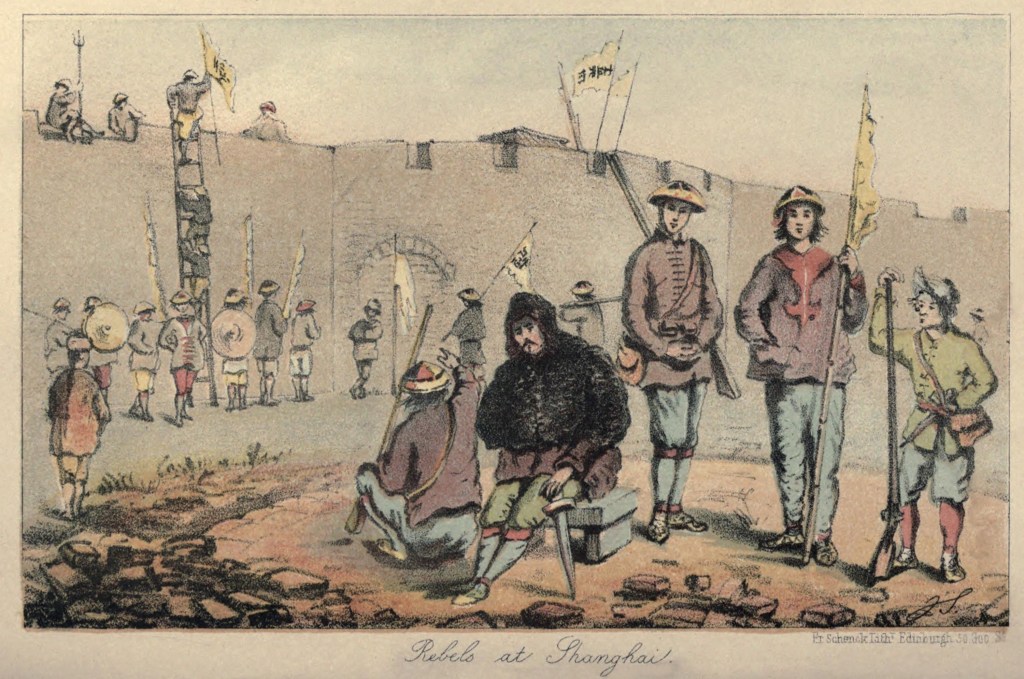
Taiping Rebels at Shanghai China in 1853-54. ‘Small Swords’ refers to daggers used by warriors or martial artists in close combat. 19th century print. Stock Illustration ID: 237232531 by Everett Collection.
The links above are from Encyclopedia Britannica and from Wikipedia. Also note that after the Napoleonic Wars entry I only listed wars that happened after World War II and resulted in around a million deaths. The exception is the American Civil War. The list would be too long otherwise.
The Taiping Rebellion
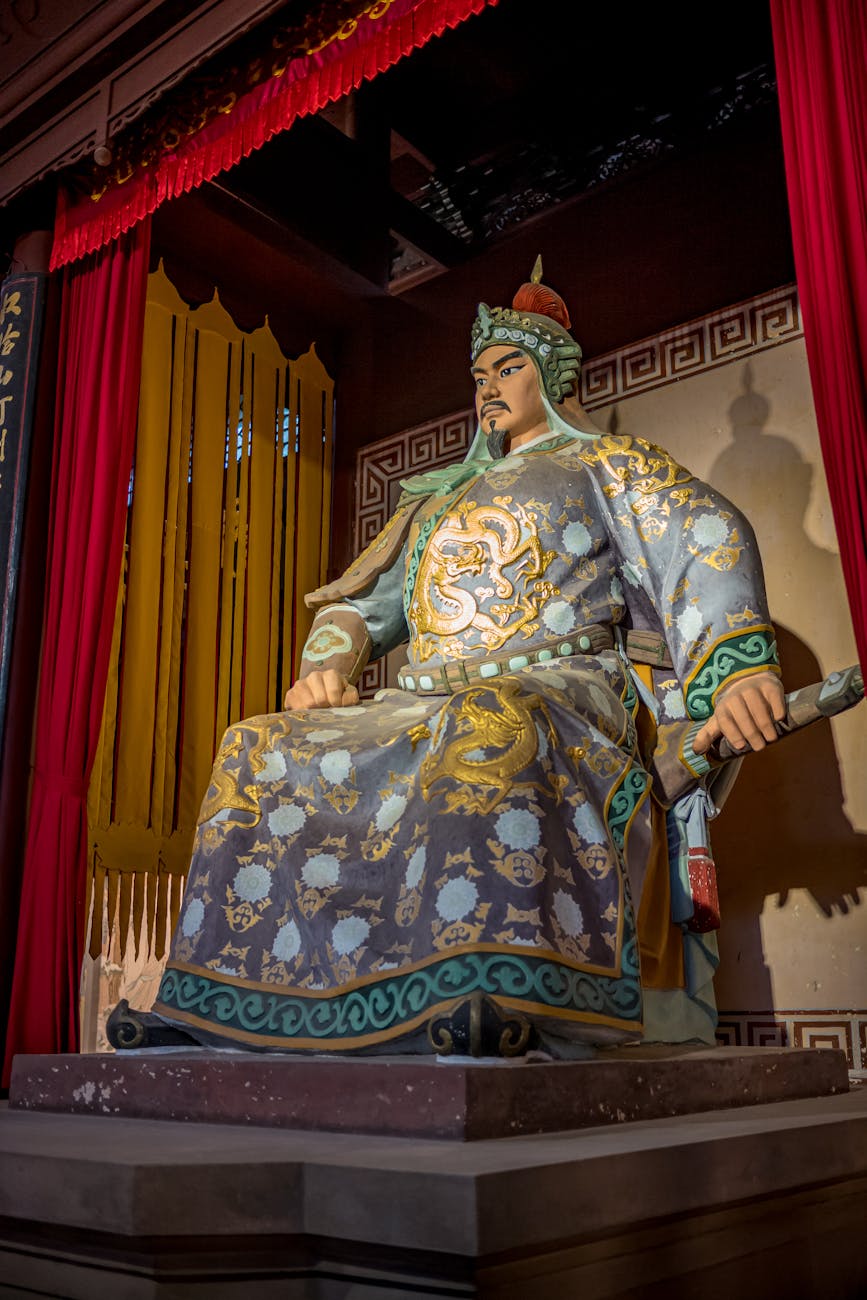
The Taiping Rebellion was a civil war in China between the Qing dynasty and the Taiping Heavenly Kingdom. The Taiping Heavenly Kingdom was a theocratic monarchy that tried to overthrow the Qing dynasty. It was led by Hong Xiuquan, a religious leader who believed he was Jesus younger brother. In the end the Qing dynasty prevailed but at a great cost.
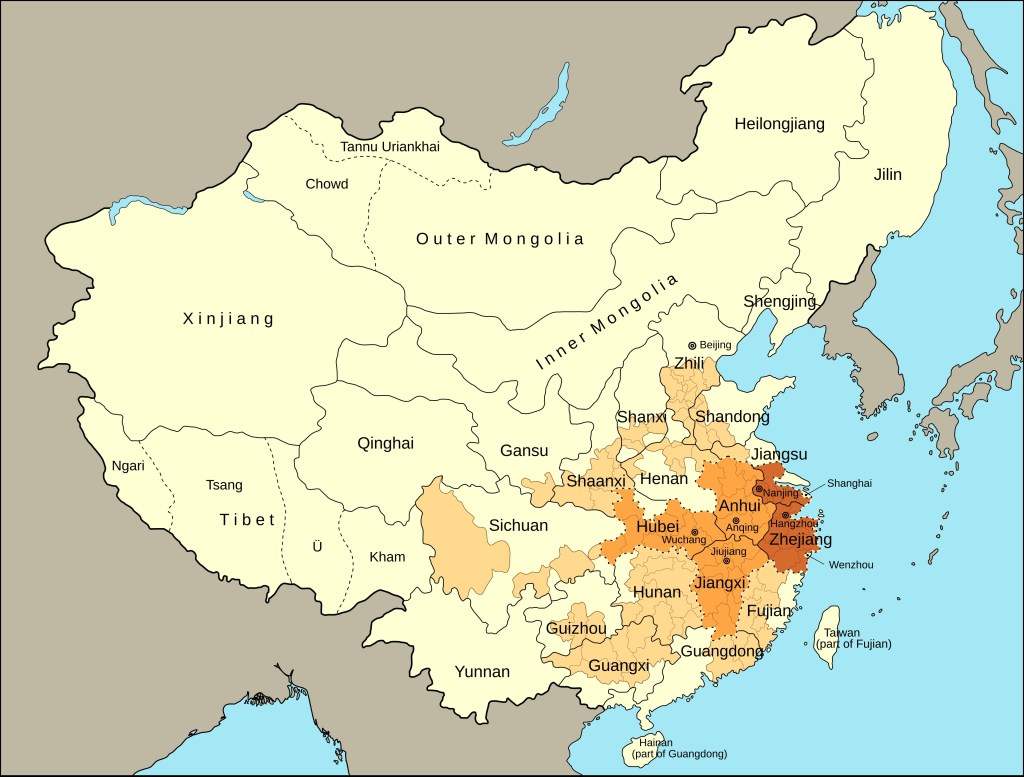
A map showing the extent of the Taiping Heavenly Kingdom. The dark area is the extent towards the end. M.Bitton, CC BY-SA 4.0 https://creativecommons.org/licenses/by-sa/4.0, via Wikimedia Commons.
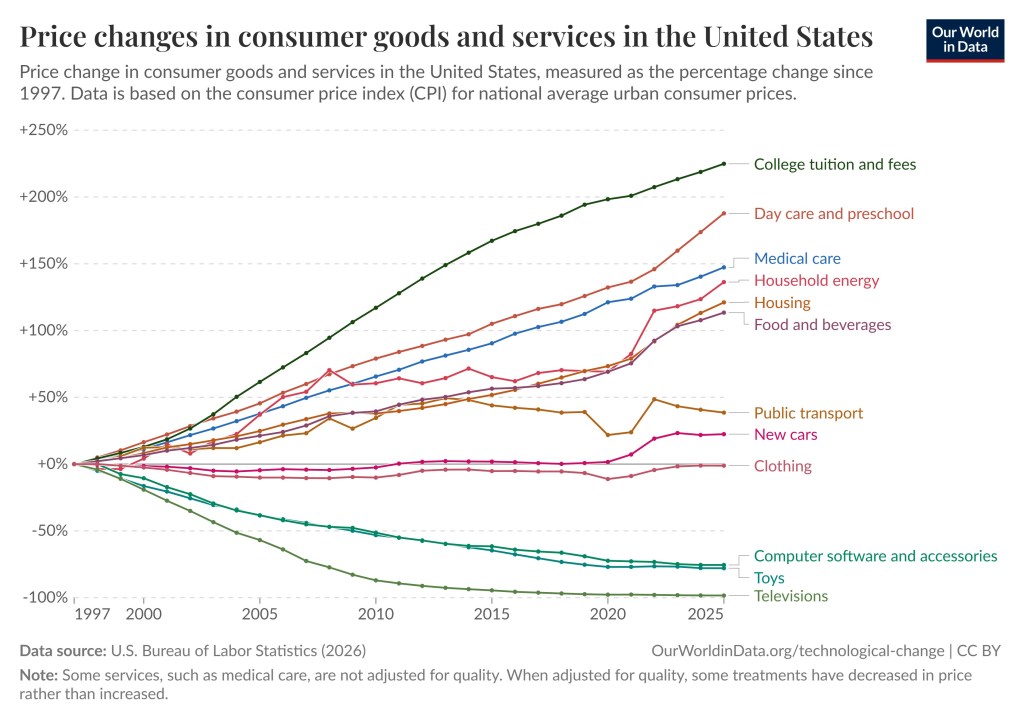
Super fact 92 : College tuition and fees increased by 207% between 1997 and 2022, which corresponds to a tripling. Since 2022 it has continued to increase. Adjusted for inflation this corresponds to a 60% increase, more than any other major economic sector.
Students are sucked into a hole with money for college tuition. Shutterstock Asset id: 335014478 by alphaspirit.it.Data source: US Bureau of Labor Statistics (2026). OurWorldInData.org/technological-change. Note: Some services such as medical care are not adjusted for quality, some treatments have decreased in price rather than increased. To visit the original page for this graph click here or on the picture.
To read about the graph above in greater detail click here. To read more about the increase in college tuition click here, here, here, or here. To calculate the inflation for different periods of time click here (the inflation calculator).
It should be noted in the graphs above that Televisions have decreased in price by 98%, which seems implausible. However, it is not an April 1st joke. It is not April 1st in Texas yet (where I live). The reason for the large decline in price of Televisions is that quality is taken into account. 20 years ago, you could not easily buy the kind of TVs you can today and if you did you would cost you an enormous amount of money. You get a lot more for a few hundred bucks than you did 20 years ago.
This is a superfact because it is true, shocking, and important to how we live.
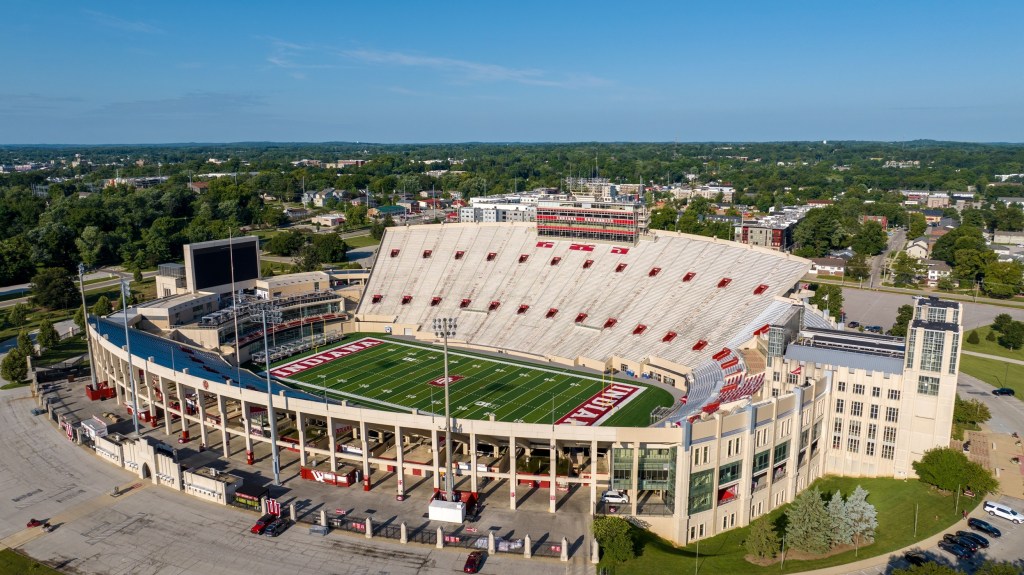
An example of heavy spending on amenities is college sports. I studied at a university called Uppsala University, which is a very large University founded in 1477. It is considered one of the world’s top Universities (top 50). However, they do not have any competitive teams associated with the University itself. In 1987 I was sent as an exchange student (electrical engineering) to Case Western Reserve University, in Cleveland, Ohio. Case Western Reserve University has some competitive teams associated with the University but only a small college football stadium.
However, I quickly came to realize that many American universities have huge college football and baseball stadiums. This is an added expense that you rarely encounter in the rest of the world. Universities are for studies and for learning. Sports teams, whether it is soccer, or American football is a separate issue.
BLOOMINGTON, US – Aug 04, 2025: Side-angle drone view of Indiana University Memorial Stadium with field, stands, and cityscape on a clear summer day. . – Shutterstock Asset id: 2700467103
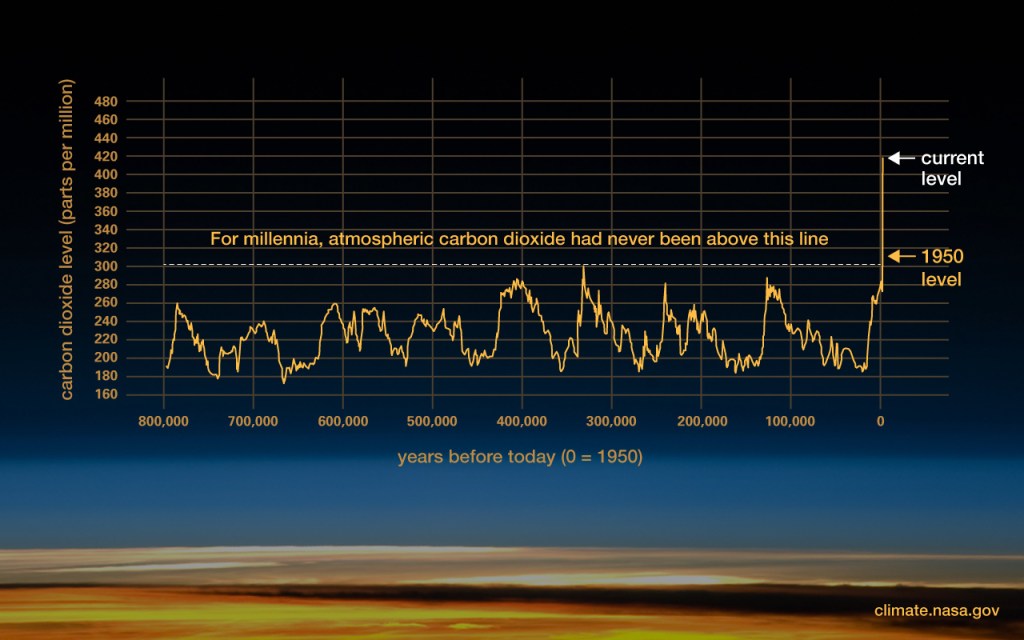
I came across a very interesting post about the science history of greenhouse effect: “The Greenhouse Effect: From Early Chemistry to the Keeling Curve” by Craigavad miscellany a science blog written by a retired academic. It is a very educational and interesting post related to this topic. Please take a look.
From Scripps institute. Keep two things in mind. First the warming from CO2 is delayed and may result in positive feedback that can manifest decades and centuries later. Secondly, human civilization developed during a period of stable climate. That CO2 levels and temperatures were higher millions of years ago is not much comfort.
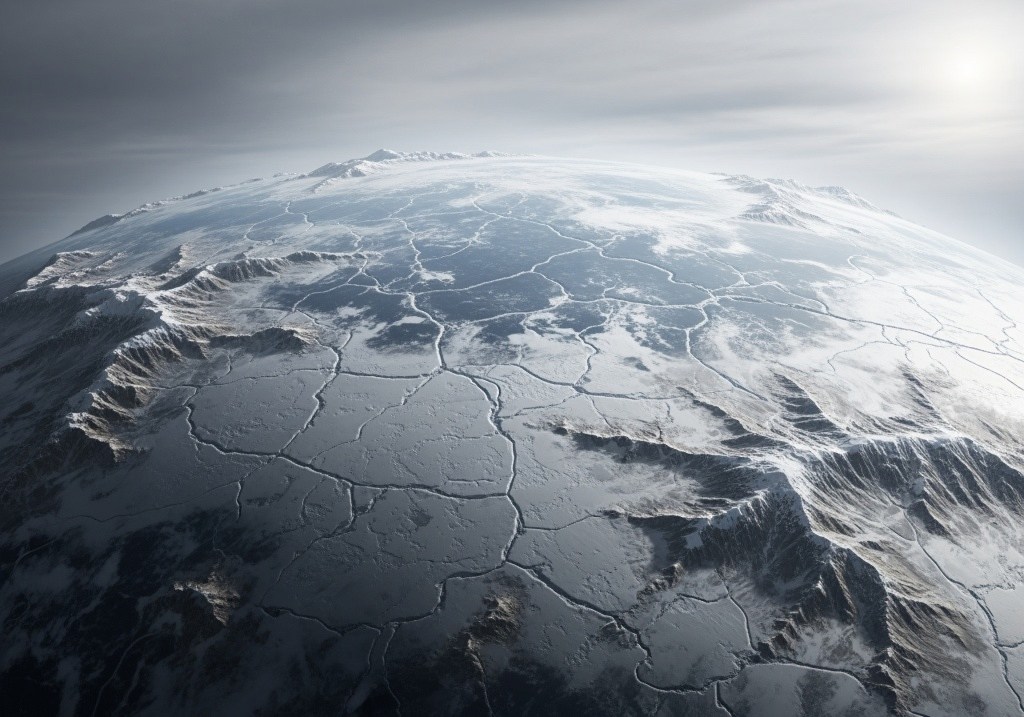
Superfact 91: Without greenhouse gases, the Earth’s average surface temperature would drop from the current 15 Celsius (59 Fahrenheit) to approximately -18 Celsius (0 Fahrenheit), which is an average temperature drop of 33 degrees Celsius. If you removed carbon dioxide from the atmosphere but let the other greenhouse gases stay the drop would be 30 degrees Celsius. In both cases most of the planet would freeze. This is referred to as snowball Earth.
Shutterstock Asset id: 2750019199 by Shutterstock AI
Our planet is much warmer than it otherwise would be because of greenhouse gases. Carbon dioxide, or CO2, is the most important of the greenhouse gases. We are rapidly warming the atmosphere with our carbon dioxide emissions as explained by these articles from NASA and NOAA. If we did the opposite and removed CO2 from the atmosphere we would be cooling the atmosphere. As mentioned, if we removed all greenhouse gases from the atmosphere the planet’s average temperature would drop by 33 degrees Celsius and this NASA article claims it would take 50 years to reach that temperature.
If we removed only carbon dioxide and let all the other greenhouse gases remain, we would get an almost as big temperature drop of 30 degrees Celsius according to the calculations done by this article. Some of you may know that water vapor provides a larger portion of the warming than CO2. In fact, 75% of the greenhouse effect is caused by water vapor and clouds. This seems contradictory. However, when the atmosphere cools, the water vapor will rain out of the atmosphere unlike CO2. Basically, water vapor will adjust to the temperature whilst CO2 is forcing the temperature. It is crucial to understand this difference. That is why CO2 is the most important greenhouse gas. In summary, we need just the right amount of CO2 for a healthy climate.
I consider this a super fact because it is true, it is an important fact, and I believe it is a surprising fact to many, especially those who doubt carbon dioxide’s importance to the global warming we are experiencing. I called it global warming but whether you call it global warming, climate change, or climate disruption, we are talking about the same thing.
Snowball Earth
Shutterstock Asset id: 2749007159 by Shutterstock AI
Scientists believe there have been at least two major “Snowball Earth” events between 720 and 635 million years ago where ice and snow covered nearly the entire planet. These snowball earth events were triggered by natural events, likely a plunge in sunlight, followed by a plunge in carbon dioxide not entering the atmosphere, and amplified by sunlight reflecting back into space. All three effects made Earth cooler. The recent ice ages were likely caused primarily by earth’s orbital cycles. Climate changed in the past due to natural phenomena, but that does not mean that the current very rapid warming (rapid geologically speaking) is natural.
If you want to understand why we can be so sure that it is our CO2 emissions that is causing the current global warming, not the sun, not volcanoes, not orbital cycles, and not another natural process, please check out the list of evidence in the second part of this post “Global Warming is Happening and is Caused by us”.
Hothouse Venus
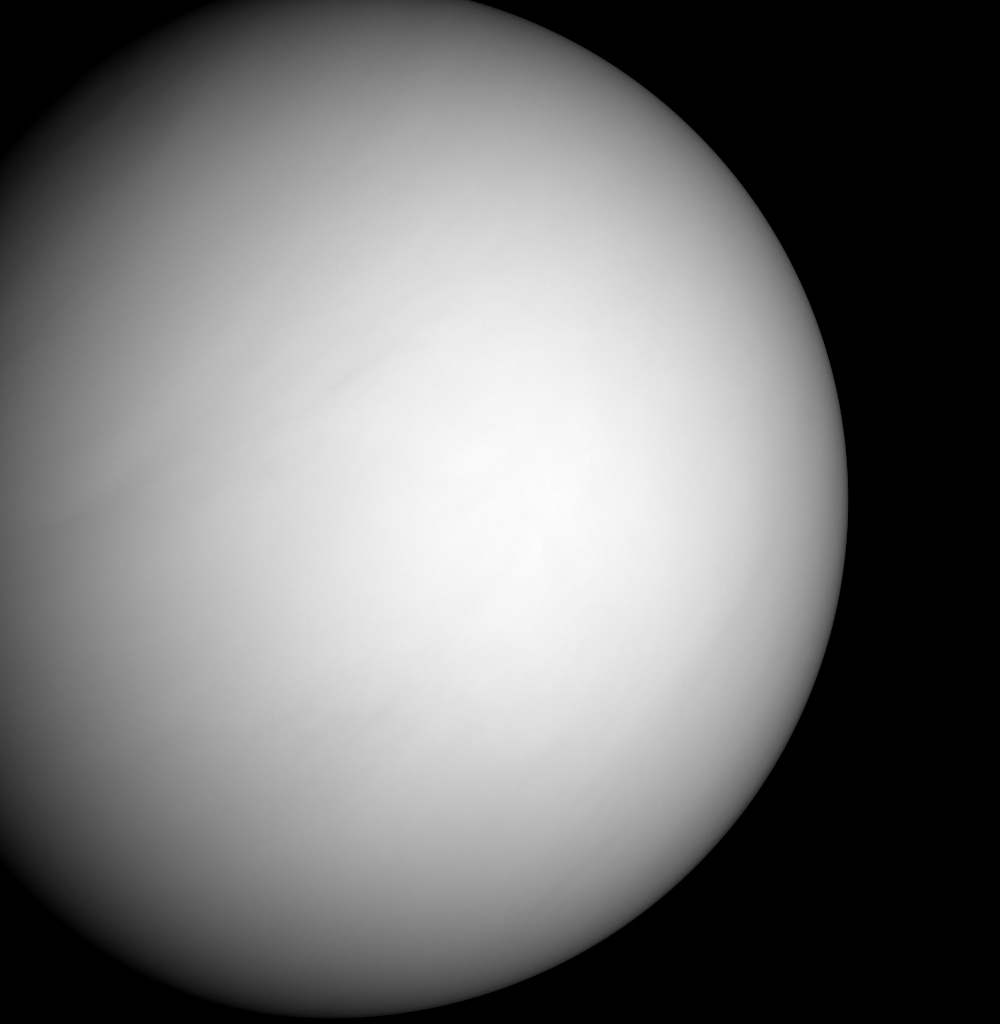
Image taken by the NASA MESSENGER as it approached Venus on June 5, 2007. NASA/Johns Hopkins University Applied Physics Laboratory/Carnegie Institution of Washington, Public domain, via Wikimedia Commons. The image is taken from this Wikipedia article.
The opposite of snowball Earth is hot Venus. Venus is the hottest planet in the solar system due to an extreme runaway greenhouse effect. Surface temperatures are averaging around 465 degrees Celsius (870 degrees Fahrenheit). The thick atmosphere of Venus is composed primarily of carbon dioxide with clouds of sulfuric acid. This causes a greenhouse effect that traps heat.
Despite the fact that Mercury is much closer to the sun (58 million kilometers versus 108 million kilometers) and receives nearly four times as much sunlight per unit area than Venus, Mercury is on average much cooler. The reason is that Mercury’s atmosphere is thin and without a greenhouse effect.
The YouTube video below from NASA explains the greenhouse effect on Venus. It is just one minute long.
Superfact 90: Large Language Models (LLMs) such as ChatGPT, Claude, Llama and Gemini are just one type of popular applications of Artificial Intelligence among hundreds of applications of Artificial Intelligence, and LLMs represents just one branch of Artificial Intelligence.
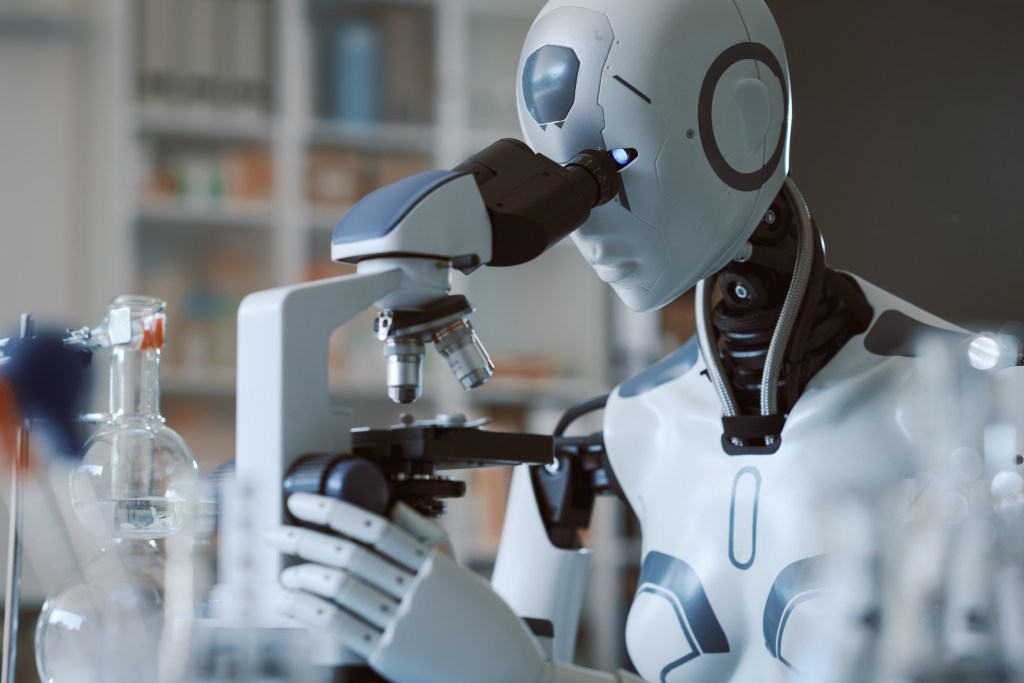
Artificial intelligence and research concept. Shutterstock Asset id: 2314449325 by Stock-Asso
LLMs are currently the most popular “viral” AI. We can all access LLMs in our browsers. This has created the common misconception that Artificial Intelligence is the same as Large Language Models. However, LLMs represent only one branch of narrow AI systems designed to perform specific tasks.
Applications of Artificial Intelligence other than what Large Language Models are used for include robotics, robot motion planning, advanced control systems using AI, self-driving cars, image processing, optical character recognition, classification, facial recognition systems, medical imaging diagnostics, game playing such as chess playing computers, financial fraud detection, cybersecurity, investment robots, route optimization, mathematical proof generation, recommendation algorithms, virtual assistants, programming code generation, smart home devices, drug discovery, and that is just for starters.
There are probably many applications and types of Artificial Intelligence that we have not yet invented.
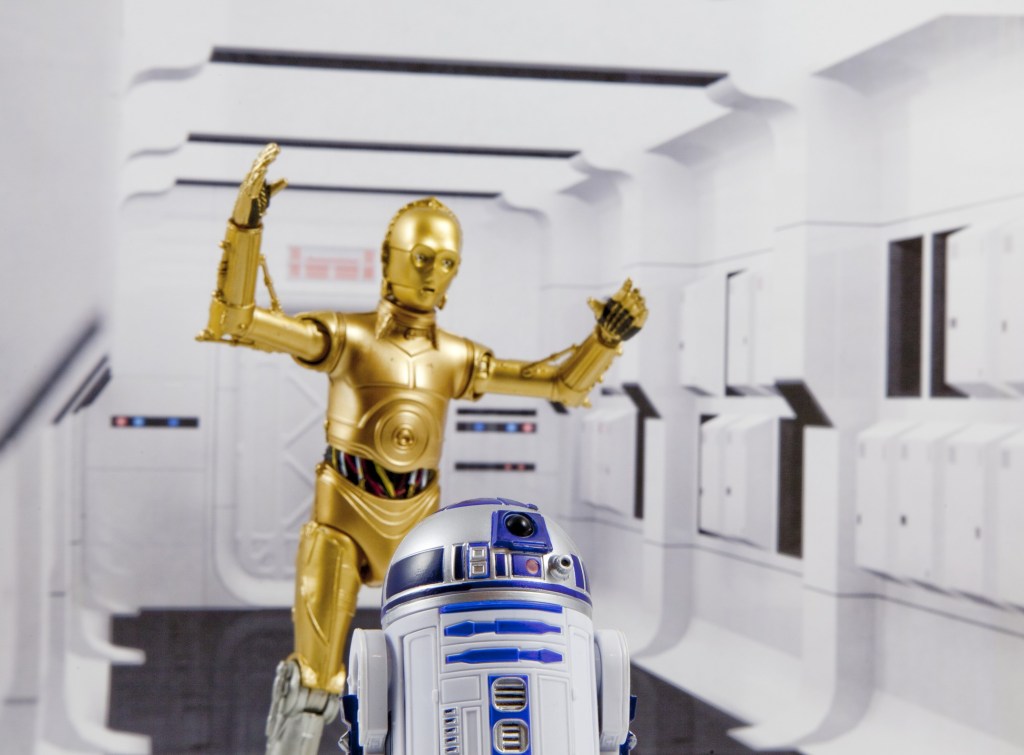
Two Robots powered by Artificial Intelligence. Shutterstock Asset id: 558350728 by Willrow Hood.
LLMs use large neural networks with many hidden layers, so called deep learning algorithms, and they employ the Rumelhart backpropagation learning algorithm invented by David Rumelhart, Geoffrey Hinton, and Ronald Williams. Clearly neural networks with multiple hidden layers and using the Rumelhart backpropagation algorithm are incredibly successful but it is just one of many kinds of Artificial Intelligence algorithms, and who knows what we will see in the future. Related to this post is my previous post Artificial Intelligence is Not New. We have only just begun.
I consider this a super fact because it is true, kind of important, and I believe that the multitude of Artificial Intelligence algorithms and applications is a surprise to many.
The many Artificial Intelligence Algorithms
Shutterstock Asset id: 2645975149
Due to the great improvement and success of Neural Networks, they have become very popular and Large Language Models use very large Neural Networks with multiple hidden layers (employing the Rumelhart back propagation algorithm). You can read more about that here.
However, there are many other AI algorithms, hundreds, maybe thousands. One example is genetic algorithms. These are types of algorithms that mimics evolution. They iteratively select a set of the best candidate solutions, then combine them (crossover), and also add random changes (mutation) to generate new solutions. Then select the best solutions and then you do it again. Selecting the best solutions corresponds to natural selection. I tried out such algorithms at my work, and over many iterations / generations you can get some impressive results. It is easy to understand how a complex organ such as an eye can evolve in a similar way in nature.
One type of decision tree based machine learning algorithm that I used specifically for classification tasks at work was C4.5 and C5. More specifically I used this type of machine learning algorithm for evaluating the results from automatic mail sorting systems. Basically, how well can a result from a certain machine be trusted. I don’t remember exactly but my classes were something along the line of super reliable, pretty reliable, average, and this result probably sucks. Other examples of this type of machine learning are ID3, Random Forest, Gradient Boosting, and CART. These types of algorithms are still very popular.
One advantage of using decision tree based machine learning over neural networks for the same task is that when a decision has been made you can follow the decision tree backwards and see why a decision / classification was made. In fact, if you have less than 100 parameters you could likely do it over a lunch. When a neural network makes a decision all you have is a large bunch of numbers that were spit out by an algorithm that looped possibly thousands of times and changing all the numbers every time. You can’t backtrack and figure out exactly how a decision was made. You just have to trust the neural network. The advantage of a neural network in this situation is that if it is trained properly, it is likely to have a better result.
Another type of algorithm used in Artificial Intelligence is search algorithms. For robot motion planning I used an algorithm called A* or A-star, which is a very efficient pathfinding algorithm. It comes in dozens of variants and there are hundreds of other types of search algorithms.
These are just a few examples, but there’s also knowledge based agents, AI-agents with reinforcement learning algorithms, algorithms based on Bayes’ Theorem, Vector Machines, Markov Decision Processes, clustering algorithms, K-nearest neighbor (KNN) algorithm, simulated annealing, hill climbing, the ant colony optimization algorithm, and of course neural networks and there are also many types of neural networks. I used a relatively unknown form of artificial intelligence called reflex control for my robotics research. The point is, there is zoo of artificial intelligence algorithms out there. Deep learning neural networks are very popular AI algorithms but far from the only ones.
My Personal Experience with Artificial Intelligence
In 1986, when I was in college in Sweden, I took a class in the LISP programming language. LISP was the first Artificial Intelligence programming language, and it was invented in 1958. In 1987, as a university level exchange student, I took a class called Artificial Intelligence at Case Western Reserve University. That same year I also took a class called Pattern Recognition which introduced neural networks to me.
In 1986 a landmark paper was published by David Rumelhart, Geoffrey Hinton, and Ronald Williams introducing the Rumelhart backpropagation algorithm. Geoffrey Hinton received the Nobel Prize in physics in 2024. David Rumelhart and Ronald Williams were both dead and could therefore not receive the Nobel Prize. The Nobel Prize was also given to John J. Hopfield, another pioneer in neural networks. He invented the Hopfield network. You can read more about neural networks and the Nobel Prize in physics in 2024 here.
The Rumelhart backpropagation algorithm was a giant leap forward for neural networks and for Artificial Intelligence and it is the algorithm used by ChatGPT and the other large language models. Geoffrey Hinton is often interviewed in media and often presented as the father of Artificial Intelligence. He is not, but he us arguably partially responsible for the greatest leap forward in neural networks, as well as Artificial Intelligence.
In the pattern recognition class, we used the Rumelhart backpropagation algorithm on a simple neural network to read images with text. Later I did research in the field of Robotics where I implemented various Artificial Intelligence algorithms as mentioned above. I have a PhD in Applied Physics and Electrical Engineering with specialty in Robotics. Later I would use artificial intelligence algorithms in my professional career.
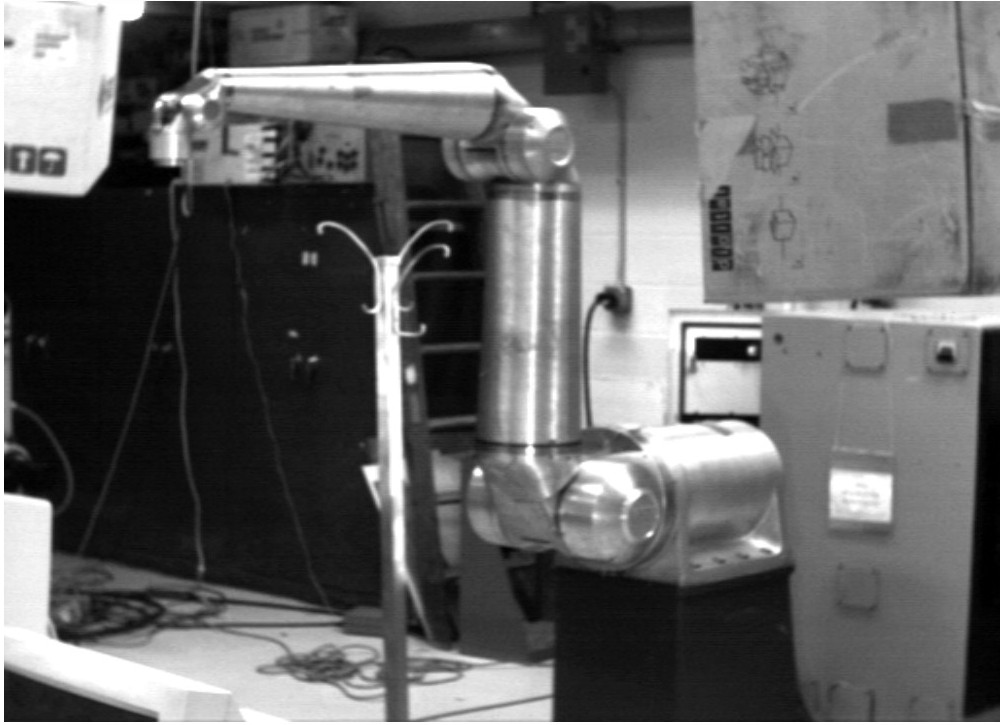
I used mostly the seven joint Robotics Research Corporation Robot for my robotics research. The robot was able to detect and avoid colliding with the objects surrounding it. I used echolocation for object detection.
The potential harm of AI is a related and important topic that I did not address. I don’t know much about this topic. However, Grant from “Grant at Tame Your Book” have written an excellent, well research and professional post about this issue called Don’t Confuse AI with a Benign Tool. Please check it out.