There is a lot of Uranium in your Backyard

Super fact 49 : The top one-meter (3.3 feet) of a typical 10 meters (33 feet) by 40 meters (131 feet) garden contains 2 kilograms (4.4 pounds) of Uranium. For comparison, the Hiroshima bomb contained 64 kilograms (121 pounds) of Uranium. Certain rocks such as Granite and Shale contain much more Uranium than soil. Uranium also exists in the atmosphere and there is 4.5 billion tons of Uranium in the ocean.

The numbers above come from the IAEA (International Atomic Energy Agency) and Stanford University . I should mention that the numbers vary depending on Geography, type of soil, etc. For example, there is much less Uranium in the soil in Florida compared to the soil in the Midwest.

This may come as a surprise to many people. Isn’t Uranium radioactive? How come we are still alive? That’s why I call this a super fact. The answer is that even though Uranium is used in nuclear bombs and nuclear reactors, it is by itself not very radioactive. You can hold natural uranium in your hand without much risk. The radioactivity from, for example, nuclear explosions come mainly from the fission process and the radioactivity from nuclear reactor waste is mainly from other isotopes created by the fission process in the reactor rather than the uranium itself.

An enormous nuclear bomb explosion in the dessert featuring a huge mushroom cloud | There is a lot of Uranium in your Backyard
If Uranium is not very radioactive, how come a nuclear bomb spread so much radioactivity. The answer is that the radioactivity comes from the fission process and the resulting new isotopes, not the uranium.

What Are Isotopes?

Before I explain some facts about the radioactivity and decay rate of Uranium, I should explain what an isotope is. Atoms consist of a nucleus and electrons surrounding the nucleus. In the nucleus there are protons and neutrons (and some other stuff). Neutral atoms have an equal amount of electrons and protons, which determines what kind of element it is. Hydrogen has one electron and one proton. Helium has two electrons and two protons. Oxygen has eight electrons and eight protons, etc. The number of protons/electrons is called the atomic number of the element.

The number of protons plus the number of neutrons is called the mass number. Atoms of the same element but different number of neutrons are called isotopes. Uranium-235 or U-235 has 92 protons and 235 – 92 = 143 neutrons. The number if protons/electrons determine the chemical properties of the element. The number of neutrons determines nuclear properties such as the stability of the nucleus, radioactivity, etc., as well as the weight. Therefore U-238 and U-235 are identical chemically and look and feel the same, but U-235 is more radioactive, and you can use U-235 for fission but not U-238.

Bohr model representation of the uranium atom, number 92 and symbol U. Conceptual vector illustration of uranium-238 isotope atom, mass number 238 and electron configuration 2, 8, 18, 32, 21, 9, 2
This is a simplified Bohr model of the Uranium atom. There are 92 little blue balls circling a nucleus in the middle of the atom. Those are electrons. In the nucleus there are 92 protons. Those are the red balls with plus signs. In addition, there is a yellowish smudge around the protons in the nucleus. Those are the neutrons. Depending on the isotope, there are 143 neutrons for U-235, 146 neutrons for U-238 and 142 neutrons for U-234. Shutterstock asset id: 1999370450 by Patricia F. Carvalho

The decay rate of Uranium

There are three main Uranium isotopes. Uranium-234, Uranium-235, and Uranium-238. Uranium-238 is the most common. 99.28% of natural Uranium is Uranium-238, 0.72% is Uranium-235 and 0.0057% is Uranium-234. Uranium-235 is the isotope we use for nuclear weapons.

The different isotopes have different decay rates and different levels of radioactivity. The half life of a radioactive isotope is the time it takes for an isotope to decay so that only half of it is left. The half-life of Uranium-238 is four and half billion years. That means that it will be around for a very long time, but since its decay rate is so slow, it is not very radioactive. The half-life of Uranium-235 is 710 million years, again it will be around for a very long time, but again, since its decay rate is so slow, it is not very radioactive. The half-life Uranium-234 is 247,000 years, a little bit faster but it still has a pretty slow decay rate.

This should be compared to Cesium-137, which has a half-life of roughly 30 years. In other words, it decays 150 million times faster than Uranium-238 and 23.7 million times faster than Uranium-235. Since Cesium-137 decays so much faster than the Uranium isotopes it means that each atom of Cesium-137 will send out radioactive particles much more often than a Uranium atom will, making it much more radioactive.

If you want to read about when I was walking around a whole day with a Cesium-137 sample in the back pocket of my jeans, click here. Radon-222, an extremely radioactive isotope of radon, which seeps into our basements from the inside of earth. It has a half-life of 3.82 days giving it a decay rate that is 430 billion times faster than Uranium-238 and 68 billion times faster than Uranium-235.

What makes it possible to make a nuclear bomb from Uranium-235 is not because it is very radioactive. It is not. It is because it has properties that make it perfect for bomb making. Each nucleus emits more than one neutron, in fact more than two on average, and the neutrons colliding with other Uranium-235 nucleuses can be made to travel at the correct speed to cause fission. In other words, it is fissile. It is a goldilocks situation. It is just right. Below is an illustration showing a chain reaction. Observe, the picture indicates that Uranium has 95 protons. This is wrong. Uranium has 92 protons. When I have the time, I will fix this picture.

Illustration of nuclear chain reaction. Uranium-235 fission | There is a lot of Uranium in your Backyard
This is an illustration of a chain reaction with fission of a Uranium-235 isotope. Notice the atomic number (number of protons) is incorrectly stated as 95 in the picture. It is 92.  When I have time, I will fix that. Shutterstock Asset id: 73714504 by Mpanchenko.

Other Nuclear Related Posts


To see the other Super Facts click here

We Exploded Thousands of Nuclear Bombs

Super fact 48 : Since 1945 we have set off more than 2,000 Nuclear Bombs corresponding to a yield of an estimated 42,000 times that of the Hiroshima Bomb.

According to the Arms Control Association there’s been 2,056 nuclear bomb tests. According to the UN there’s been more than 2,000 nuclear bomb tests, and according to Wikipedia there’s been 2,121 nuclear bomb tests, totaling 635 Megaton. Using the typical yield estimate for the Hiroshima bomb of 15 Kiloton that corresponds to more than 42,000 Hiroshima bombs. I think most of us know about the Hiroshima and Nagasaki bombs and we know about nuclear testing. However, I think the number of tests and the large total yield will come as a surprise to many, at least it was a surprise to me. That is why I consider this a super fact.

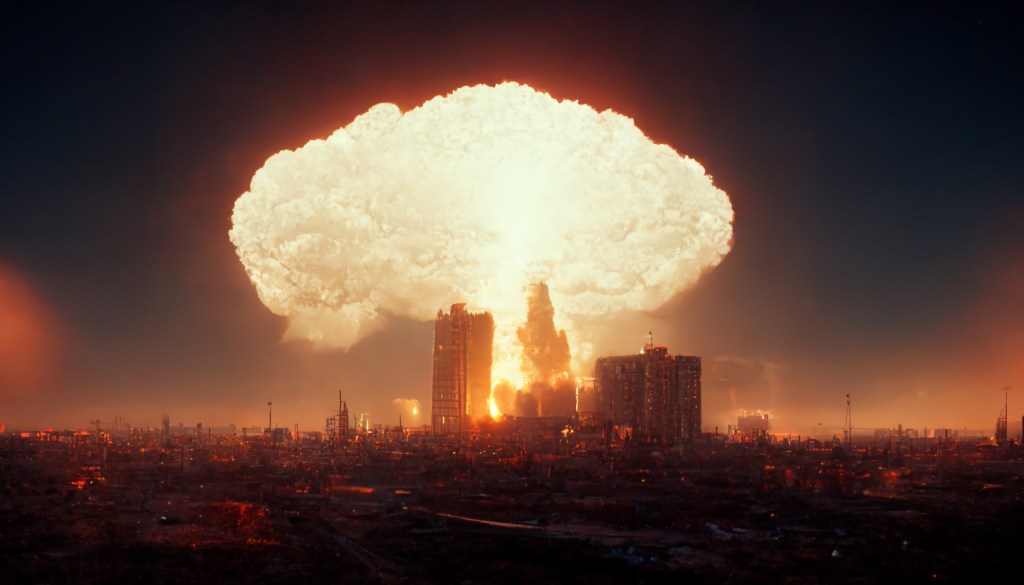
Atomic bomb explosion in a city - nuclear attack on a crowded city – 3D rendering of a mushroom cloud encompassing a city with skyscrapers | We Exploded Thousands of Nuclear Bombs
Nuclear bomb dropped on a big city. Shutterstock, asset id: 2188083835 by CI Photos.

Nuclear Landscaping

It may also come as a surprise that many of these tests were not for military purposes. Another usage for nuclear bombs is nuclear landscaping. Towards the end of the 1950’s the existing Panama Canal was thought to be insufficiently large and some people, including Edward Teller, the father of the Hydrogen bomb (Thermonuclear bomb), suggested that a new wider and deeper canal could be built simply by using nuclear bombs to blow multiple huge holes across Panama. The US was also interested in creating a new harbor in Alaska using nuclear bombs.

Thus, Project Plowshare was created to achieve this. As part of the Project Plowshare 35 nuclear warheads were detonated. The Soviet Union also had a similar program named “Nuclear Explosions for the National Economy” that included 124 nuclear bomb tests. Due to concerns over radioactive fallout the nuclear landscaping projects were eventually put to rest. The last Plowshare detonation was on May 17, 1973. The book Atomic Awakening by James Mahaffey recounts the history of nuclear testing and nuclear landscaping in greater detail.

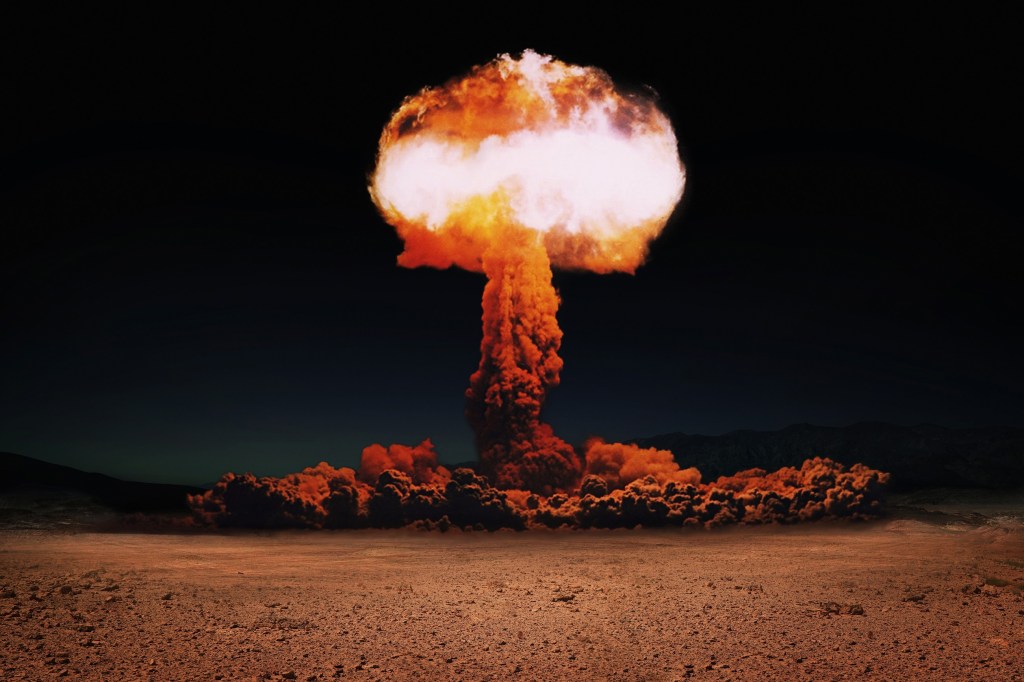
An enormous nuclear bomb explosion in the dessert featuring a huge mushroom cloud.
Hydrogen bomb test by Alones Shutterstock Asset id: 2194195335.

Project Orion

Another non-military use of nuclear bomb testing was Project Orion. Project Orion was a study conducted from 1956 to 1964 by the US Air Force, NASA, and DARPA into the viability of a nuclear pulse spaceship that would be directly propelled by a series of atomic explosions behind the craft. A thick steel pusher plate would catch the blast and accelerate the ship forward.

The “Pascal B” shot in Operation Plumb Bob in 1957 was the first nuclear weapons test of the pusher concept. The Limited Test Ban Treaty of 1963 made it difficult to continue with the project. According to the book Atomic Awakening, if the design had been successfully completed, we could have created an interstellar spaceship that could have taken a crew and a large load to other planets and stars.

I can add that According to Atomic Awakening, in addition to Nuclear Landscaping and Project Orion, Nuclear Blasts were a tourist attraction.

Number of Nuclear Tests by Country

Below is a list of countries and the number of nuclear tests that they’ve performed according to the Arms Control Association and Wikipedia.

  • The United States – 1,030 – According to Wikipedia – 1,032
  • The USSR/Russia – 715 – According to Wikipedia – 727
  • France – 210 – According to Wikipedia – 215
  • United Kingdom – 45 – According to Wikipedia – 88
  • China – 45 – According to Wikipedia – 47
  • North Korea – 6 – According to Wikipedia – 6
  • India – 3 – According to Wikipedia – 3
  • Pakistan – 2- According to Wikipedia – 2

However, it should be noted that partially due to nuclear arms control legislation such as; the Limited Test Ban Treaty (LTBT): Signed in 1963,  the Threshold Test Ban Treaty (TTBT): Signed in 1974, and the Comprehensive Nuclear-Test-Ban Treaty (CTBT) opened for signing in 1996, the number of nuclear tests have been significantly reduced. This is illustrated by the graph below from Our World in Data. The last nuclear test was done by North Korea in 2017.

The histogram graph shows how many nuclear tests took place each year since 1945. The different countries, the portion by each country, the US, USSR/Russia, France, United Kingdom, China, North Korean, India, and Pakistan are colored differently. The histogram shows the 1961 was the year when most nuclear tests took place. The vast majority of the tests took place between 1950 and 1990 | We Exploded Thousands of Nuclear Bombs
Data Source: Arms Control Association (2024). OurWorldInData.org/nuclear weapons.

Tsar Bomba

The biggest nuclear bomb ever exploded was RDS-220, or AN602, or Tsar Bomba. It was detonated by the Soviet Union on October 30th, 1961, on the arctic island of Novaya Zemlya, and yielded more than 50 Megaton. In other words, it was 3,300 times more powerful than the Hiroshima bomb. According to Atomic Awakening, windows in Finland 1,900 kilometers (1,180 miles) away shattered. There are no cities large enough to match the size of the explosion. This is the kind of bomb that could obliterate states or small countries.

Tsar Bomba was a so-called thermonuclear device, or a hydrogen bomb as they are typically called. Hydrogen bombs are much more powerful than fission bombs, such as Uranium bombs or Plutonium bombs. To read my related post called “Ukraine Gave up Thousands of Nuclear Warheads” click here.

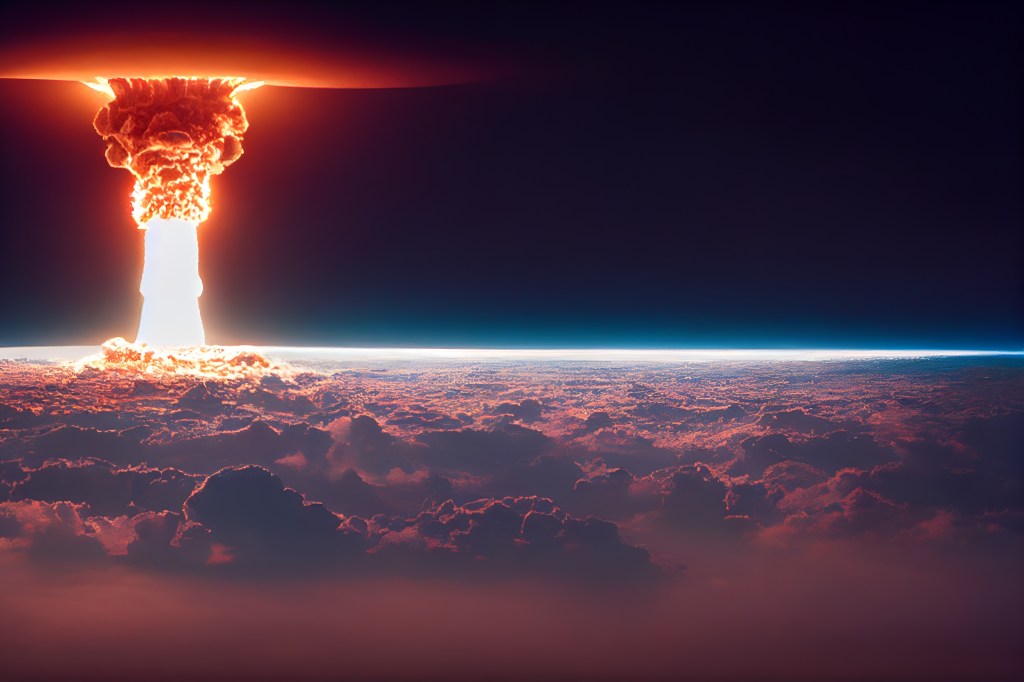
Russian Tsar Bomba mushroom cloud rising high above the clouds. High quality photo realist ( 3d make ) | We Exploded Thousands of Nuclear Bombs
This is an illustration of the Tsar Bomba explosion by by mbafai Shutterstock Asset id: 2208486661. To see a photo of the actual Tsar Bomba explosion click here (it is copyrighted).

Would you pay to watch a Nuclear Bomb Test? (Nuclear Bomb Test Tourism)


To see the other Super Facts click here

Ukraine Gave up Thousands of Nuclear Warheads

Super fact 47 : In 1991, after the dissolution of the Soviet Union, Ukraine became the third largest nuclear power in the world after Russia and the United States. Ukraine held about one third of the former Soviet nuclear weapons and delivery systems. Ukraine agreed to transfer these weapons to Russia for dismantlement in exchange for economic compensation and assurances to respect Ukrainian independence and borders.

After the dissolution of the Soviet Union in 1991, Ukraine inherited an estimated 1,700 to 1,900 strategic nuclear warheads, 130 UR-100N intercontinental ballistic missiles (ICBM) with six warheads each, 46 RT-23 Molodets ICBMs with ten warheads apiece, and an estimated 2,650-4,200 tactical nuclear weapons. It should be noted that these nuclear warheads were not under Ukrainian control.

In 1994, Ukraine agreed to transfer these weapons to Russia for dismantlement in exchange for economic compensation and assurances from Russia, the United States and the United Kingdom to respect Ukrainian independence and sovereignty within its existing borders. These political agreements are referred to as the Budapest Memorandum.

These events are relevant to what is happening in Ukraine today, and yet it is seldom discussed, and many people are unaware of or have forgotten about this history. It also comes as a surprise to many that there are nuclear states who have relinquished their nuclear weapons. This is why I call this fact a super fact.

Atomic bomb explosion in a city - nuclear attack on a crowded city – 3D rendering of a mushroom cloud encompassing a city with skyscrapers.
Nuclear bomb dropped on a big city. Shutterstock, asset id: 2188083835 by CI Photos.

Nine Nuclear States

There are nine nuclear states in the world as of 2025 according to the Federation of Atomic Scientists. There are 12,331 nuclear warheads including 9,600 in active military stockpiles.

  • Russia – 5,449 warheads
  • The United States – 5,277 warheads
  • China – 600 warheads
  • France – 290 warheads
  • United Kingdom – 225 warheads
  • India – 180 warheads
  • Pakistan – 170 warheads
  • Israel – 90 warheads
  • North Korea – 50 warheads

There are also countries that are hosting nuclear warheads owned by other countries.

  • Italy (the United States) – 35 warheads
  • Turkey (the United States) – 20 warheads
  • Belgium (the United States) – 15 warheads
  • Germany (the United States) – 15 warheads
  • Netherlands (the United States) – 15 warheads
  • Belarus (Russia) – ? warheads
Nuclear bomb, chemical weapons, missile defense, a system of salvo fire.
Four missiles aimed at the sky at sunset.  Shutterstock, asset id: 2131803989 by Hamara

Four nations that relinquished their nuclear weapons programs

The four nations that relinquished their nuclear weapons programs are Belarus, Kazakhstan, South Africa, and Ukraine. Belarus, Kazakhstan, and Ukraine returned their inherited nuclear weapons to Russia after the dissolution of the Soviet Union. However, it should be noted that in 2023 Russia began deploying tactical nuclear weapons to Belarus. However, Belarus does not currently possess its own nuclear weapons. South Africa voluntarily dismantled its nuclear weapons program in 1991.

In 2023 Russia began deploying tactical nuclear weapons to Belarus.
Russia and Ukraine as well as the borders of Russia and Ukraine are colored and look different from other countries.
Russia (green) and Ukraine (brown) map on a world map. Ukraine is about the size of Texas. Russia is about twice the area of the United States. Belarus is the country located immediately to the north of Ukraine and Kazakhstan is the big country immediately to the south of Russia and east of Ukraine. Shutterstock Asset id: 2121271067 by buraktumler

How to Build a Nuclear Bomb

This section is just some extra reading that is only somewhat related to the topic. However, since it is an interesting topic somewhat related to the topic I might as well explain how to build a nuclear bomb. Don’t worry I will not present any engineering details, only general principals, which is all I know, and which are already all over internet. Besides if I were to give detailed engineering instructions some peacenik hippie might have a hissing fit and swear in the comment section (that was a joke).

Anyway, the main idea behind a nuclear fission bomb is to achieve a runaway chain reaction. A fusion bomb, or a so-called hydrogen bomb is different. To create a fission bomb you are not looking for the most radioactive materials there are. You are looking for a fuel which you can use to create a runaway chain reaction, and which is also stable enough to make a bomb possible, in other words not too radioactive. Basically, the fuel must be just right. The primary fuels used in fission bombs are uranium-235 and plutonium-239. These isotopes undergo fission when struck by neutrons, releasing a massive amount of energy in a chain reaction.

The image shows a Uranium atom on the left arrows in the middle and an alpha particle, a gamma ray, a proton, a neutron, and an electron on the right | Ukraine Gave up Thousands Nuclear Warheads
Uranium-235 and Uranium-238 are both not very radioactive and can be used for radiometric dating that stretches millions and billions of years. Uranium-235 is also the “just-right” uranium isotope that can be used for bomb making. Shutterstock Vector ID: 2417370135 by grayjay

I should explain, isotopes are different forms of an element. For example, hydrogen comes in three different forms, a nucleus with just a proton, a nucleus with one proton and one neutron (deuterium), and a nucleus with one proton and two neutrons (tritium). Isotopes for the same element are chemically identical but have different atomic weight and they may or may not be radioactive.

The three isotopes of Uranium are uranium-234, uranium-235, and uranium-238. The one we need is uranium-235, which has 92 protons and 143 neutrons in the nucleus. The isotopes of Plutonium include Pu-238, Pu-239, Pu-240, Pu-241, and Pu-242 but there are others. The one we need is plutonium-239, which has 94 protons and 145 neutrons in the nucleus. There are more than 3,500 known isotopes of which 3,000 are radioactive.

During Uranium-235 fission, an average of 2.5 neutrons are released. Specifically, the fission of U-235 typically releases 2 or 3 neutrons, with the average being close to 2.5. During the fission of plutonium-239, an average of 2.9 neutrons are released (depending on the energy of the incident neutron). The important thing for bomb making is that one atom/nucleus releases enough neutrons so that the neutrons from one nucleus cause more than one fission. For example, a nucleus releases three neutrons and two of those neutrons cause two more fission events, which in turn cause four fission events, etc. 2, 4, 8, 16, 32, 64, a trillion…

From left to right : a neutron strikes a uranium nucleus, and it breaks apart into a Krypton and Barium isotope and release three neutrons, which strike three uranium nucleuses, causing three fission events and releasing nine neutrons in total, etc | Ukraine Gave up Thousands Nuclear Warheads
Illustration of nuclear chain reaction. Uranium-235 fission. Unfortunately, the picture has an error in it. It is 92 protons not 95 in a U-235 isotope. – Shutterstock asset id: 73714504 by Mpanchenko.

By putting together enough U-235 you can make it so that one fission event will result in more than one additional fission event. This is called the critical mass. The critical mass for U-235 is 47 kilograms (104 pounds). Theoretically, you can achieve this by taking a 24-kilogram half sphere of U-235 in your right hand and a 24-kilogram half sphere of U-235 in your left hand and bring them together. You will achieve a limited chain reaction for a nano second, but you will just blow the two halves apart and kill yourself, but your city will survive. This is called a fizzle. To make most of the 48-kilogram mass undergo fission you have to force them together long enough for the chain reaction to complete (or almost complete). This requires force and precise calculations. See the illustration below.

A piece of arrow shaped uranium-235 is shot from the left to the right to collide with a larger half-sphere-shaped uranium-235 core thus achieving critical mass forcefully and quickly | Ukraine Gave up Thousands Nuclear Warheads
Components Inside of Uranium Nuclear Fission Bomb illustration – Shutterstock asset id: 2271462995 by BlueRingMedia.

Another difficulty is obtaining nearly 100% U-235 from natural uranium. 99% of the Uranium you find in nature is U-238. U-235 and U-238 chemically identical so extracting U-235 from natural uranium is difficult. However, U-235 is slightly lighter than U-238 so you can use centrifugal separation as you do to separate cream from milk. What is typically done is using a uranium compound, uranium hexafluoride, heat it into gaseous form and then utilize centrifugal separation to extract the uranium hexafluoride with U-235 isotopes. After that you can chemically extract the uranium, which is now U-235.

To see the other Super Facts click here

There are many environmental success stories

Super fact 46 : There are many serious threats to the environment that we need to take seriously. However, there are also many environmental success stories that we tend to forget about.

It is important to remember the environmental success stories because if we forget about them, it breeds despair, which in turn discourages people from acting and doing the right thing. Denial and Despair are two seemingly opposite emotional reactions that both hinder action on problems. I consider the existence of the many important environmental success stories a super fact because even though it is undeniably true that there are many environmental success stories, some truly amazing, it comes as a surprise to many.

Below I am listing six environmental success stories that I previously chose to be super facts. Super facts are important and true facts that are surprising and perhaps even shocking to many, or widely misunderstood, or disputed amongst the public, but not seriously disputed amongst the experts/scientists. Super facts are facts that are very special and that I think we should be aware of these facts. I should add that this is just a sample of environmental success stories. There are many more.

Super Fact 29:

EV Cars Indeed Emit Less Carbon Pollution

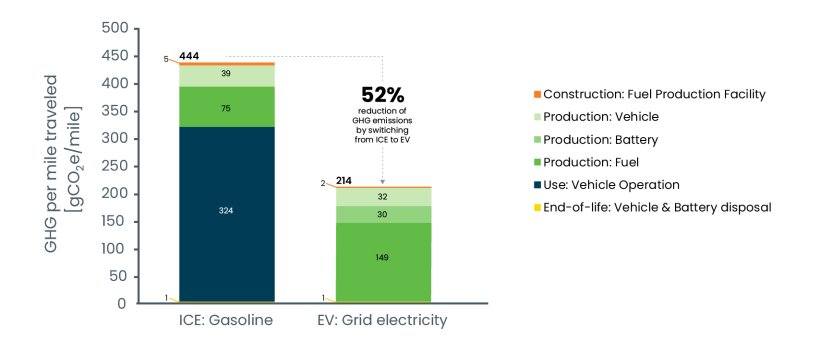
EV Cars emit less pollution than Internal Combustion Engine Cars, even considering manufacturing, disposal and many EV Cars being charged by dirty grids. The basic reason for this is the much higher efficiency of EV cars. EV cars emit significantly less greenhouse gases than internal combustion engines even considering construction of fuel production facilities, production of the car, the battery, and the fuel, vehicle operation and disposal. For more information click here.

The histogram graph shows that if you consider construction of facilities, manufacturing of vehicle and battery, production of fuel, vehicle operation as well as disposal the total average greenhouse gas emissions from EV cars is 52% less | There are many environmental success stories
Lifecycle greenhouse gas emissions comparison of average gasoline car and average EV. This graph is taken from the US Department of Energy.

Super Fact 35:

Natural Disasters Kill Less People Now Than 100 Years Ago

Natural disasters kill a lot less people now compared to 100 years ago. That is despite a larger population and despite the fact that climate change has increased the frequency and intensity of many types of natural disasters. Surveys by Gap Minder show that this fact is quite surprising to people and therefore it is a super fact. To read more about this super fact click here.

The reason for the fewer deaths from natural disasters is not that there are fewer natural disasters. It is because we are now much better at predicting, handling and recovering from natural disasters. Our warnings systems, rescue systems and healthcare have improved significantly. The graph below from Gap Minder illustrates the decline in deaths from natural disasters.

The graph shows 300 to 400 thousand annual deaths at the beginning of the 20th century, then 971 thousand annual deaths in the 1930’s, then it continuously gets lower until the annual deaths in the 2010 to 2016 period is 72 thousand deaths per year.
This graph from the Gap Minder article shows the annual deaths from natural disasters.

Super Fact 41:

Emissions of ozone-depleting gases have fallen by 99 Percent

Largely thanks to the Montreal Protocol in 1987 the emissions of ozone-depleting gases have fallen by more than 99%, 99.7% to be exact, according to Our World in Data. This has resulted in the halt of the expansion of the ozone holes. The reduction in emissions of  ozone-depleting gases is saving millions of lives every year. To read more about this astounding success click here.

The NIH estimate that the Montreal Protocol has prevented 443 million cases of skin cancer worldwide, 2.3 million skin cancer deaths, and 63 million cases of cataracts in the United States alone. Globally, it is estimated that the Protocol has saved an estimated 2 million people from dying from skin cancer each year. The graph below is taken from Our World in Data.

Gases visualized in the diagram are CFCs, Halons, HCFCs, Carbon Tetrachloride, Methyl Bromide, Methyl Chloroform. The diagram shows a peak around the end of 1980’s | There are many environmental success stories
The phase out of six ozone depleting gases. Data source UN Environment Program (2023).

Super Fact 42:

Developed nations have successfully reduced carbon emissions

The developed nations (rich countries) have reduced their carbon emissions since the 1990’s despite continued GDP growth, even if we take offshore production into account. In addition, many developing countries have succeeded in reducing their emissions as well. Other fast-growing developing countries have flattened or at least slowed their increase in carbon emissions. Many countries have decoupled economic growth from CO2 emissions.

In other words, we do not need to increase carbon emissions or burn more fossil fuels to grow the economy. To read more about this promising development click here.

The graph shows three plotted graphs, a dark blue one showing GDP per capita, a light blue one showing UK carbon emissions per capita and a red one showing trade adjusted carbon emissions per capita. The GDP graph is increasing by more than 50% over 33 years and the CO2 emissions per capita graph is decreasing by almost 60% and the trade adjusted carbon emissions decline by almost 40%.
Data source: Data compiled from multiple sources by World Bank (2025); Global Carbon Budget (2024); Population based on various sources (2024). Note: GDP per capita is expressed in international dollars at 2021 prices. Graph taken from Our World in Data.

Super Fact 44:

Sulfur dioxide pollution has fallen by 95 percent in the US

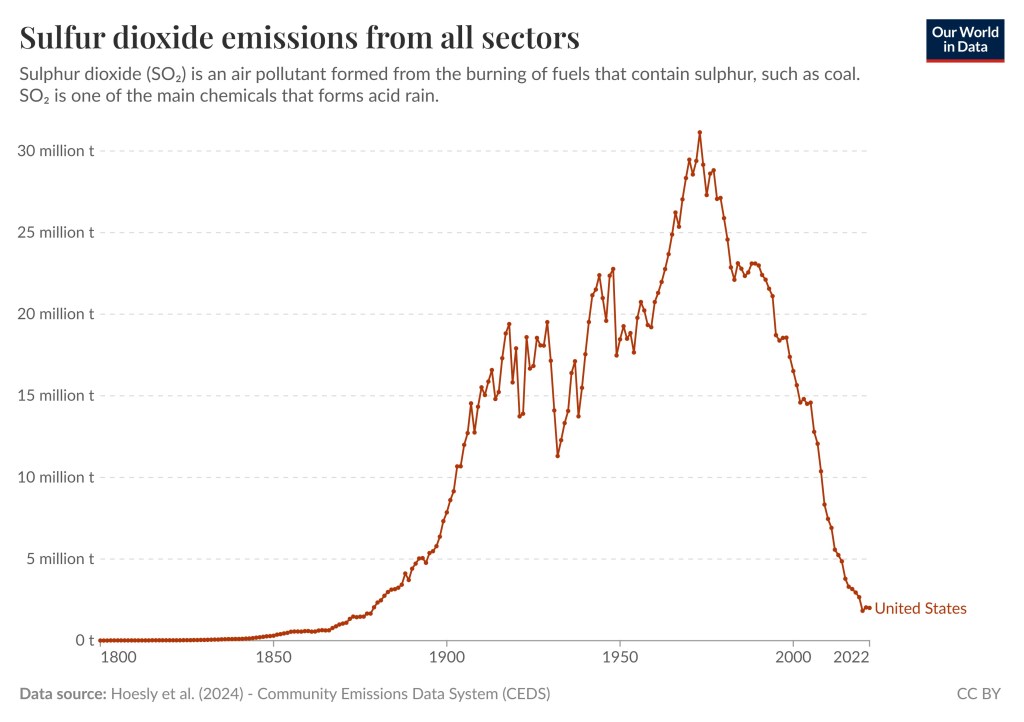
Sulfur dioxide pollution has fallen by approximately 95 percent in the US since the 1970s. This significant reduction is primarily due to regulations like the Clean Air Act. Global sulfur dioxide pollution has also fallen but not as much. To read more about this success story click here. If you visit the aforementioned link you will also see that there are many other pollutants that we have successfully curtailed.

The graph shows a steep increase towards the end of the 19th century with a peak in 1973, followed by a steep decline |There are many environmental success stories
US sulfur dioxide pollution since 1800. US Emissions peaked in 1973. Data Source: Hoesly et al (2024) – Community Emissions Data System (CEDS). This graph is taken from this page in Our World In Data.

Super Fact 45:

Deforestation has peaked

Deforestation peaked back in the 1980s, meaning that is when it was worst. Deforestation has not stopped but the rate of deforestation has slowed as a result of government policies, corporate initiatives, and international agreements.

Overall, we are still losing forests. We had a 47-million-hectare loss of forest in the last decade, which is very bad, but that is better than the 151-million-hectare loss of forest in the 1980s. For temperate forests we have succeeded in reversing deforestation, which means that temperate forests are now gaining forest. To read more about this topic and how government policies, corporate initiatives, and international agreements have slowed the rate of deforestation you can click here. This change in deforestation rate is illustrated by the graph below, which is taken from Our World in Data.

The graphs show that during the 1700’s and the first half of the 1800’s the loss of forests was 19 million acres per decade. From the mid-1800’s to 1920 it was roughly 30 million acres per decade and from the 1920 and on it was 115 million acres per decade until the 1980s and the first half of the 1990s when it was 151 million acres per decade. Since then, it has fallen and in the last decade forest loss was 47 million acres | There are many environmental success stories
Decadal losses in global forest over the last three centuries. Decadal forest loss is measured as the average net loss every ten years, in hectares. This deforestation minus increases in forest area through afforestation. There is no single dataset that applies consistent or transparent methodology for deforestation over centuries. Two different datasets are therefore shown: these still shown the overall development and transition of forestation from temperate to tropical areas, but magnitudes should not be combined at the crossover point. Data sources: Pre-1995 data from Williams (2006). The second series is based on data from UN FAO Global Forest Resources.

Note : I am going on a trip with family and will return next Tuesday (5/27). During this time will not do any blogging. I love comments but I will respond to comments when I come back.

To see the other Super Facts click here

Sulfur dioxide pollution has fallen by 95 percent in the US

Super fact 44 : Sulfur dioxide pollution has fallen by approximately 95 percent in the US since the 1970s. This significant reduction is primarily due to regulations like the Clean Air Act. Global sulfur dioxide pollution has also fallen but not as much.

Sulfur dioxide is a colorless gas with the formula SO2. It has a pungent smell, which you notice after using matches. It is released naturally by volcanic activity and is produced as a by-product of burning sulfur-bearing fossil fuels and from metals refining. Sulfur dioxide is somewhat toxic to humans and by reacting with water it creates acid rain, which is a serious environmental problem.

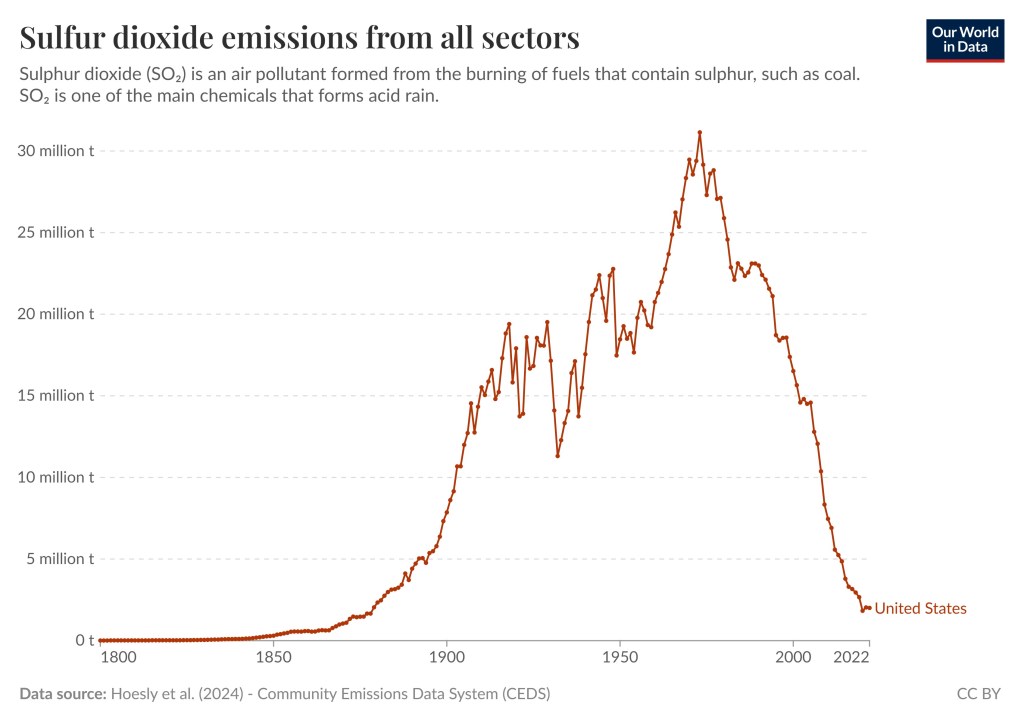
The good news is that the Clean Air Act has driven technological advancements and the adoption of cleaner practices in industries that produce sulfur dioxide emissions. This has resulted in a drop of sulfur dioxide pollution in the US by 95% according to EPA and Statista and 94% according to Our World In Data. Statista is a pay site, so I am not going to link to it. Below is a graph from Our World In Data showing the reduction in sulfur dioxide pollution in the US.

The graph shows a steep increase towards the end of the 19th century with a peak in 1973, followed by a steep decline | Sulfur dioxide pollution has fallen by 95 percent in the US
US sulfur dioxide pollution since 1800. Data Source: Hoesly et al (2024) – Community Emissions Data System (CEDS). This graph is taken this page in Our World In Data.<<Link-5>> US Emissions peaked in 1973.

I should mention that by clicking this link you can visit the graph above Our World in Data and select different countries and regions and play around with the settings.

Sulfur Dioxide Emissions Worldwide

The worldwide emissions peaked in 1979 and fell sharply after that even though the progress (reduction in sulfur dioxide emissions) has not been as spectacular as in the US. Worldwide reductions are around 48%. Again, by visiting the Our World In Data page you can play around with the graph and the settings and view different countries and regions. This is an additional source visualizing the data.

The graph shows a steep increase in sulfur dioxide emissions around 1950 with a peak in 1979, followed by a steep decline, but not as dramatic as for the US
Sulfur dioxide pollution worldwide since 1800. Data Source: Hoesly et al (2024) – Community Emissions Data System (CEDS). This graph is taken this page in Our World In Data. Worldwide Emissions peaked in 1979.
This graph shows the sulfur dioxide emissions for the world as well as for China and India. China follows the world wide emissions but on a smaller scale whilst India has steady increase in emissions that stabilized/peaked in 2023 | Sulfur dioxide pollution has fallen by 95 percent in the US
Sulfur dioxide pollution worldwide since 1800 with three major polluters included. The United States is in red, China in green and India in blue. The graph for India is the one corresponding to the least overall pollution but it has no reduction. Data Source: Hoesly et al (2024) – Community Emissions Data System (CEDS). This graph is taken this page in Our World In Data.

Good News with Respect to Pollution

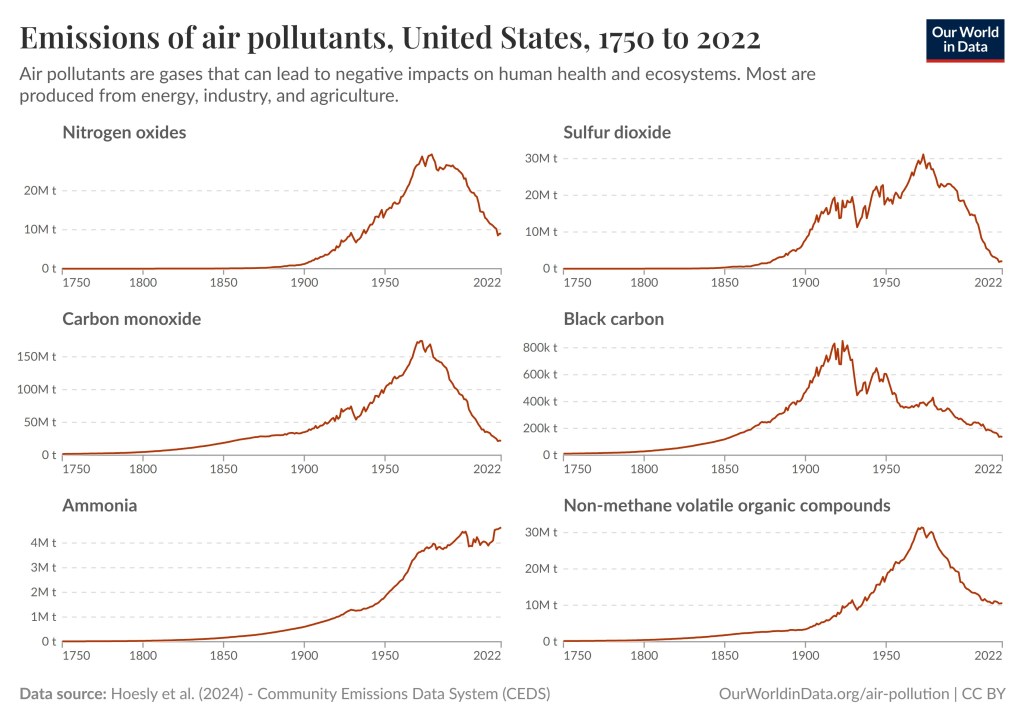
Sulfur dioxide emissions have gone down worldwide, which is good news. However, sulfur dioxide is not the only pollutant that we have succeeded in reducing. The graph below demonstrates that the US has also made great progress in reducing Nitrogen Oxides pollution, Carbon Monoxide, Black Carbon, and Non-methane volatile organic compounds. We have not been as successful with reducing Ammonia pollution.

However, according to Google AI sulfur dioxide, followed by Nitrogen Oxides pollution, Carbon Monoxide, and Black Carbon are the most serious pollutants. The graph below is taken from this page in Our World in Data.

The graphs for nitrogen oxide emissions, sulfur dioxide emissions , carbon monoxide and non-methane organic compounds pollution peak around 1970’s and then show a sharp downturn. The graph for black carbon peak around 1920 and then show a sharp downturn whereas the graph for ammonia does not peak. All graphs are in red.
US nitrogen oxide emissions, sulfur dioxide emissions, carbon monoxides, black carbon, ammonia and non-methane organic compounds pollution since 1750. Data Source: Hoesly et al (2024) – Community Emissions Data System (CEDS). This graph is taken from this page in Our World In Data.

The graphs for the world do not look as impressive. However, even in this case it looks like some progress has been made. Four graphs have peaked and are turning downwards, and one graph has flattened but unfortunately the graph for ammonia pollution is still heading upwards.

It should be noted that these pollutants are more or less local in the sense that they affect the polluting country and/or surrounding countries the most, whilst the climate change / global warming effect from carbon dioxide and other long lasting greenhouse gases tend to affect the entire planet.

The graphs for nitrogen oxide emissions, sulfur dioxide emissions , carbon monoxide peak around 1970’s and then show a small downturn. The graph for black carbon peak around 2020 and then shows a small downturn. The graph for non-methane organic compounds pollution flattened around 2020 whereas the graph for ammonia keeps growing. All graphs are in blue | Sulfur dioxide pollution has fallen by 95 percent in the US
Worldwide nitrogen oxides emissions, sulfur dioxide emissions, carbon monoxide emissions, black carbon, ammonia and non-methane organic compounds pollution since 1750. Data Source: Hoesly et al (2024) – Community Emissions Data System (CEDS). This graph is taken from this page in Our World In Data.

Aside from the success in reducing these pollutants there is more good news.


To see the other Super Facts click here