We are Star Dust

Superfact 10 : We Are Star Dust

The matter in our bodies and our planet was formed by fusion in the cores of distant stars and then spread across the Universe by supernova explosions. This matter was later incorporated in second and third generation stars like our sun and its planets.

What do I mean by “We are Star Dust”? Let me explain. The first stars in the Universe were made of 75% hydrogen and 25% helium and trace amounts of Lithium, just like the entire Universe at the time. There were no heavier elements that could form planets or other solid celestial bodies. These early stars tended to be large and heavier elements like carbon, oxygen, and iron were formed by fusion in the cores of these stars.

Many of the first stars, called first generation stars, ended their lives in massive supernova explosions and the dusty remains of these explosions, including the metals formed in their cores, became the building blocks of the stars we see today. These second and third generation stars have planets and other smaller solid objects orbiting them, formed from the gas and dust (star dust) left over from the supernova explosions. So, we are star dust. The atoms formed inside the first-generation stars are now within us.
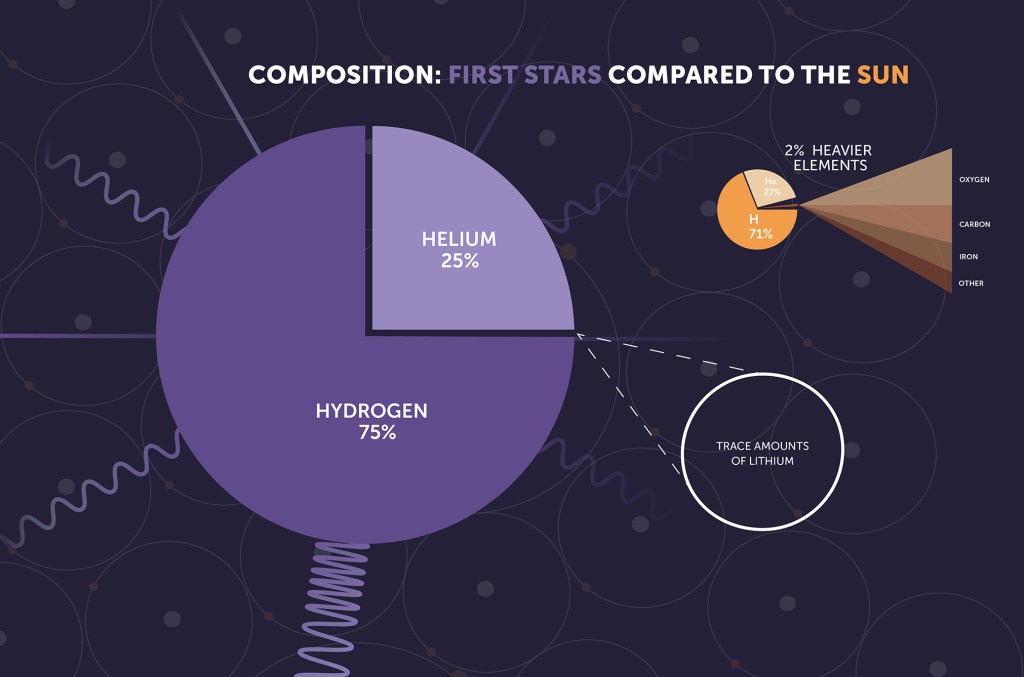
The picture consists of two pie chart graphs representing stars. The left one is a first-generation star with one pie for the 75% hydrogen and one pie for the 25% helium | We are Star Dust
The first-generation stars consisted of 75% hydrogen and 25% helium and trace amounts of Lithium. A second or third generation star like our sun is still mostly hydrogen and helium but also many other elements. The rocky planets circling the sun are mainly elements heavier than hydrogen and helium. Image credit NASA, ESA, CSA, STScI.
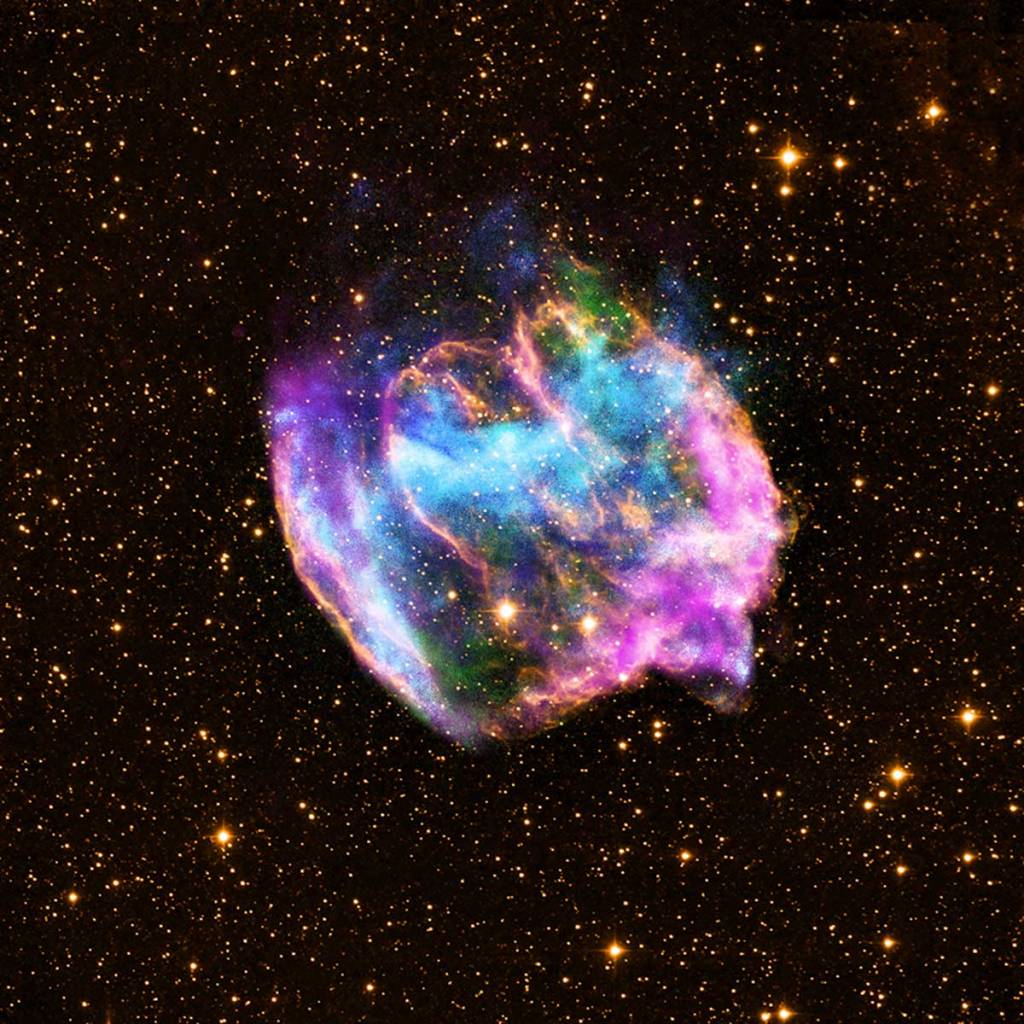
A colorful, nebula, a remnant from a supernova explosion on the background of a black sky full of stars.
Remnants of a recent supernova W49B, 26,000 light years away. Credit: X-ray: NASA/CXC/MIT/L.Lopez et al.; Infrared: Palomar; Radio: NSF/NRAO/VLA.

For those who know astronomy this may be basic information, but I’ve met many people who are unfamiliar with this information, and they are quite often surprised and astonished. That is why I consider this information a super fact. I can add that this process, the birth and death of first-generation stars, the supernova explosions, the disbursal of the matter, which later clump together to form new stars and rocky planets as well, takes many millions of years.
Bright white star surrounded by bluish rings | We are Star Dust
This is an Illustration of a supernova. Stock Vector ID: 2109918599 by Varunyuuu.

A Refresher

For those who need a refresher of things like stars and planets and galaxies. Our sun is a star, a third-generation star. It is much bigger than our Earth. If Earth is the size of a small pea or a caper, then the sun would be the size of a beach ball. However, our sun is not a big star, and it is only one star among between 100 and 400 billion stars in our galaxy the Milky Way.

Many galaxies including our own are disc shaped or look like spirals. If you imagine a dust storm cloud in which there are a thousand dust particles per cubic foot, each representing a star. Then this dust cloud would be 100 to 400 feet thick, and a thousand feet wide and long. I can add that there are between 100 billion to 2 trillion galaxies in the visible Universe. Also, the Universe is much bigger than the visible Universe and might be infinitely large.
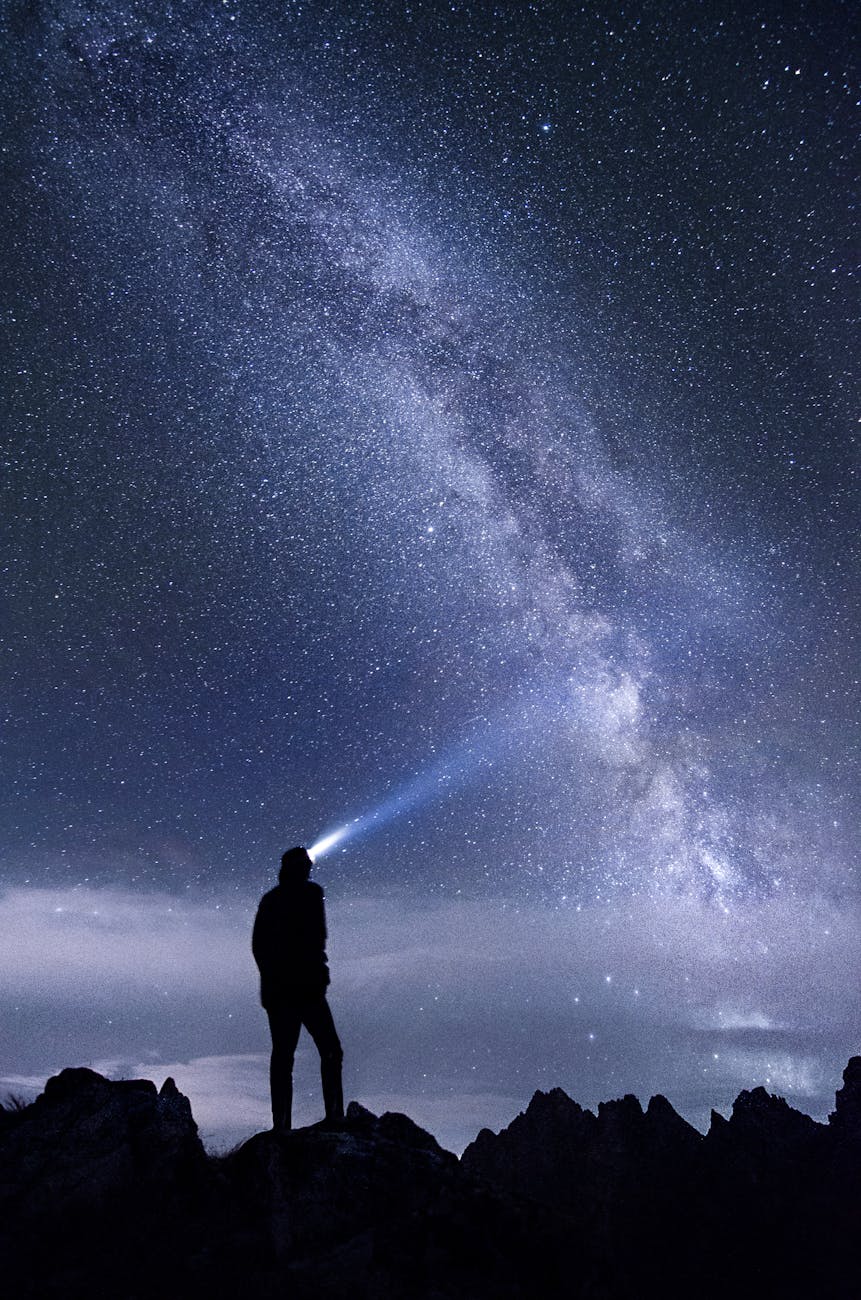
The milky way galaxy stretches across the night sky.
A glimpse of our milky way galaxy. Photo by Stefan Stefancik on Pexels.com

As mentioned, orbiting around our sun there are planets, dwarf planets, moons, planet rings, asteroids, comets, meteoroids, interplanetary dust, etc. The star closest to the sun is Proxima Centauri, which is 4.24 light-years away, but it is too small to be seen. The stars that are visible in the night sky tend to be large stars that are not too far away.

Here in Dallas where I live you can typically see 15 stars with the naked eye, and you cannot see the Milky Way. That’s because of the light pollution. In northern Sweden where I grew up you could see 3,000 stars, our galaxy the Milky Way, as well as the Andromeda Galaxy on a clear night with the naked eye.

In 1885 a supernova explosion was recorded in the Andromeda Galaxy. Below is a constructed photo showing how it might have looked like if we had had better equipment back then. Notice that the supernova explosion is essentially outshining the entire galaxy. We are the result of the gases and dust spread by such explosions. You can also read more here.
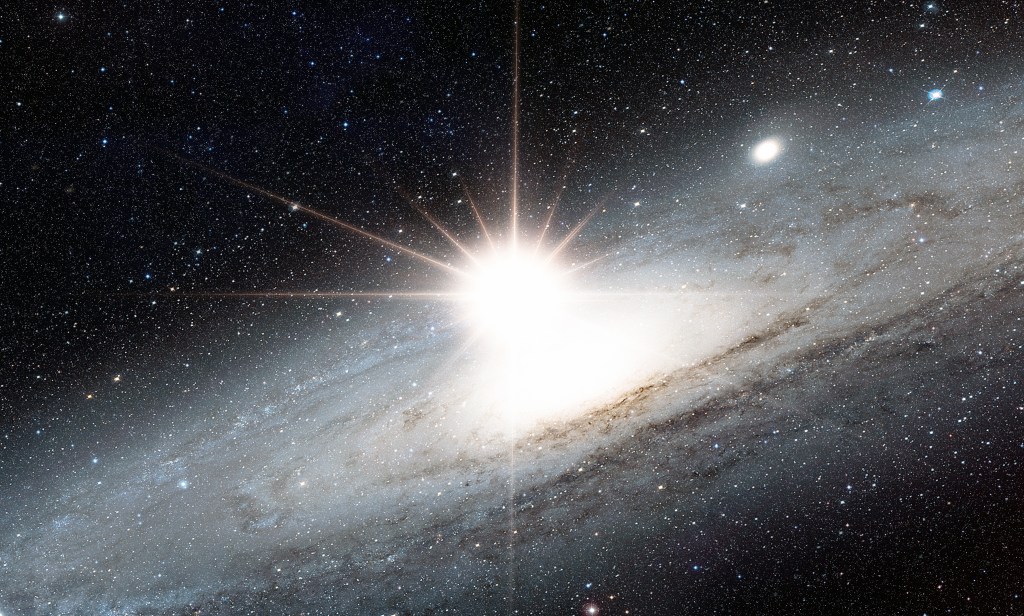
A picture of the Andromeda Galaxy with a bright white light near its center. The bright light is almost outshining the entire galaxy.
Supernova explosion in the center of the Andromeda galaxy “Elements of this image furnished by NASA” It is essentially an enhanced photo of a supernova explosion in a neighboring galaxy. Stock Photo ID: 2495486227 by muratart.

To see the other Super Facts click here


We are living in relatively peaceful times

Superfact 9 : We are living in relatively peaceful times

Despite all the wars going on, the world was filled with a lot more war and violence in the past. Despite the grim news reports we are living in relatively peaceful times.

If I asked you, what are the two biggest wars going on the world today (as of September 2024), you would probably say that it is the Russia / Ukraine war and the Israel / Gaza war. Well, unless you are really well informed, it would come as a surprise that there are more devastating wars going on in the world. For example, there is currently a big civil war going on in Sudan that began in April 2023.

According to the latest issue of the Economist perhaps 150,000 people have been slaughtered in this civil war, and 10 million people have fled their homes, and a famine is emerging that could kill 2.5 million people by the end of the year. This war is likely to destabilize neighboring countries and is sponsored by Russia and Middle Eastern states. It’s likely the biggest crisis in the world but most likely you’ve never heard of it.

Photo by Pixabay on Pexels.com

In the recent Tigray war in Ethiopia between 162,000 and 600,000 people were killed according to Wikipedia. The Tigray war is mostly over, but the point I am trying to make is that you probably have never heard of it. You cannot use the impressions given by the amount of media attention a conflict gets to decide on how severe it is. You’ve got to check the statistics and compare, and the statistics might be quite unintuitive if you have relied on media attention as a metric.

What was the most devastating war in the 19th century?

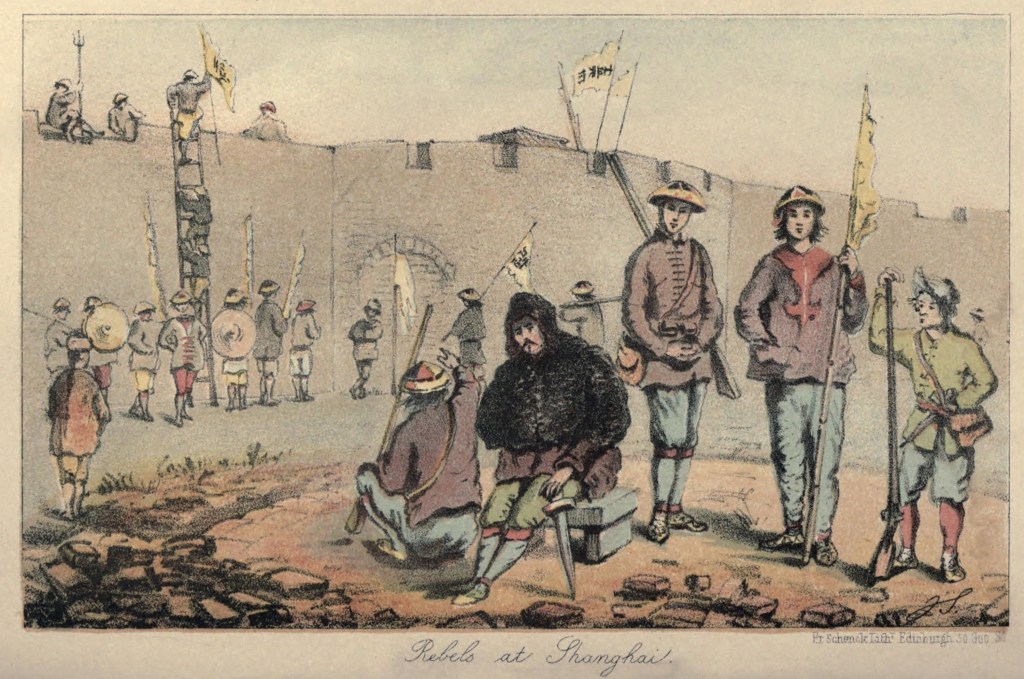
So, to the next question. What was the most devastating war in the 19th century? If you say the American civil war, you are not correct (estimated 650,000+ deaths). A somewhat better answer is the Napoleonic wars (and estimated 4 million deaths). But none of the answers are correct. The Taiping rebellion in China was the worst. Estimates of the conflict’s death toll range between 20 and 30 million people. Some estimates say 100 million, which would make it the most devastating war in human history.

But did you hear about it? Again, you’ve got to check the statistics, and not rely on your impressions. I am saying this because the claim that deaths from wars and violence have declined over the last few decades is a quite unintuitive claim and yet it is true. That’s why it is a super fact.

Illustration of Chinese warriors preparing outside a fortified city.
Taiping Rebels at Shanghai China in 1853-54. ‘Small Swords’ refers to daggers used by warriors or martial artists in close combat. 19th century print. Stock Illustration ID: 237232531 by Everett Collection.

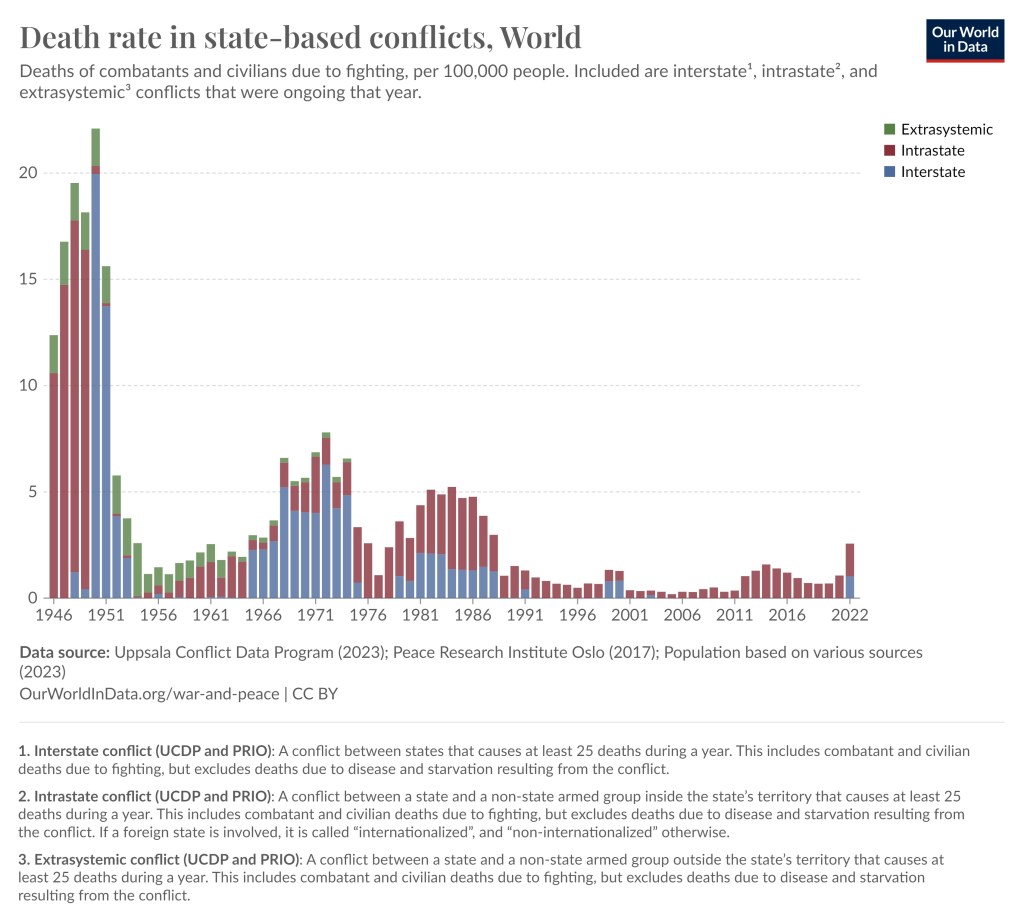
As this article in the Our World In Data states “While every war is a tragedy, the data suggests that fewer people died in conflicts in recent decades than in most of the 20th century. Countries have also built more peaceful relations between and within them.”. It should be noted that even though killing has never been as efficient as it is in the present, in the past a lot of civilians died from famine and disease resulting from the wars.

For example, the Spanish flu following World War I killed between 25 to 50 million people. I should say those numbers are typically not included in the deaths from World War I. The number of deaths from World War I are estimated at 20 million. 10 million combatants and 10 million civilians.

The graph is in histogram format with the biggest bins 1946 to 1952, then a couple of more upticks with smaller bins in more recent times.
Death rate from wars since 1946. The uptick in 2022 is largely due to the Ethiopian Tigray war with 162,000–600,000 killed and the invasion of Ukraine,  which US and BBC estimates at more than 200,000 deaths (but estimates from most other sources are less).

One problem with this kind of statistics is that the estimates vary, especially with respect to civilian causalities. In addition, very big wars lasting a few years create very bumpy graphs with large spikes making it harder to identify trends.

However, by listing estimated war deaths of the biggest wars, genocides and democides since the 1800’s you can see that deaths from this type of violence have overall been reduced over the last few decades. A note, democides are mass killings of civilians but are not necessarily directed at an ethnic group (democide include genocide).

The links below are mostly from Encyclopedia Britannica, but also from Wikipedia, the Census bureau, and a couple of other sources.

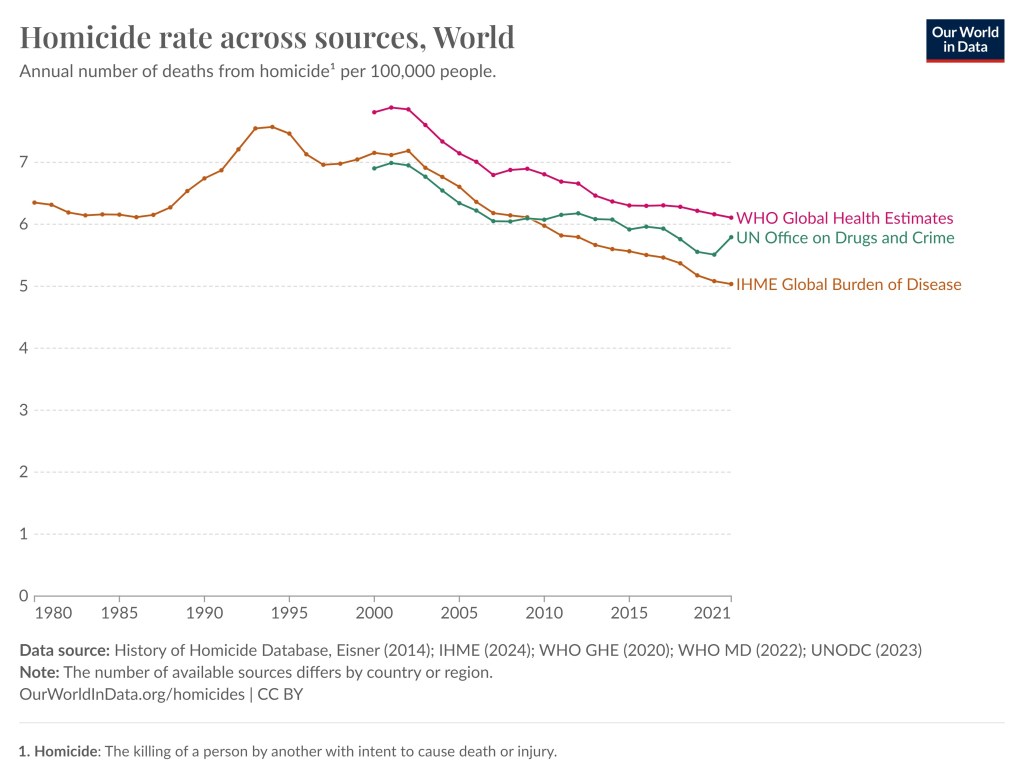
As I said, the numbers are estimates and not hard data, especially with respect to civilian casualties. However, you can see a trend going from several conflicts with numbers in the tens of millions before 1950, then numbers in millions until 2000/2007 and then during the last couple of decades the numbers have been less than a million. This does not cover homicide rates but even in that case we can see a reduction even though it is less distinct.

The graph features three curves (1) from WHO global health estimates (2) UN office on drugs and crime (3) IHME Global Burden of Disease.
In this graph we can see that homicide rate worldwide has been reduced somewhat since the mid 1990’s. This graph is also taken from the Our World in Data website and they in turn used various databases from UN, WHO, etc.

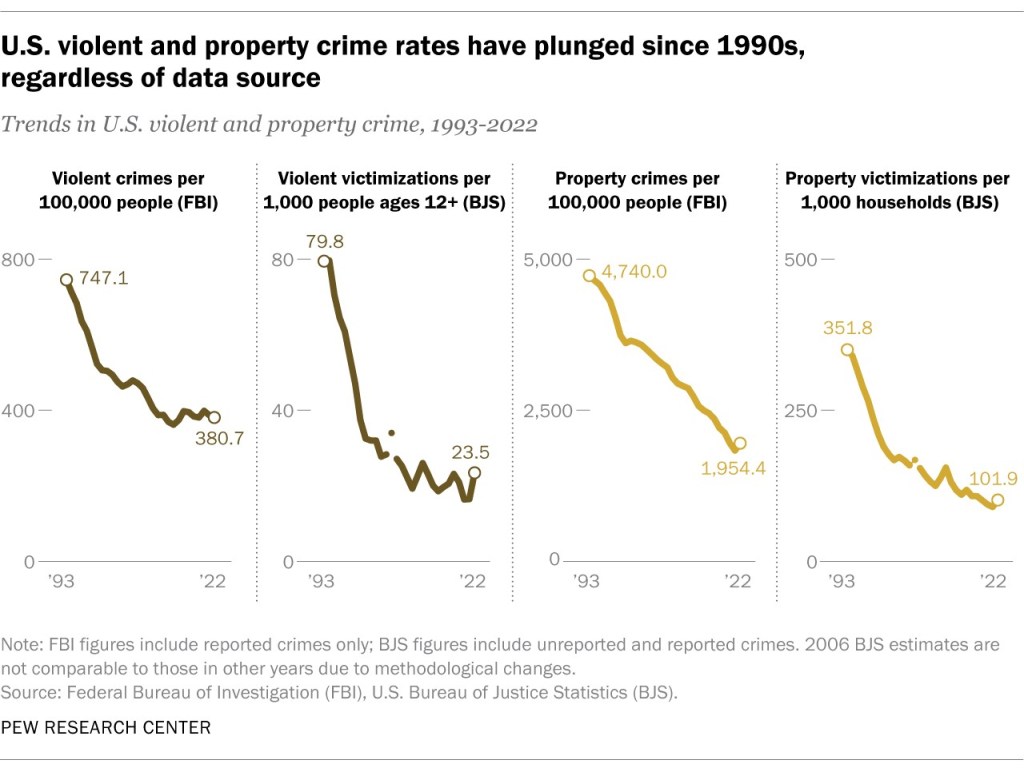
Finally, you can also take a look at this post “US Violent Crime Nearly Cut in Half Since 1990” and this article from pew research that includes a graph showing that the US violent crime rate has nearly halved since the 1990’s.

Also remember that in the past there were a lot less people on earth, so relatively speaking a million deaths was a lot bigger number back then. In summary, despite all the wars going on, our world is less violent than it used to be.


To see the other Super Facts click here


US Violent Crime Nearly Cut in Half Since 1990

Superfact 8 : US Violent Crime Nearly Cut in Half Since 1990

Despite all the news reports about rampant crime, the US violent crime rate has fallen to half of what it was in the early 1990’s.

I’ve known for a while that violent crime in the US has been going down substantially since 1990. However, quite often when I mention this people refuse to believe it. When I visit NextDoor, the hyperlocal social networking service for neighborhoods, I see people complaining about rising crime, and especially rising violent crime. The news media and the newspapers are filled with violent crime stories, murders, mass shootings, assaults, rape, and robberies. It seems to be getting worse and worse. We are living in scary times, aren’t we?

The Better Angels of our Nature

A couple of years ago I bought a book by Steven Pinker with the title The Better Angels of our Nature, why violence has declined, which contradicted the violence is getting worse narrative. In the book he claims that violence is trending down worldwide and that includes US violent crime.

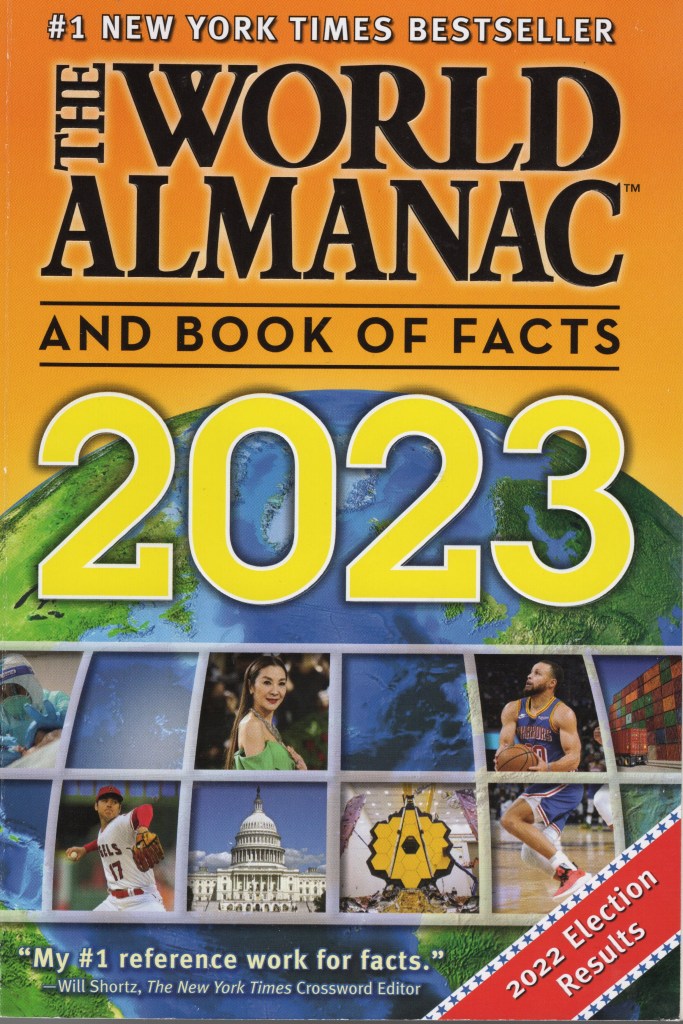
In 1987 I received a Christmas present from the parents of a fellow student whom I had been tutoring. I was an exchange student to the United States from Sweden at the time. The Christmas present in question was the World Almanac of 1987. I loved it and ever since I’ve bought the World Almanac every year. If you open the pages for crime statistics in the United States in the World Almanac you see the same thing, violent crime in the US is declining.

The colorful front page of The World Almanac and Book of Facts 2023. It features photographs of events in 2023 as well as a picture of the northern hemisphere of Earth.
The World Almanac and Book of Facts 2023.

Statistics

Below is what the World Almanac 2023 says about the violent crime rate per 100,000 residents in the United States (page 114). The data sources were : Federal Bureau of Investigation, U.S. Department of Justice, Uniform Crime Reporting Program, Crime in the United States 2020. I also included property crimes in the last column to show that non-violent crimes have declined as well.

YearAll violent crimeMurder and nonnegligent manslaughterRapeRobberyAggravated assaultAll property crime (non-violent)
1990729.69.441.1256.3422.95,073.1
1995684.58.237.1220.9418.34,590.5
2000506.55.532.0145.0324.03,618.3
2005469.05.631.8140.8290.83,431.5
2008458.65.429.8145.9277.53,214.6
2011387.14.727.0113.9241.52,905.4
2014361.64.426.6101.3229.22,574.1
2016386.65.430.0102.9248.32,451.6
2017383.85.330.798.6249.22,362.9
2018370.45.031.086.1248.22,209.8
2019368.65.131.481.8250.42,130.6
2020387.86.527.673.9279.71,958.2

The graph below is taken from this article from the Pew Research Center tells the same story. The graph. It shows that the US violent crime rate has nearly halved since the 1990’s. There is a slight uptick in crime for the years 2020 and 2021 but according to this PBS article the downward trend has continued in 2022 and 2023.

The first graph shows that violent crime per 100,000 people (FBI) has gone from 747.1 in 1990 to 380.7 in 2022. The next three graphs show the same trends | US Violent Crime Nearly Cut in Half Since 1990
The four graphs show that both violent crime and property crime has declined since 1990. Click on the picture to see the Pew Research article it is taken from.

Since this is a surprising fact that some does not even want to acknowledge (in my experience) I consider this a super fact.

Do you feel it is hard to believe that violent crime in the US has been declining over the last few decades?


To see the other Super Facts click here

Poverty and child mortality has been sharply reduced worldwide

Superfact 7 : Poverty and child mortality has been sharply reduced worldwide.

Extreme poverty as well as child mortality has been sharply reduced the world over. The countries that are the worst-off today are still better off than the countries that were doing the best at the beginning of the 19th century. Over the last 20 years extreme poverty and child mortality has continued to decline sharply.

In Hans Rosling’s book Factfulness, “Ten Reasons We’re are Wrong About the World – and Why Things Are Better Than You Think”, the author presented a quiz that he wanted the reader to take before reading the book. Below is the third question of the quiz. I should say that Hans Rosling posed this and other questions to thousands of people around the world.

In the last 20 years, the proportion of the World population living in extreme poverty has…

  • A. Almost doubled
  • B. Remained more or less the same
  • C. Almost halved

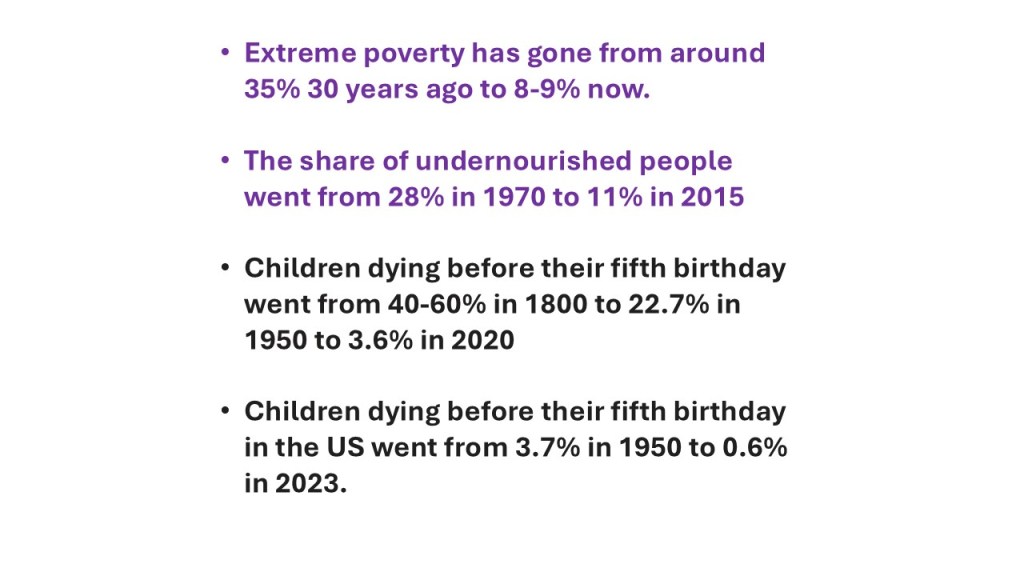
The correct answer is C. Almost halved. Around 7% of the quiz takers got the right answer. Around 5% in the United States got it right. That the proportion of the World population living in extreme poverty halved in 20 years is a true fact. This is also an important fact about the world. Despite that most people got it wrong. In fact, monkeys randomly picking answers would do better (33%). I did pretty well on this quiz, but since I was reading the book and the book’s title is “Ten Reasons We’re are Wrong About the World – and Why Things Are Better Than You Think”,  I got some help just looking at the front cover. In any case, I think this fact qualifies as a super fact, as do the other fact below (There has been a steep decline in child mortality).

This picture feature five statements (1) Extreme poverty has gone from around 35% 30 years ago to 8-9% now. (2) The share of undernourished people went from 28% in 1970 to 11% in 2015. (3) Children dying before their fifth birthday went from 40-60% in 1800 to 22.7% in 1950 to 3.6% in 2020. (4) Children dying before their fifth birthday in the US went from 3.7% in 1950 to 0.6% in 2023.
These are selected facts from the data.

There has been a steep decline in extreme poverty

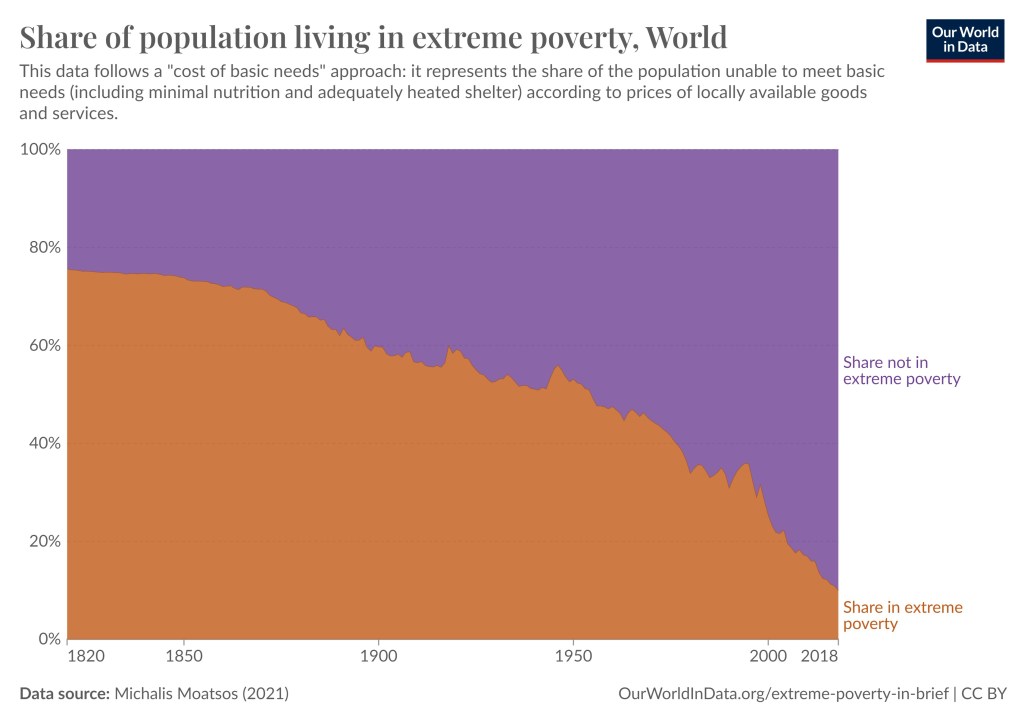
According to the World Bank and Our Data World in Data, an organization which makes data in databases easily accessible to public, extreme poverty went from almost 80% 200 years ago, 60% 100 years ago, about 45% 50 years ago, 34.3% 30 years ago, 23.6%  20 years ago, 8.4% in 2019, then it went up to 9% during the covid epidemic but it seems to be back down to a bit above 8% again. See the graph below as well as the two linked articles in this paragraph.

I should say that extreme poverty is (by the UN, World Bank, etc.) “a condition characterized by severe deprivation of basic human needs, including food, safe drinking water, sanitation facilities, health, shelter, education and information” and is currently defined to be below $2.15. In 2011 it was below $1.90.

The graph shows share living in extreme poverty in brown and share not living in extreme poverty in purple. The graph begins in 1820 at ends in 2018.
This graph from Our World In Data shows a steep decline in extreme poverty over time. Click on the picture to visit the original article.

Other related statistics mentioned in Hans Rosling’s book is that the share of undernourished people went from 28% in 1970 to 11% in 2015. That is despite the earth’s growing population. Related to this is that cereal yield per hectare went from 1.4 ton in 1961 to 4 ton in 2014. This is due to modern agricultural techniques. The share of people with water from protected sources went from 58% in 1980 to 88% in 2015. This statistic was taken from WHO, UNICEF, the World Bank and FAO (the UN Food and Agriculture Organization).

There has been a steep decline in child mortality

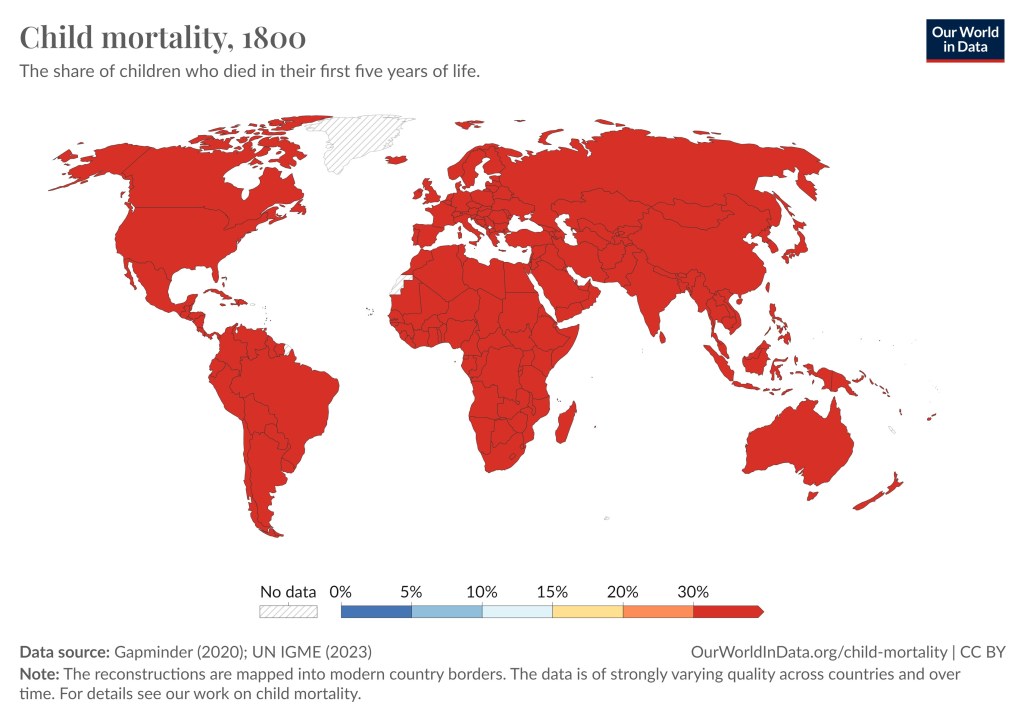
According to Hans Rosling’s book the percent of children dying before their fifth birthday went from 44% in 1800 to 4% in 2016. To get a more complete picture see these articles from Our World In Data, article1, article2, as well as the graph below. For most of humanities existence virtually all societies suffered a child mortality rate between 40% and 60%, but that changed drastically over the last 100 years.

This graph is a world map showing the child mortality rate in different countries as indicated by colors. All countries are red, meaning it is above 30%.
Child mortality rate worldwide in 1800. Some of the data are estimates and may not be reliable. Data sources are UN IGME and Gapminder (an organization similar to Our World In Data).
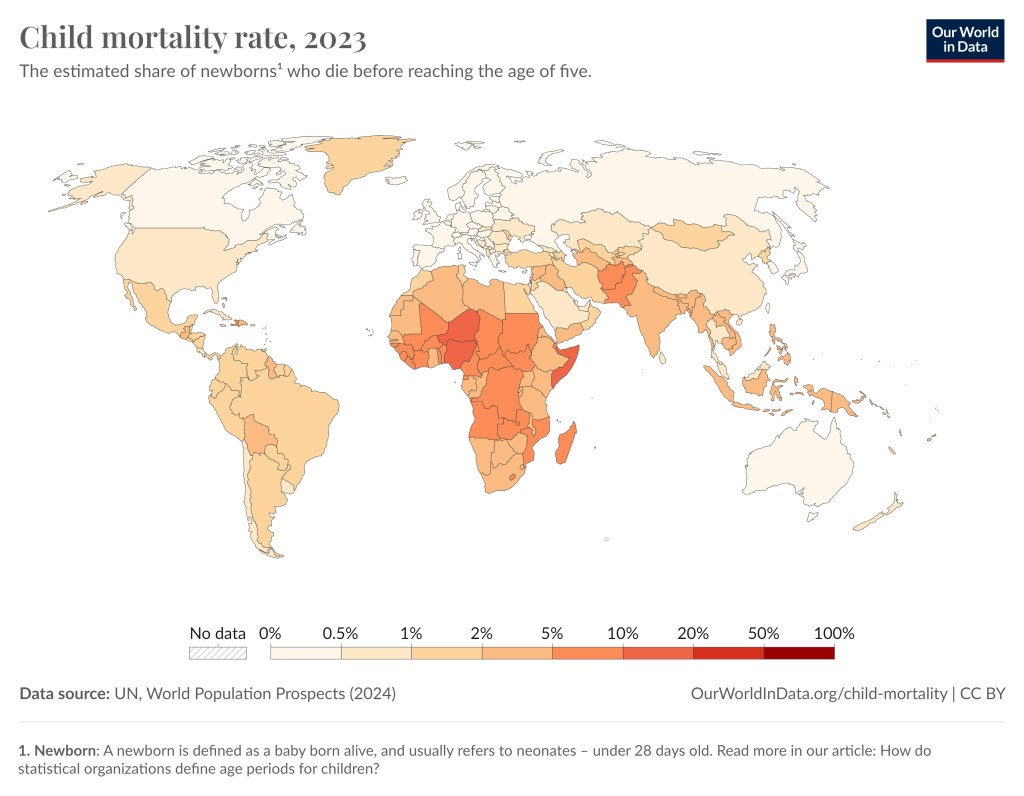
This graph is a world map showing the child mortality rate in different countries as indicated by colors. Niger has the highest child mortality rate of 11.6% and Iceland the lowest at 0.2%.
Child mortality rate worldwide in 2023. Niger has the highest child mortality rate of 11.6% and Iceland the lowest at 0.2%.
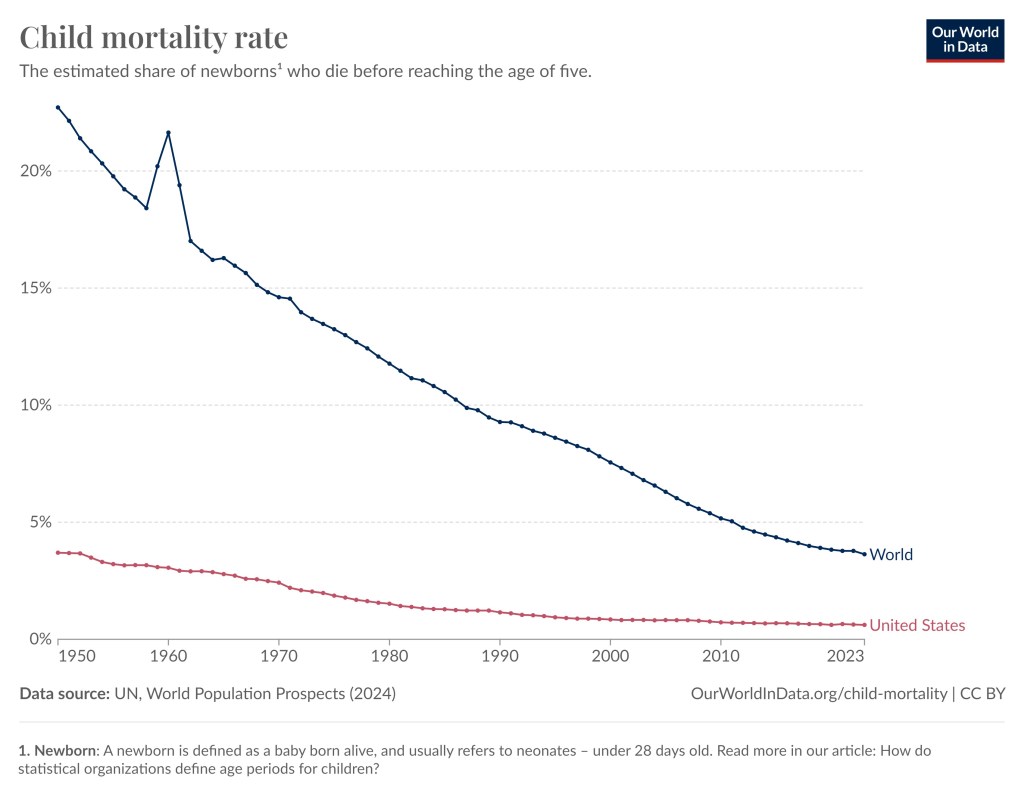
This graphics contain two graphs one for the world (blue) and for the United States (red) | Poverty and child mortality has been sharply reduced worldwide
Child mortality in in the world since 1950. The spike you see around the end of 1950 to 1960 is the great leap forward famine in China. In 1950 the child mortality rate was 22.7% and 2023 the child mortality rate was 3.6%.

Below is the child mortality rate since 1950 for a few selected countries.

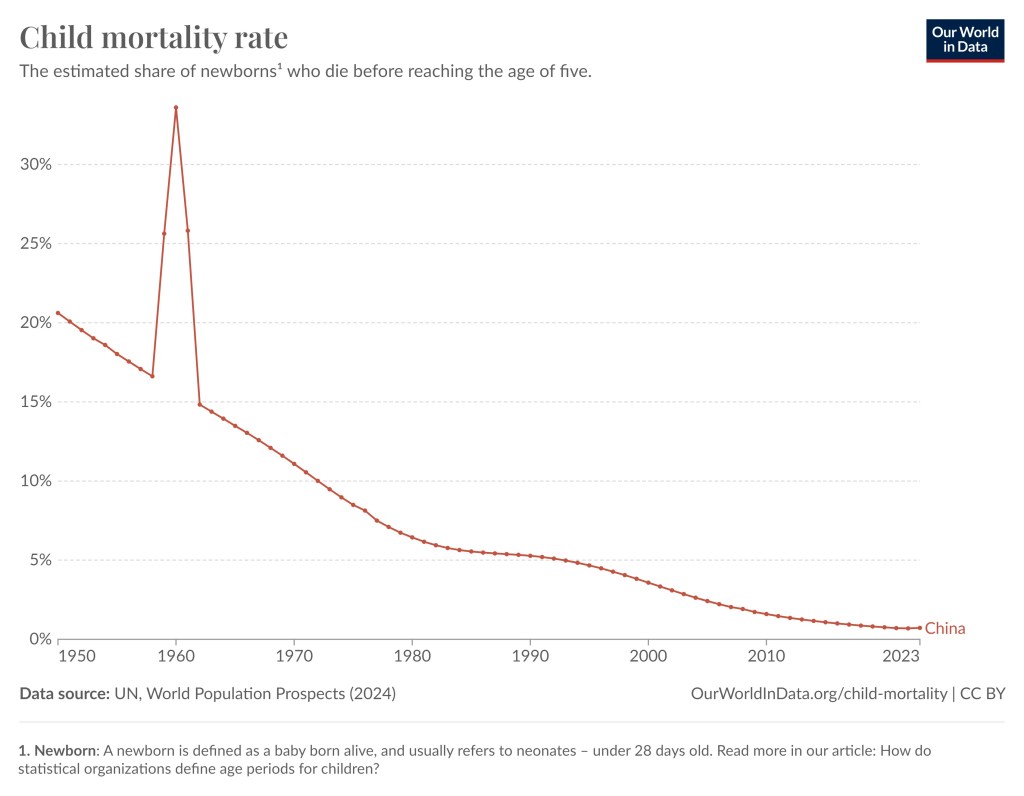
The red graph is showing a decline from 20% in 1950 to 0.7% in 2023 with a spike of almost 40% around 1960 | Poverty and child mortality has been sharply reduced worldwide
Child mortality in China since 1950. The large spike you see around the end of 1950 to 1960 is the great leap forward famine. 15 to 55 million died from starvation. In 2023 the child mortality rate was 0.7%.
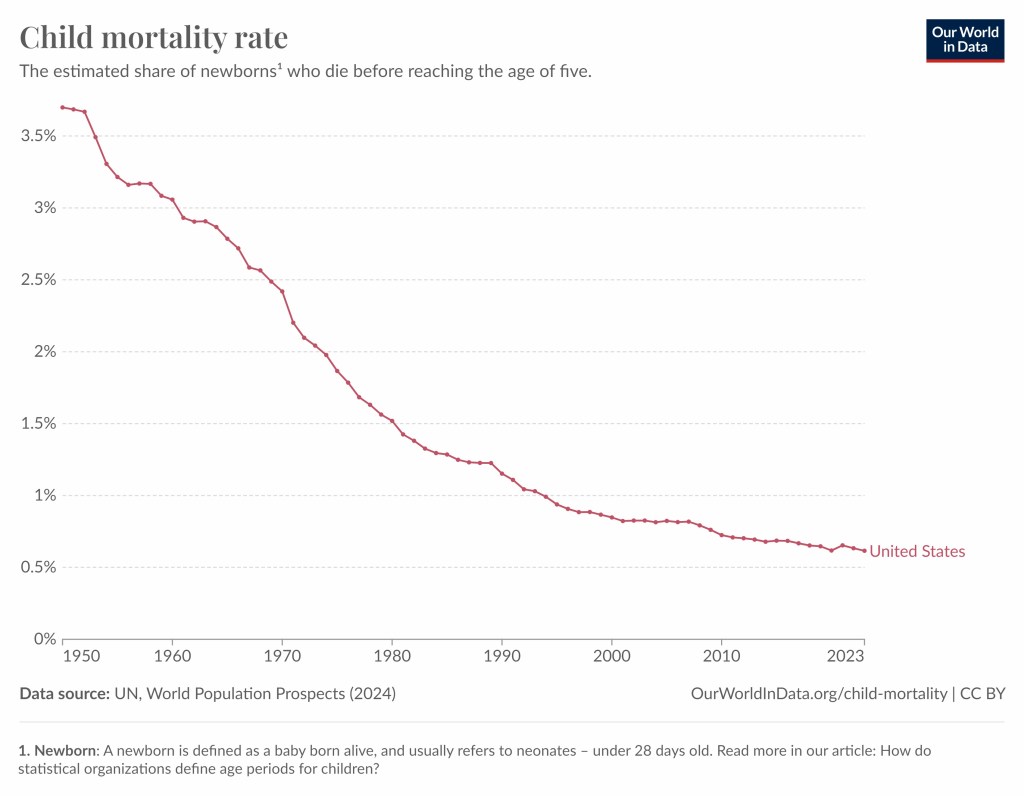
The graph shows a steady decline from 3.7% in 1950 to 0.6% in 2023. The decline of the graph is slower towards the end | Poverty and child mortality has been sharply reduced worldwide
Child mortality in the United States since 1950 (3.7%). In 2023 the child mortality rate was 0.6%.
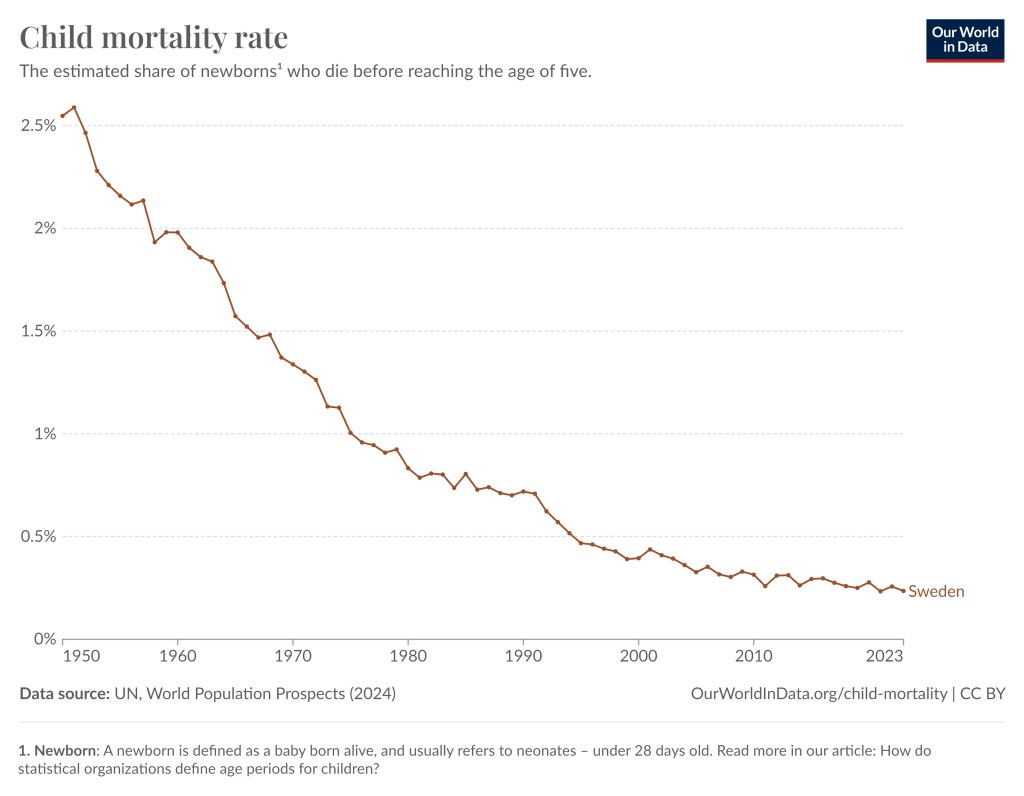
The graph shows a steady decline from 2.6% in 1950 to 0.2% in 2023 | Poverty and child mortality has been sharply reduced worldwide
Child mortality in Sweden since 1950 (2.6%). In 2023 the child mortality rate was 0.2%.


To see the other Super Facts click here

Radon Represents our Largest Exposure to Ionizing Radiation

Superfact 6 : Radon Represents our Largest Exposure to Ionizing Radiation

Radon represents our largest exposure to ionizing radiation. It is responsible for the majority of public exposure to harmful radiation. It is not the sun, the sky, nuclear weapons or nuclear power, or medical treatment, other terrestrial sources, it’s radon. Since we don’t talk much about the very deadly radiation emitted by the radon in our basements that may come as a surprise.

If a radioactive isotope has a long half-life, is that bad? I mean it will be around for a long time. Well, it is complicated. It is important to understand that if the decay rate for an isotope is very slow, in other words, it has a long half-life then it will be less radioactive. If the half-life is 1,000,000 shorter for an isotope X compared to an isotope Y (with a slower decay rate) than it is 1,000,000 more radioactive than isotope Y assuming their decay is of the same type. Short half life means more radioactivity. Long half-life means less radioactivity. The negative aspect of an isotope with a long half-life is that it will be around long, but the positive aspect is that it is less radioactive.

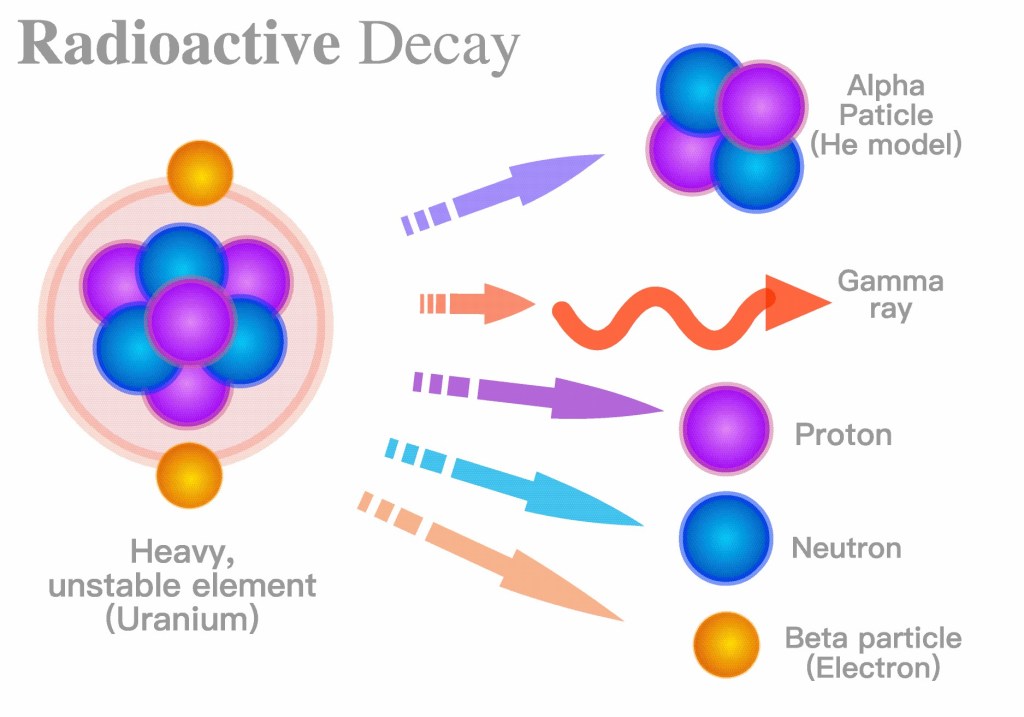
The image shows a Uranium atom on the left arrows in the middle and an alpha particle, a gamma ray, a proton, a neutron, and an electron on the right | Radon Represents our Largest Exposure to Ionizing Radiation
Radioactive decay is the emission of energy in the form of ionizing radiation. There are different types of decay and the decay-rate for different isotopes vary a lot. Stock Vector ID: 2417370135 by grayjay.

I should explain that isotopes mean that an atom can have a different number of neutrons. For example, carbon (coal) has a few common isotopes. C-12 has 6 protons and 6 neutrons,  C-13 has 6 protons and 7 neutrons,  C-14 has 6 protons and 8 neutrons. The isotope we are talking about when we talk about Radon is Radon-222. That is a really bad one. Radon-222 has a half life of 3.8 days which is 432 billion times shorter than Uranium-238, which has a half life of 4.5 billion years. So, if Radon-222 and  Uranium-238 had the same type of decay (they don’t) Radon-222 would be 432 billion times more radioactive than Uranium-238.

Admittedly Uranium-238 isn’t very radioactive, you can safely hold it, but let’s take Plutonium-238, a famously radioactive isotope with a half-life of 87.7 years. Radon-222 has a half-life that is 8,424 times shorter yielding a decay rate and radiation intensity 8,424 times larger than Plutonium-238.

Radon

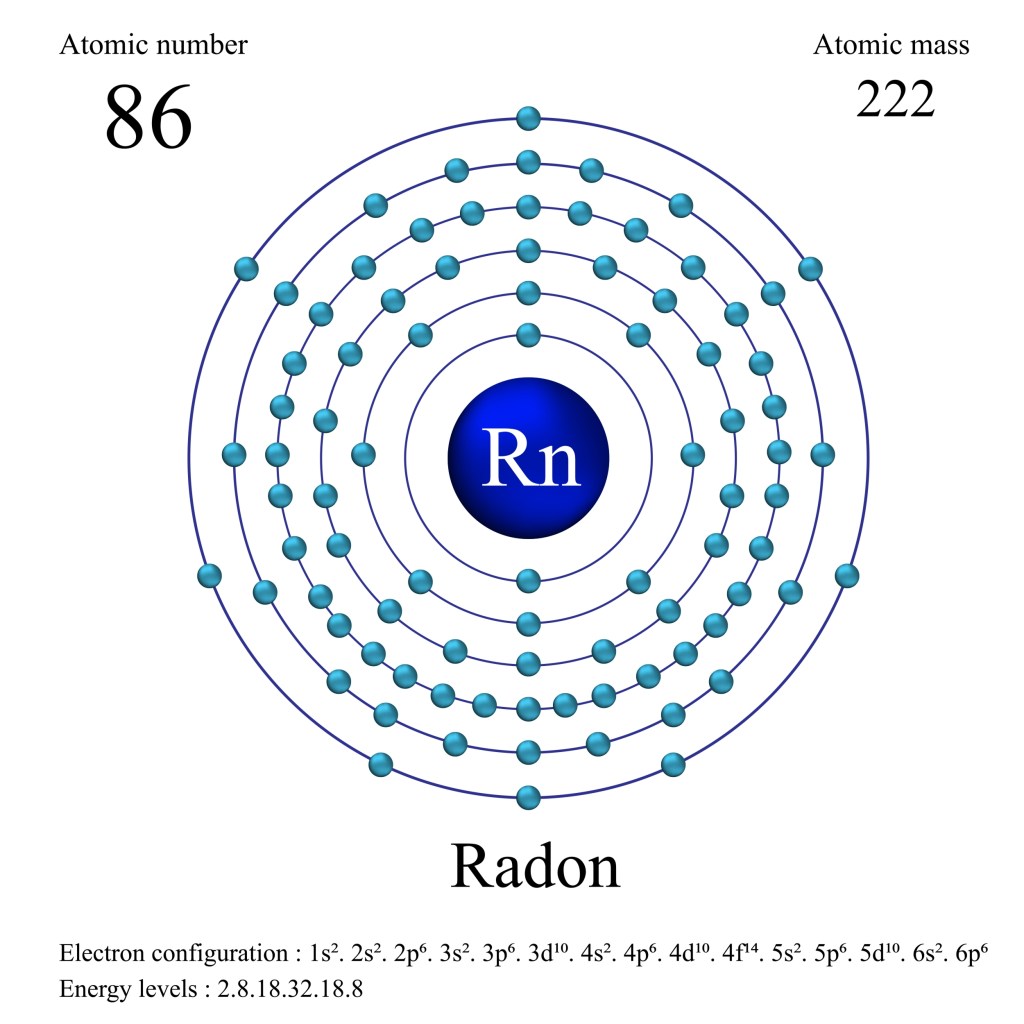
An illustration with a blue nucleus surrounded by 86 blue electrons
Radon-222 isotope has 86 electrons, 86 protons and 136 neutrons. Stock Vector ID: 1919418095 by saran insawat

So, Radon-222 is indeed extremely radioactive. But that means it should disappear quickly. Unfortunately, the inside of the earth is constantly supplying more Radon-222 from the radioactive decay and fission occurring there. Nuclear fission (nuclear reactions)  is happening inside the earth providing about half of earth’s heat and powering the movement of Earth’s continents and crust. Since Radon-222 is extremely radioactive and is being resupplied by our own planet it is a very big source of the radiation we are exposed to.

Among all the different kinds of sources it is the biggest one. Since Radon-222 is a natural phenomenon, and we focus on so many other types of other natural and unnatural radiation sources we tend to underestimate the problem. At least I did when we bought our first house. I was asking Radon, what Radon? I think it is a surprising and important fact and therefore a super fact.

Radon Exposure

The various pathways of radon entering a house are shown as red arrows. The house is an illustration.
Illustration of how radon-222 enters a house. Stock Vector ID: 2128365599 by VectorMine.

The WHO estimates that radon exposure alone was estimated to have caused 84,000 deaths by lung cancer in one year. In 50 years, this would be 4.2 million deaths. The WHO predicted that the eventual total death toll from cancer related deaths from the worst nuclear disaster in history, Chernobyl, was 9,000, which is a lot less than 4.2 million. The numbers given by Greenpeace (which WHO does not accept) are up to a million and the Union of Concerned Scientists estimated 27,000.

Those numbers are all still smaller than the estimated deaths from Radon. Keep in mind that the Chernobyl reactor was a very dangerous reactor (RBMK) that lacked a containment shield, a reactor that could never be built in a western country. I can add that according to WHO the predicted future cancer deaths due to accumulated radiation exposures in the population living near Fukushima was between zero and a 100.

According to the United Nations Scientific Committee on the Effects of Atomic Radiation, more than 40% of the average annual human exposure to ionizing radiation is radon in the air. The other sources (all smaller) are cosmic background radiation, terrestrial radiation from the ground, radiation in food and water, exposure to radiation by medical treatment/exams, nuclear testing, Chernobyl, etc. According to former U.S. Surgeon General Richard H. Carmona, Radon is responsible for the majority of public exposure to ionizing radiation. Radon in our basements is indeed a very big deal compared to other radiation sources.


To see the other Super Facts click here