
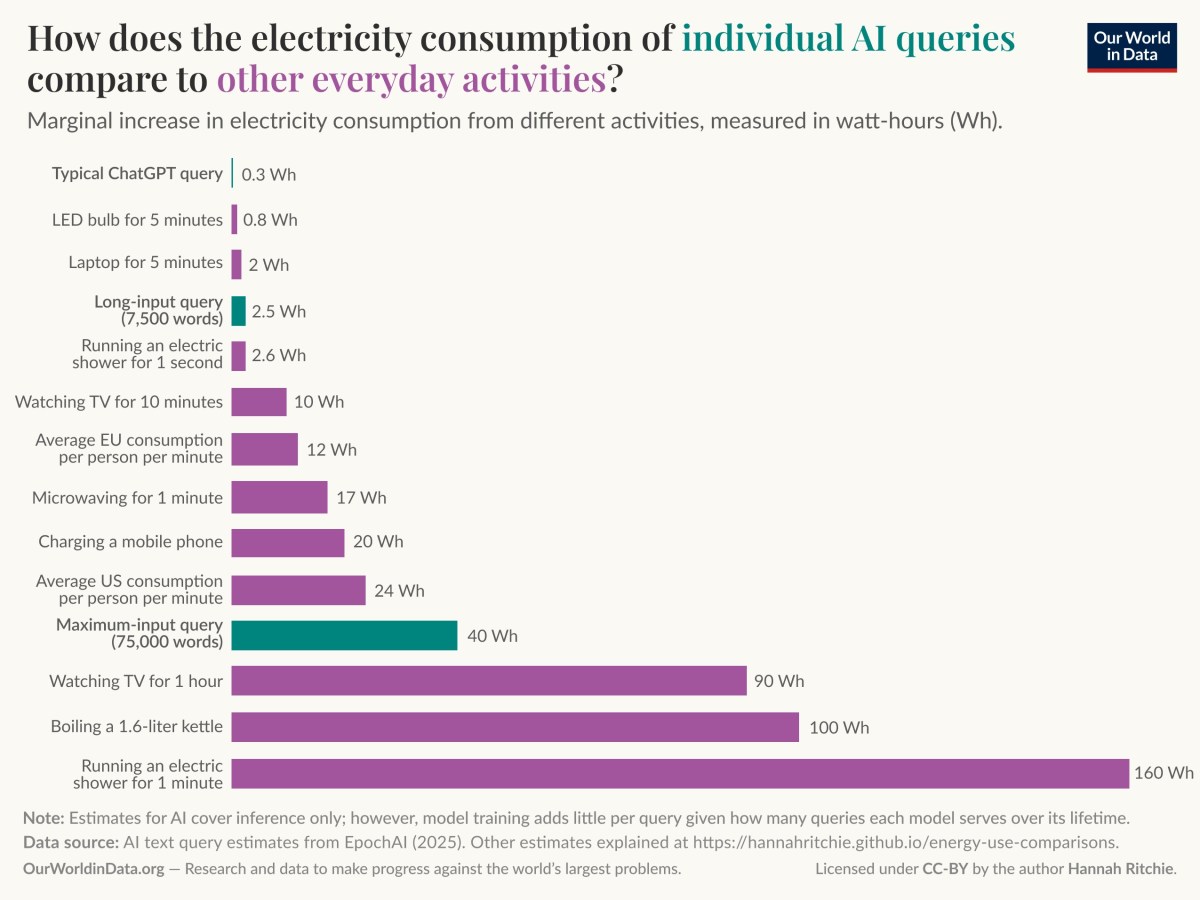
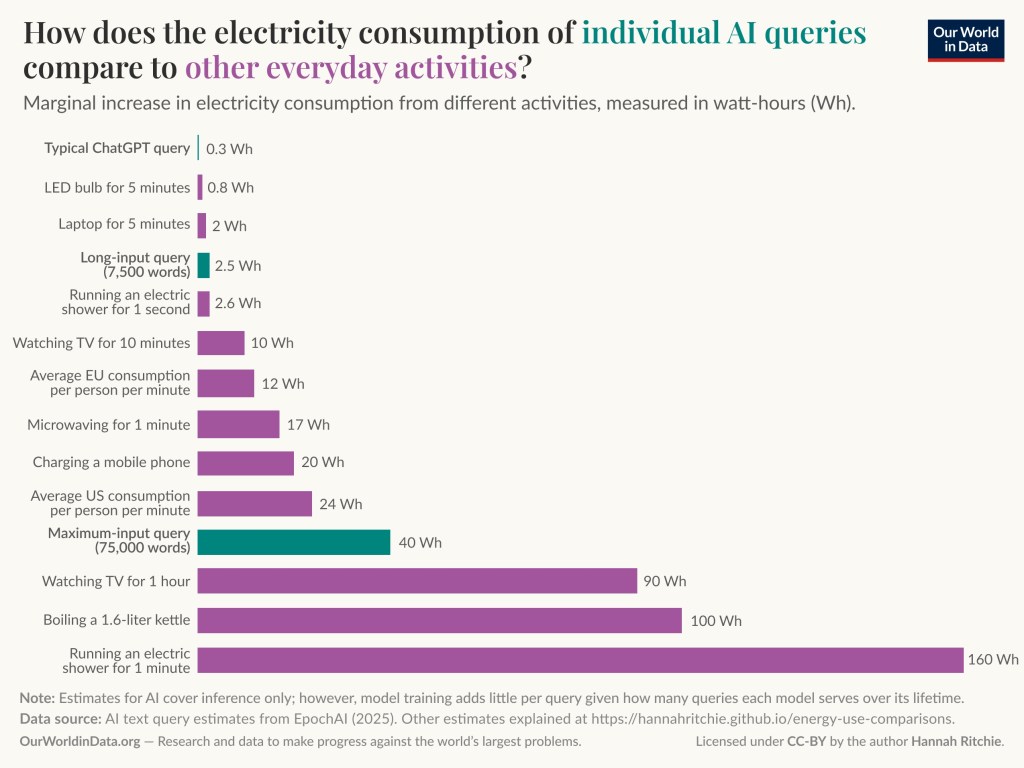
Super fact 138 : A Typical AI Query use less energy than using a laptop for one minute. A typical AI Query use between a few drops of water to half a bottle of water at worst. Data centers in the United States use roughly 0.2% of total U.S. freshwater when combining direct facility cooling and indirect water used for electricity generation. A ten minute shower uses more energy than 5,000 typical AI Queries.
According to the Manhattan institute, NVIDIA, Google and this article the data centers in the United States use roughly 0.2% of total U.S. freshwater when combining direct facility cooling and indirect water used for electricity generation. Most fresh water used in the US is for irrigation / agriculture and the second largest consumer of fresh water is thermoelectric plants (coal, natural gas, nuclear). Worldwide 70% of freshwater used is used by agriculture and industry is another big user. According to this article Google says that a typical AI query uses five drops of water, and half a bottle of water at the worst. You can read more about water usage here, here, here, and here.
Around half of all energy used by data centers is thermoelectric. Most of the freshwater usage that is part of the 0.2% number is due to the thermoelectric powerplants supplying the energy to data centers. However, it should be noted that as clean energy is increasingly adopted this number will decline. On the other hand, the manufacturing of computer chips, which also use a lot of freshwater, is not taken into account in this number because it is a onetime event that is difficult to account for. It might double or even triple the 0.2% number, which is still very little.
It should be noted that there are a lot of valid concerns about AI and datacenters, but to reduce carbon emissions and pollution and to waste less freshwater, it might be more effective to eat less beef, irrigate your lawn less, take shorter showers, drive an EV or a hybrid instead of a gas guzzling SUV with an internal combustion engine, or perhaps use public transportation. You’d start with the low hanging fruit. In fact, if the AI query you are about to make saves you some time on your laptop, then the AI query probably helps the environment.
Datacenters use less freshwater than many of us would expect, and typical AI queries use almost no energy and correspond to very little use of freshwater. I think this comes as a surprise to many considering the ongoing datacenter panic. It is therefore a super fact.
Datacenters and Energy Usage
Datacenters use a significant amount of energy but perhaps not as much as one would think. However, their energy use is increasing, and they are part of our rising energy demand. With a growing population, a growing economy, cryptocurrencies, AI, datacenters, electrification, we are going to need a growing supply of electricity and an expanding grid. Hopefully our energy sources will be mostly clean energy, which luckily seems to be the trend. See “The Unfolding Clean Energy Revolution”.
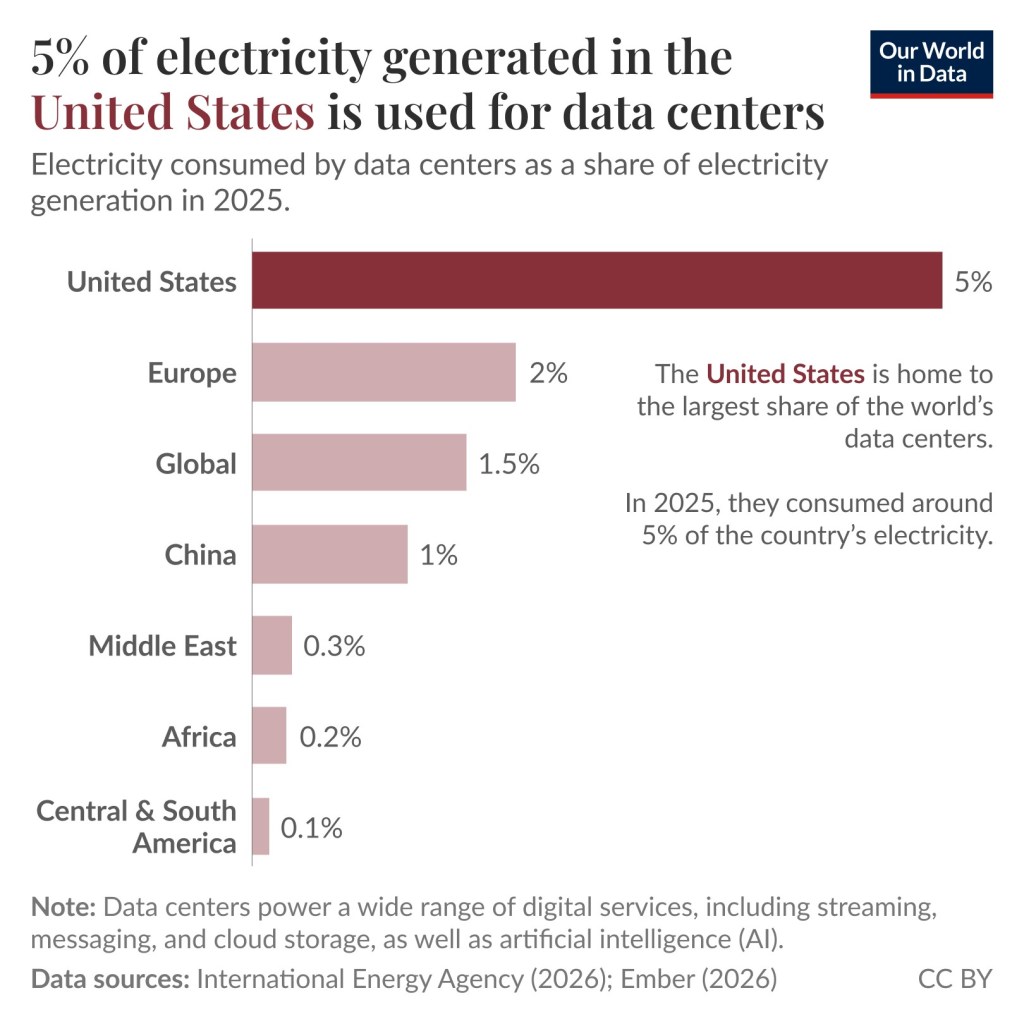
The United States is the country with the most datacenters and as can be seen in the graph below, the datacenters in the United States use a relatively large portion of its available electricity for datacenters and it is increasing.
The Growing Energy Use by Datacenters
The three graphs below are from this page and this page. Note the projected increase in electricity use for data centers. Note that by visiting these pages you play around with the graphs and changed regions and countries and other settings to generate your own graphs.
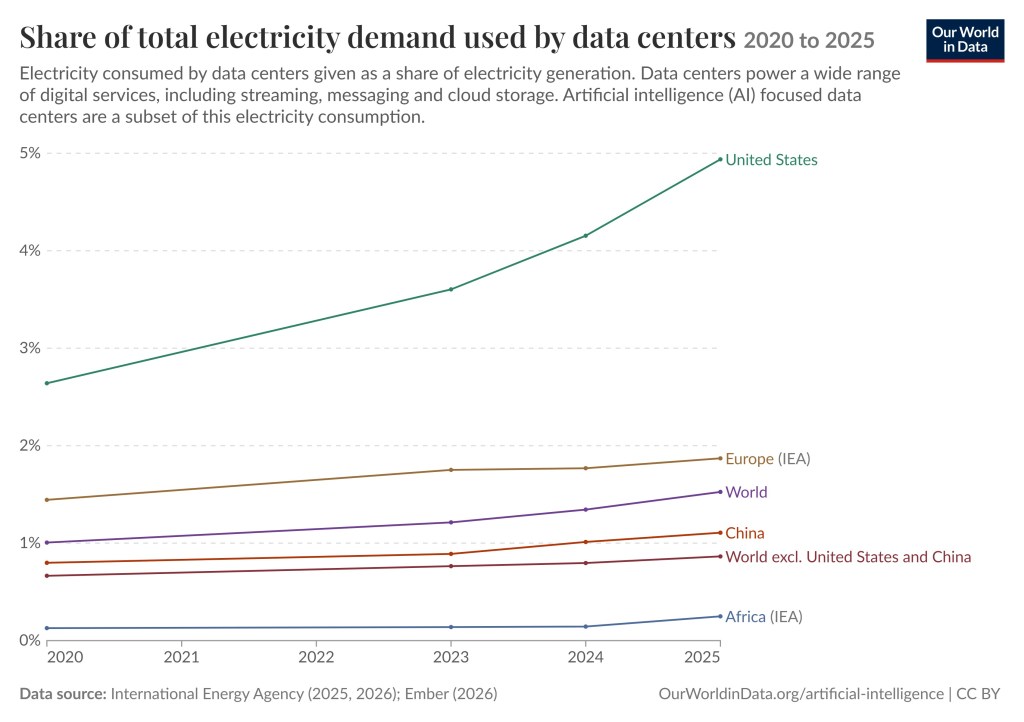
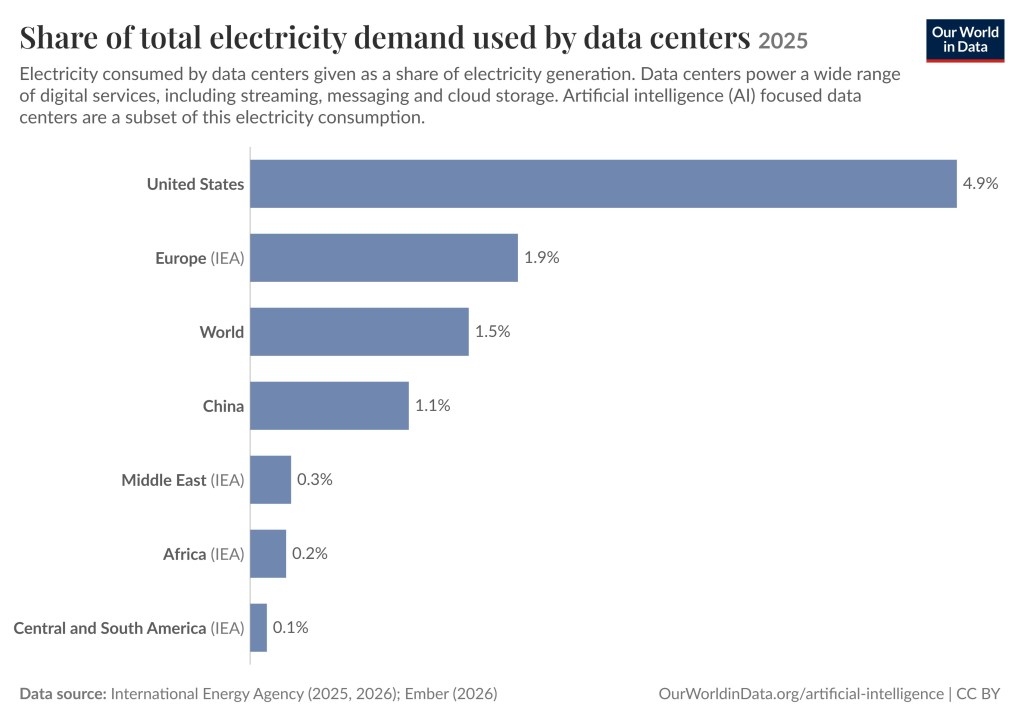
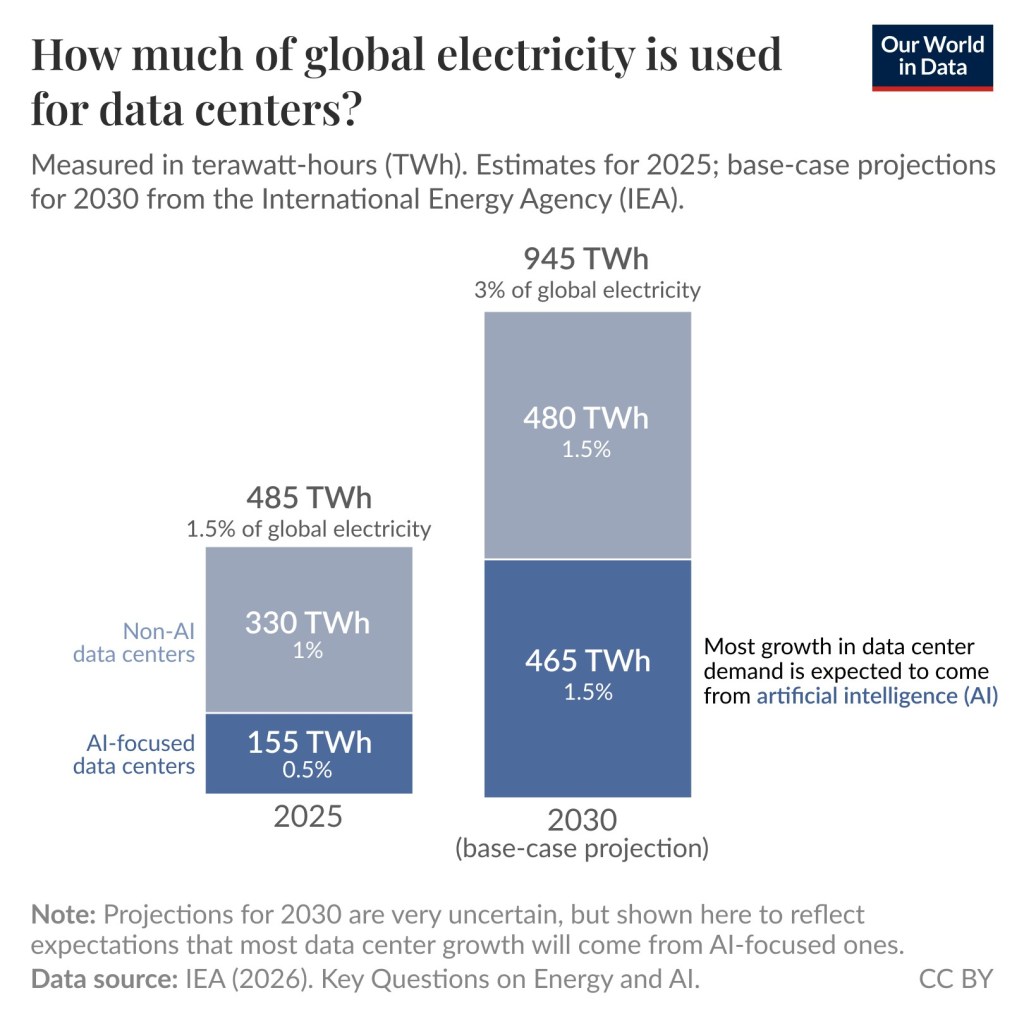
As you can see in the graphs above, there is a significant portion, but not a large portion, of electricity usage by data centers. However, it is important to note that only a portion of this is for Artificial Intelligence. It will grow though. You can read more about this issue here, and here, or here.
Fresh Water Usage in the United States
The graphics below showing the source and use of freshwater in the United States is in the public domain and is taken from this article.
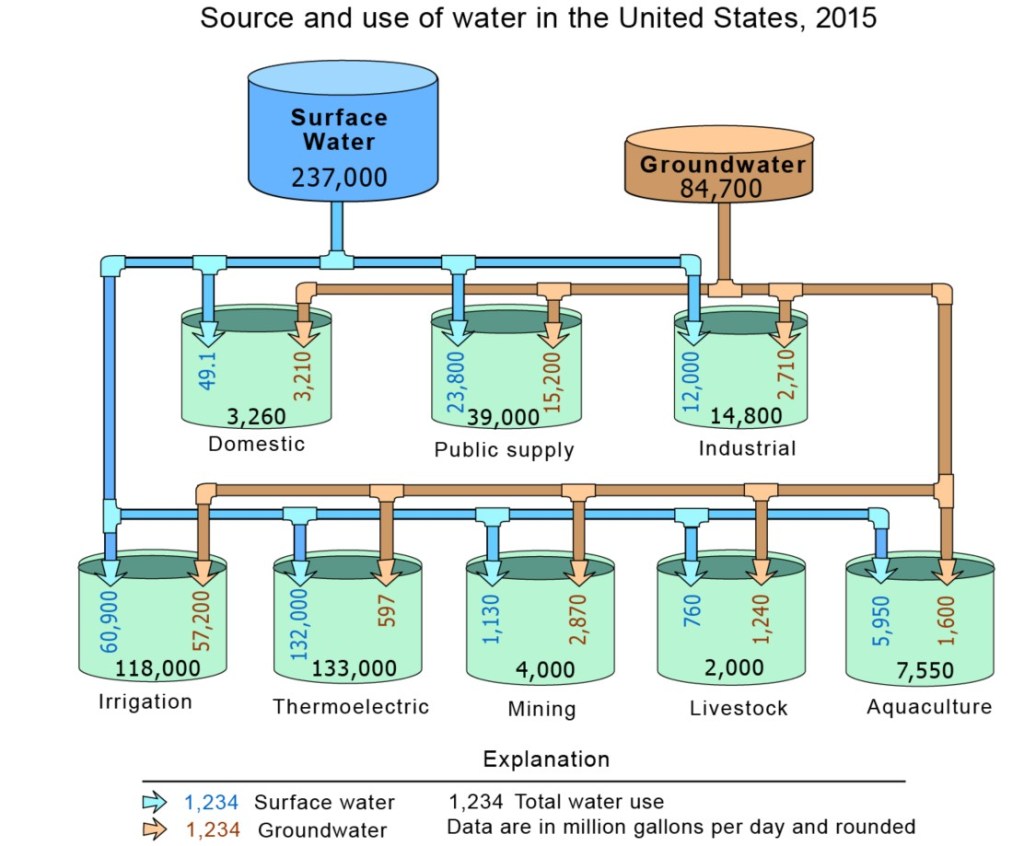
In the diagram above, the top row of cylinders represents where America’s freshwater came from (source) in 2015, either from surface water (blue) or from groundwater (brown). You can see most of the water we use came from surface-water sources, such as rivers and lakes. About 26 percent of water used came from groundwater. The pipes leading out of the surface-water and groundwater cylinders on the top row and flowing into the bottom rows of cylinders (green) show the categories of water use where the water was sent after being withdrawn from a river, lake, reservoir, or well. For example, the blue pipe coming out of the surface-water cylinder and entering the public supply cylinder shows that 23,800 Mgal/d of water was withdrawn from surface-water sources for public-supply uses (you probably get your water this way). Likewise, the brown pipe shows that public-suppliers withdrew another 15,200 Mgal/d of water from groundwater sources. Each green cylinder represents a category of water use. The industrial cylinder, for instance, shows how much groundwater, surface water, and total water was used inthe United States, each day, by industries.
Other Super Facts Related to Artificial Intelligence
- The Nobel Prize in Physics and Neural Networks
- Artificial Intelligence is Not New
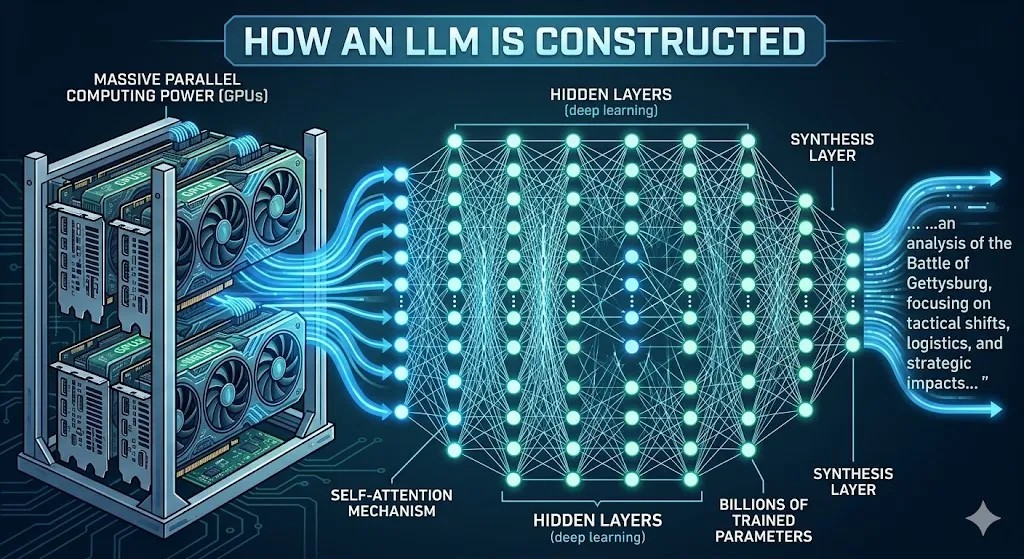
- Large Language Models is just One Branch of Artificial Intelligence
- The Dark Side of Artificial Intelligence
- Transistors per Microchip Increased by More than 50 million Times in 50 Years
- AI is Already More Capable Than Humans in Many Areas

