Digging Up Super Facts

Daily writing prompt
What change, big or small, would you like your blog to make in the world?

I have two blogs, Leonberger Life and this one called Superfactful.

Leonberger Life feature amusing and heartwarming stories about our late Leonberger dog Bronco, as well as other Leonbergers. It also has a lot of information about the Leonberger breed, the history, care, training, Leonberger organizations, etc. I also wrote a Leonberger book, which I am featuring in the sidebar. With my Leonberger Life blog I want to spread information about the Leonberger breed, a rare, large, furry, friendly and fun dog breed and also bring attention to my book The Life and Times of Le Bronco von der Löwenhöhle, stories and tips from thirteen years with a Leonberger.

The goal of Superfactful, which is this blog, is to create a long list of facts that are important, not trivia, and that are known to be true and yet are either disputed by large segments of the public or highly surprising or misunderstood by many. I call these kinds of facts Super facts because they could potentially be very impactful on how we view the world.

Humans have accumulated an enormous amount of knowledge. Science does not know everything, but it knows a lot. The same cannot be said for us as individuals. We know next to nothing and harbor a lot of false beliefs. I think that is pretty much true for all of us, including me, but we may not know it. With this blog I am trying to correct some of that, at least regarding important facts. In addition, along the way, I am hoping to learn a lot myself and have some of my own false beliefs corrected.

In short, the change I would like to make in the world with my blog is to correct as many false beliefs as possible and educate my readers, and myself, about facts that are both important and mind blowing.

A blue brain is splitting up into pieces.
Smash your old beliefs with new surprising facts, super facts. Expand your mind. Shutterstock ID: 1685660680 by MattL_Images

What is a Super fact?

A super fact is:

  • An important fact but it can be simply stated.
  • Very surprising, shocking, widely disputed, misunderstood, or mind-blowing.
  • Yet it is true with a very high degree of certainty.

The first two criteria are subjective. The last criteria can be determined from longstanding scientific consensus, my own expertise and education (valid for just a few topics), agreement between multiple reliable online or offline sources such as agreement among research papers, reputable scientific organizations, NASA, NOAA, Pew Research Center, Our World in Data, etc. I should say I also link to less academic sources such as Wikipedia, but I do not solely rely on them.

You can read more about how I choose super facts here. Also, I am open to challenges based on good data (not opinions), as well as questions. With that I don’t mean that you cannot give your opinion in a comment. I just won’t update or remove a super fact based on an opinion. In addition, I am happy to receive suggestions for super facts. I am trying to collect a few hundred super facts and need all the help I can get. In the end I want to pick the 100 best ones. I might use a poll for that.

Sometimes a super fact involves doing myth busting of a popular myth and sometimes a super fact is stating something that is well known but disputed by many. In these cases, the evidence is likely to be conclusive, but the fact is still disputed by those who don’t know much about the evidence, or don’t want it to be true. In this case, I will include a substantial amount of evidence, and it might be lengthy. People get bamboozled all the time, and that includes me. It is not easy to admit that you have been bamboozled. You can read about my own experiences with that here.

Picture shows a scale held by a pointing finger. Fact is on the left shown as a bright light bulb. Myth is shown on the right as grey ball | Digging Up Super Facts
Fact or myth. Shutterstock Asset id: 2327968607

Examples of Super Facts

At the time of posting this I have made plans for 150 super facts and so far, I have posted 54. I will post a lot more. Below I am listing a few of my first 54 super facts.

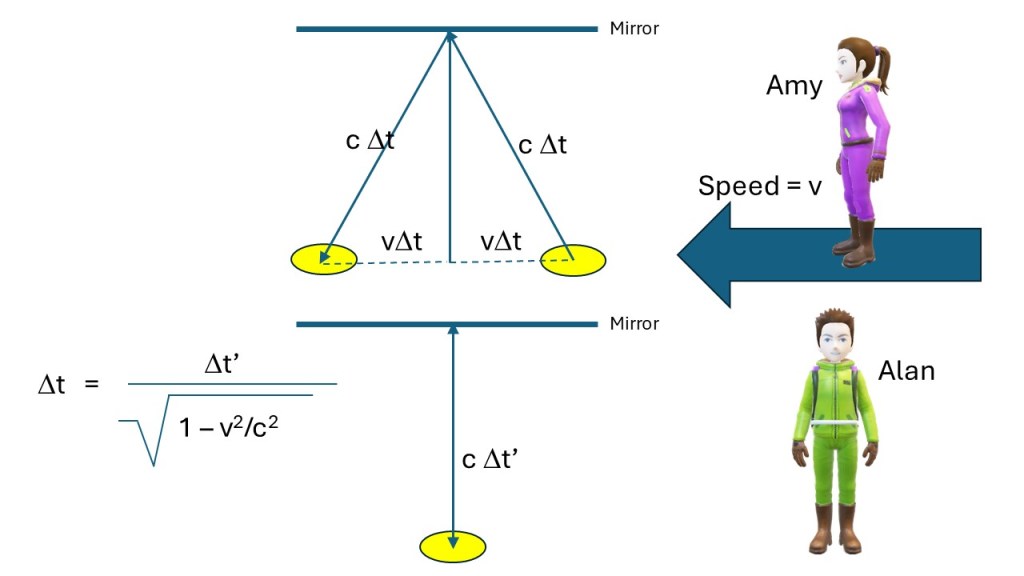
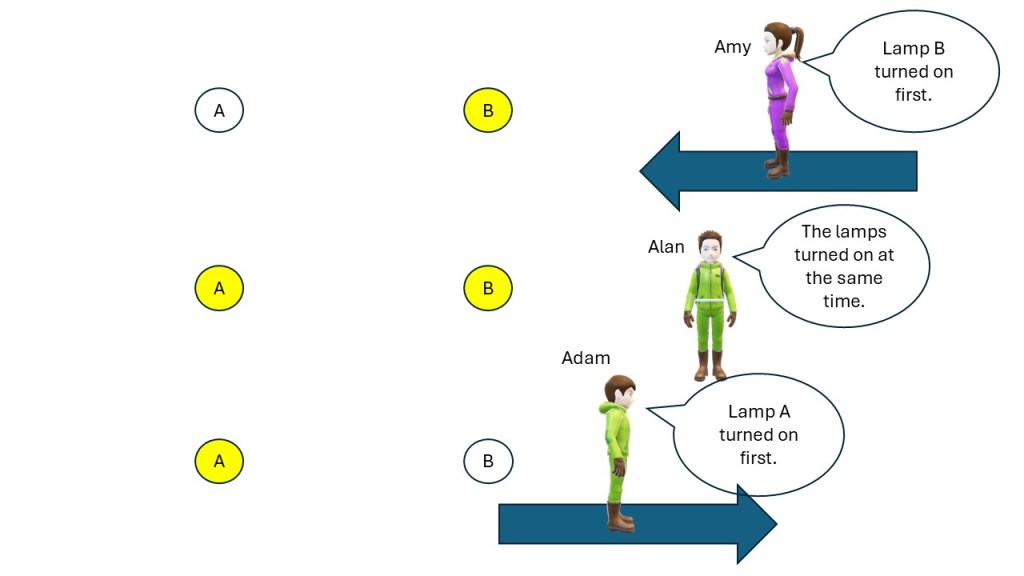
Superfact 5 : Two events may be simultaneous for some but not for others. Click to visit post.

Two events may be simultaneous for some but not for others. This means that two events that are simultaneous to an observer may happen at different times to other observers. If two lamps A and B turn on at the same time according to observer #1, lamp A may turn on first for observer #2, and lamp B may turn on first for observer #3. All three observers are correct because time is relative.

The picture shows three pairs of lamps and three people. The setup is used to show three situations.
Amy is traveling at a high speed to the left compared to two lamps A and B. Alan is standing still compared to the lamps. Adam is traveling at a high speed to the right compared to two lamps A and B. Alan turns on the lamps at the same time. After considering the travel time of the light she sees, Amy concludes that lamp B turned on first. After considering the travel time of the light he sees, Adam concludes that lamp A turned on first. I should add this non-simultaneity can only happen if the lamps are separated by a distance.
Superfact 7 : Poverty and child mortality has been sharply reduced worldwide. Click to visit post.

Extreme poverty as well as child mortality has been sharply reduced the world over. The countries that are the worst-off today are still better off than the countries that were doing the best at the beginning of the 19th century. Over the last 20 years extreme poverty and child mortality have continued to decline sharply.

This graphics contain two graphs one for the world (blue) and for the United States (red) | Digging Up Super Facts
Child mortality in in the world since 1950. The spike you see around the end of 1950 to 1960 is the great leap forward famine in China. In 1950 the child mortality rate was 22.7% and in 2023 the child mortality rate was 3.6%.
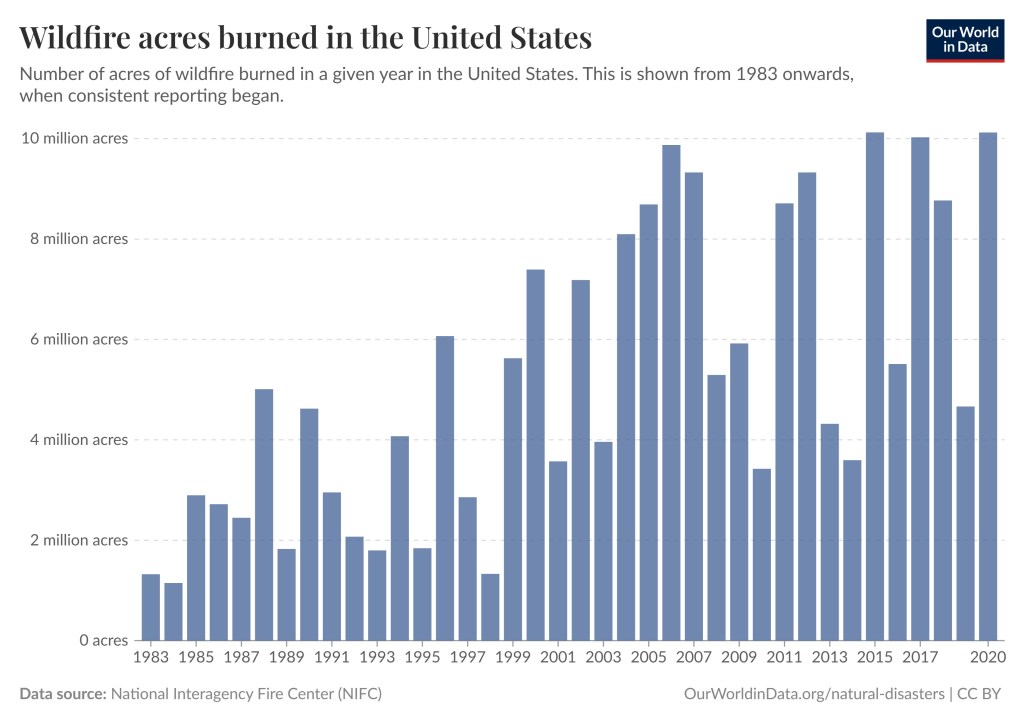
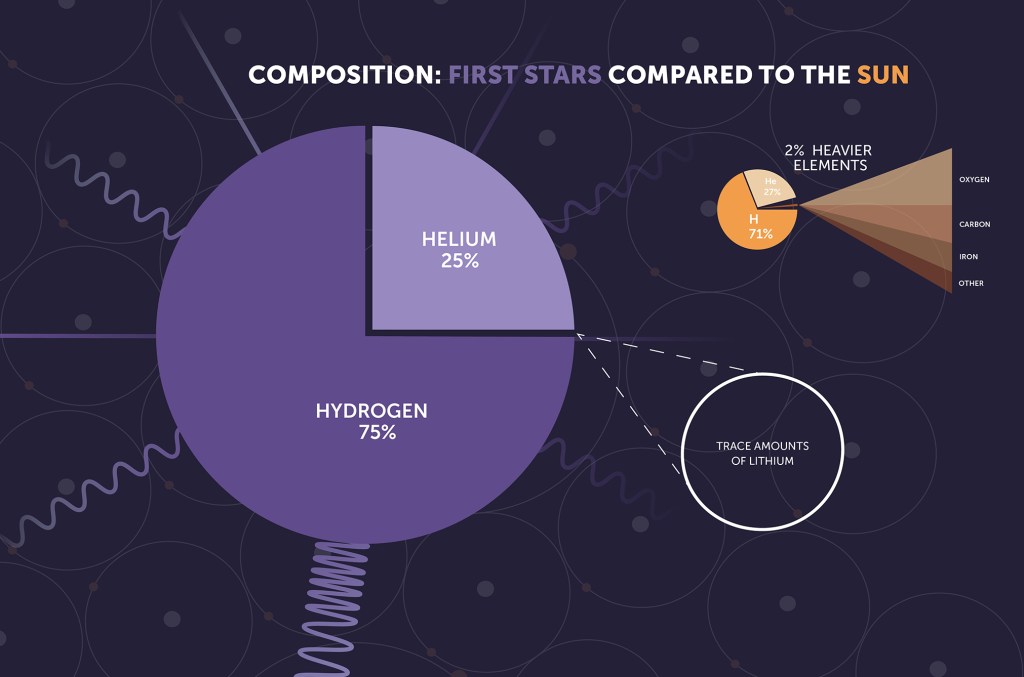
Superfact 25: Global Warming is Happening and is Caused by us – click to visit post.

Global warming is happening. Or if you call it Climate Change or Climate Disruption is indeed happening. And it is happening very fast. We also know that it is caused by us primarily as a result of our burning of fossil fuels. There is a long-standing scientific consensus on these two facts because the evidence is conclusive. Check the evidence in the post.

Superfact 28: That Earth is round was well known long before Columbus – click to visit post.

That Earth is round, or spherical (or closely spherical) had been known for at least a couple of thousand years by the time Columbus set sail. Columbus did not set sail to prove that earth was round, and he knew it was round.

On the left a wheel with spokes. On the right there is a sphere and sun rays that hit in two places. One without a shadow and one with a shadow | Digging Up Super Facts
Illustration of the measurement of the Earth circumference by Eratosthenes (2,300 years ago). On June 21st there is no shadow in Syene/Aswan but there is one in Alexandria. Asset id: 2319651251 by Javier Jaime


To see a list of the Super Facts click here

Climate change worsens wildfires in the US

Super fact 52 : Climate change, including increased heat, extended drought, and a thirsty atmosphere, has been a key driver in increasing the risk and extent of wildfires in the United States, particularly the western United States during the last two decades. The number of Wildfire acres burned in the United States has significantly increased even though the number of wildfires has not. Another important factor is forest management.

The graph consists of blue bars corresponding to a year starting in 1983 with the last bar being 2020. The bars show the number of million acres burned per year in the US. In 1983 and 1984 the bars show between 1 and 2 million acres burned. The following three years more than 2 million acres were burned. From 2015 to 2020 the number of acres burned annually is between 5 and 10 million acres | Climate change worsens wildfires in the US
Wildfire acres burned in the United States. Number of acres of wildfire burned in a given year in the United States. This is shown from 1983 onwards, when consistent reporting began. Data source : National Interagency Fire Center (NIFC). Presented by OurWorldinData/natural disasters.

To some people this does not come as a surprise. However, due to the complexity of the issue combined with political spin, this is a surprise to me, or even something they refuse to believe. I’ve come across many people who are surprised to hear that there really is a connection between climate change and wildfires in regions of the world which are getting dryer and hotter due to climate change. There are also others who are surprised to hear about the complex picture and the importance of good forest management. In any case, since it is a surprising fact to many, and an important fact, I consider it a super fact.

As super fact 52 above states, Climate change is a key driver in the worsening of wildfires in the US, particularly in the American West. A 2016 study published in PNAS found that human-caused climate change caused over half of the documented increases in fuel aridity since the 1970s and doubled the cumulative forest fire area since 1984. I can add that we know that Climate Change, or if you call it Global Warming, is Happening and is Caused by us, primarily due to our burning of fossil fuels. I can also add that Scientists Agree that Global Warming is happening and that we are the Cause.

Wildfires and the Complex Statistical Picture

In general, you can’t look at wildfire statistics and draw conclusions without considering the context. Below are some considerations.

  • Wildfires are not started by climate change or poor forest management. They are started by lighting, falling powerlines, campfires that are not properly put out, and sometimes by arson. That doesn’t mean that climate change and poor forest management does not increase the risk and extent of wildfires.
  • Research organizations such as NOAA recognize that wildfire is a natural part of the western US ecosystem. However, climate change is significantly exacerbating the problem by creating conditions more conducive to intense and widespread wildfires.
  • Suppression of fire in certain ecosystems may in fact increase the likelihood that a wildfire will occur.
  • There are wildfires started intentionally to prevent future wildfires.
  • In the past, forests evolved with frequent, low-intensity fires that helped clear out underbrush. They can have ecological benefits. Therefore, the number of wildfires may not have increased over the last 100 years.
  • Local conditions and forest management have evolved through time complicating the wildfire statistics around the world.
  • In the past reporting was not always consistent.

That does not mean that we don’t know whether climate change worsens wildfires or not. Research organizations such as NASA, NOAA, NOAA (again), NOAA on LA fires , Ohio University, are all in agreement on the fact that Climate change has been a key driver in increasing the risk and extent of wildfires in the United States. Other organizations such as AccuWeather, Texas 2036, the Nature Conservancy, IFAW, American Progress, and the New York Times concurs.

The photo shows tree trunks on fire and professional firefighters extinguishing a large, high-priority part of a forest fire.
Highly skilled hotshot firemen crew working in a challenging remote area with flames reaching the treetops. Shutter stock asset id: 2258645599 by Gorodenkoff

Fix Our Forest Act

Climate change is a huge problem that is going to take decades to tackle and the whole world needs to be involved in that effort. However, we can quickly address wildfires here in the US, especially the American West by addressing the other half of the problem, forest management. There is currently a bill in congress called the Fix Our Forest Act that does that. It streamlines and enhances forest management based on the science. In the house of representatives, it has the number H.R.471 and in the Senate it is S.1642.

I was recently in Washington DC to do volunteer lobbying for these bills. You can read about it here.


To see the other Super Facts click here

Developed nations have successfully reduced carbon emissions

Super fact 42 : The developed nations (rich countries) have reduced their carbon emissions since the 1990’s despite continued GDP growth, even if we take offshore production into account. In addition, many developing countries have succeeded in reducing their emissions as well. Other fast-growing developing countries have flattened or at least slowed their increase in carbon emissions. Many countries have decoupled economic growth from CO2 emissions. In other words, we do not need to increase carbon emissions or burn more fossil fuels to grow the economy.

This is good news as well as a surprise to many people who falsely believe that to grow the economy (grow GDP) you need to burn more fossil fuels and an increase in carbon emissions is inevitable if you want to grow the economy. The data shows otherwise. This is important news that is difficult to believe in for many people. It is a super fact.

Carbon Emissions and GDP

In the past carbon emissions were strongly correlated with national wealth. The wealthier a nation was the higher its carbon emissions were and as the economy grew so did the carbon emissions. This has not been true since the 1990’s. The developed nations of the world have continued growing their GDP whilst reducing their carbon emissions.

You may think that the reason is that we shipped much of our manufacturing overseas and that if you consider the consumers in the importing country responsible for the overseas emissions this decoupling of GDP and emissions would disappear. But you would be wrong. Even if you make the consumers in the importing country responsible for the emissions during production in the exporting country the emissions have gone down. One example taken from this article in Our World in Data is the United Kingdom.

In the graph below for the UK the GDP (adjusted for inflation) grew by 53.26% between 1990 and 2023 and the emissions were reduced by 57.66%. If make UK consumers 100% responsible for the emissions in China and India, etc., caused by the production of goods imported to the UK the reduction until 2022 was 38.59%. That is not as much but it is still impressive and demonstrates the decoupling between GDP growth and carbon emissions.

The graph shows three plotted graphs, a dark blue one showing GDP per capita, a light blue one showing UK carbon emissions per capita and a red one showing trade adjusted carbon emissions per capita. The GDP graph is increasing by more than 50% over 33 years and the CO2 emissions per capita graph is decreasing by almost 60% and the trade adjusted carbon emissions decline by almost 40% | Developed nations have successfully reduced carbon emissions
Data source: Data compiled from multiple sources by World Bank (2025); Global Carbon Budget (2024); Population based on various sources (2024). Note: GDP per capita is expressed in international dollars at 2021 prices. Graph taken from Our World in Data.

The text in the graph above is difficult to read so I’ve copied it below in larger text:

  • Consumption-based emissions: Consumption-based emissions are national or regional emissions that have been adjusted for trade. They are calculated as domestic (or ‘production-based’ emissions) emissions minus the emissions generated in the production of goods and services that are exported to other countries or regions, plus emissions from the production of goods and services that are imported. Consumption-based emissions = Production-based – Exported + Imported emissions.
  • Fossil emissions: Fossil emissions measure the quantity of carbon dioxide (CO2) emitted from the burning of fossil fuels, and directly from industrial processes such as cement and steel production. Fossil CO2 includes emissions from coal, oil, gas, flaring, cement, steel, and other industrial processes. Fossil emissions do not include land use change, deforestation, soils, or vegetation.
  • International dollars: International dollars are a hypothetical currency that is used to make meaningful comparisons of monetary indicators of living standards. Figures expressed in constant international dollars are adjusted for inflation within countries over time, and for differences in the cost of living between countries. The goal of such adjustments is to provide a unit whose purchasing power is held fixed over time and across countries, such that one international dollar can buy the same quantity and quality of goods and service no matter where or when it is spent. Read more in our article: What are Purchasing Power Parity adjustments and why do we need them?

Below is the same type of graphs for the United Kingdom as well as France, Germany, Sweden, United States and Finland. The numbers for these countries are as follows:

  • United Kingdom: GDP growth 53.26%, CO2 emissions reduction 57.66%, trade adjusted CO2 emissions reduction 38.59%.
  • France: GDP growth 39.74%, CO2 emissions reduction 40.64%, trade adjusted CO2 emissions reduction 28.82%.
  • Germany: GDP growth 49.04%, CO2 emissions reduction 46.72%, trade adjusted CO2 emissions reduction 33.95%.
  • Sweden: GDP growth 56.00%, CO2 emissions reduction 48.45%, trade adjusted CO2 emissions reduction 34.75%.
  • United States: GDP growth 68.05%, CO2 emissions reduction 29.25%, trade adjusted CO2 emissions reduction 17.04%.
  • Finland: GDP growth 45.69%, CO2 emissions reduction 50.54%, trade adjusted CO2 emissions reduction 42.79%.

Note these are emissions reduction numbers per capita (growth for GDP) not carbon emissions per capita. For example, the United States has three to four times larger carbon emissions per capita as, for example, Sweden or France.

All these graphs show the same trends as the UK graph.
Data source: Data compiled from multiple sources by World Bank (2025); Global Carbon Budget (2024); Population based on various sources (2024). Note: GDP per capita is expressed in international dollars at 2021 prices. Graph taken from Our World in Data.

Many Countries Have Reduced Their Carbon Emissions

However, the story does not end with these six countries or even with the developed world. The 30 graphs below all demonstrate significant reductions in carbon emissions as GDP is growing, demonstrating a decoupling between GDP growth and carbon emissions. Note that Azerbaijan’s GDP grew by 93% as its carbon emissions was reduced by 7% (all carbon emissions below are adjusted for trade).

This is 30 small graphs featuring a blue and red line. The blue line shows GDP growth since 1990 and the red line carbon emissions since 1990. All blue lines point up and all red lines point down | Developed nations have successfully reduced carbon emissions
Data sources: Global Carbon Project & World Bank. There are more countries that achieved the same, but only those countries for which data is available and for which each exceeded 5% are shown. The graphs are from Our World in Data <<Link-1>>. All carbon emissions in the graphs above are adjusted for trade.

The World’s Carbon Emissions Per Capita Has Flattened

World GDP per capita has increased by 83.54% since 1990 while carbon emissions per capita have grown by 9.48%. That may not be as impressive but note two things. That is still a decoupling between economic growth and if you look in the graph, you’ll see that carbon emissions were higher in 2008 to 2019. The curve has flattened and gone down a bit. Global Warming caused by our burning of fossil fuels may be the greatest environmental challenge in recorded history, but we are slowly and steadily turning things around. We are not doing it fast enough to avoid major damage to our eco systems and perhaps civilization, but we are still turning things around. If you have any doubts about global warming / climate change or that we are causing it click here for a summary of the evidence.

The graph shows two graphs. The dark blue one shows GDP growth per capita and the light blue the carbon emissions per capita.
Data source: Data compiled from multiple sources by World Bank (2025); Global Carbon Budget (2024); Population based on various sources (2024). The graph is taken from Our World in Data <<Link-1>>.

China’s Carbon Emissions

One reason the world’s carbon emissions per capita have not been reduced much despite the fact that so many countries have reduced their emissions is that the world’s largest emitter China, has grown their carbon emissions steadily since 1990. Between 1990 and 2023 China’s GDP per capita (and adjusted for inflation) grew by 1,245.28% and their emissions grew by 288.43% per capita. Remember that China has 1.4 billion people so that is a big carbon blast for the world.

However, before you blame China too much remember that China’s carbon emissions per capita is less than that of the United States and that of many other developed countries, and the country with the largest cumulative carbon emissions is the United States. China’s economic growth has been immense, and its immense population of 1.4 billion people explains its huge impact on the world’s carbon emissions.

Fortunately, it now appears that China’s emissions have finally peaked.

To see the other Super Facts click here

Time Dilation Goes Both Ways

Super fact 38 : If two observers are moving compared to each other both will observe the other’s time as being slower. In other words, both observers will observe the other’s clocks as ticking slower. Time slowing down is referred to as Time Dilation. And this post is about how time dilation goes both ways.

A lot of people know that if someone moves very fast his clocks will run slower. That’s relativity. If someone speeds through space in a rocket ship, close to the speed of light his time will slow down. When one hour passes on earth only half an hour may pass in the rocket. What comes as a shock to many people is when they find out that the converse is also true. When one hour passes in the rocket only half an hour will pass on earth.

Clearly that looks like a contradiction, but there is an explanation. I consider this a super fact because it is so strange and almost impossible for people to believe, and yet it is true.

The image shows two clocks side by side. On the left is a wall clock and on the right a wristwatch | Time Dilation Goes Both Ways
The guy on earth says my clock (left) is ticking double as fast as the rocket man’s clock (right). The rocket man say’s my clock (right) is ticking double as fast as the clock on earth (left). Who is right? Surprisingly both of them.

Postulates of Special Relativity

The two postulates of special relativity are:

  • The laws of physics are the same in all inertial frames of reference. An inertial frame is a system that moves at a constant velocity.
  • The speed of light in a vacuum is constant for all observers, regardless of the motion of the light source.

The first postulate is called the principle of relativity and goes all the way back to Galileo Galilei. It means that no experiment can determine whether you are at rest or moving at a constant velocity. The reciprocity of time dilation follows from this postulate. If the time for the rocket man in the example above was ticking at half the speed compared to the time for the guy on earth and they both agreed, then you could tell who was standing still and who was moving from that fact.

The first postulate demands that they disagree. The guy on earth thinks the rocket man’s clock is ticking at half the speed of his own clock, whilst the rocket man think it is earth man’s clock that is going slow. Therefore, you can’t tell who is standing still, which is what the first postulate requires.

The second postulate is the more shocking one and is special to relativity. It was discovered experimentally at the end of the 19th century but was too difficult for scientists to accept at first so various ad hoc explanations were put forth to explain it away, until the theories of relativity were created. I designated this postulate as my super fact #4 and you can read about it here.

The picture shows two people Alan and Amy. Alan is on the ground. Amy is flying by Alan in a rocket speeding left. Both Alan and Amy are pointing lasers to the left | Time Dilation Goes Both Ways
In this picture Amy is traveling past Alan in a rocket. Both have a laser. Both measure the speed of both laser beams to be c = 299,792,458 meters per second. The speed of light is a universal constant.

Time Dilation

In the pictures below I am showing two rocket systems in space, Amy’s rocket and Alan’s rocket. They are travelling at a high speed compared to each other. Each rocket has a light clock that consists of a light beam bouncing up and down between a mirror in the ceiling and a mirror on the floor. The two light clocks are identical, and each bounce corresponds to a microsecond.

Amy is passing Alan at a high speed, and therefore Alan will see Amy’s light clock running slower than his because Amy’s light beam must travel further. Remember, the speed of light is identical for both light clocks (light speed is a universal constant). For those interested I am also deriving the formula for time dilation.

The picture shows two systems, each with a clock consisting of light beams bouncing between mirrors. In this set up Alan is stationary compared to us and therefore his light beam only moves vertically.
Alan and Amy have identical light clocks. We call the time it takes for the light beam to go from the floor to the ceiling (one clock tick) Dt in Amy’s case and Dt’ (reference frame) for Alan. Amy is speeding past Alan towards the left. From Alan’s perspective Amy’s clock is running slower. Using Pythagoras theorem, it is possible to derive the formula for time dilation shown in the lower left corner.

Since Amy moving left is the same as Amy standing still and Alan moving right you can say that Alan is the one moving fast. In this case it is Alan’s light clock that is ticking slower because from this viewpoint it is his light beam that has to travel further. From Amy’s perspective it is Alan’s clock that is going slower.

The picture shows two systems, each with a clock consisting of light beams bouncing between mirrors. In this set up Amy is stationary compared to us and therefore her light beam only moves vertically | Time Dilation Goes Both Ways
It is equally correct to say that Amy is standing still and that it is Alan that is moving fast to the right. This time (pun not intended) it is Alan’s clock that is ticking slower. Dt corresponds to Alan’s clock ticks and Amy’s clock ticks are Dt’.

This seemingly contradictory situation is resolved by the fact that Amy’s and Alan’s perspectives will drift apart as they continue their journey. They will increasingly disagree on whether events are simultaneous or not, and they will disagree in which order events occur. This is another shocking fact, or as I refer to it, super fact. It is strange but it resolves the apparent contradiction of reciprocal time dilation. I am explaining this in greater detail in this post.

The Twin Paradox

But what happens if one of Amy or Alan decides to turn around so that they meet up again. If Amy’s clock runs slower from Alan’s perspective and Alan’s clock runs slower from Amy’s perspective, how can you reconcile that when they meet up again? It turns out that whoever is turning around or accelerating or decelerating to turn back is the one who will have the least time pass. If Amy is the one turning back, then she will age less than Alan. During her acceleration she will see Alan’s clock starting to run faster and faster until he is older her.

Let say Alan’s clock is running half the speed of Amy’s clock from Amy’s perspective and Amy’s clock is running half the speed of Alan’s clock from Alan’s perspective. Let’s also say that Amy traveled to the left for 10 years before turning around.

From Alan’s perspective she would have traveled 20 years before turning around. However, from Amy’s perspective 5 years would have passed on Alan’s clock. As she turns around Alan’s clock will run faster and catch up so that when they meet up again Amy will be aged 20 years, while Alan will be aged 40 years. That is 35 years of catching up for Alan’s clock from Amy’s perspective. Alan’s clock advanced 35 years from Amy’s perspective after Amy turned around. In the end Amy will be the younger one.

The picture shows Amy on the left turning around and Alan on the right. Text explains what happens | Time Dilation Goes Both Ways
Observe that the fast-forward advancement of Alan’s clock from Amy’s perspective happens only while Amy is in the process of turning around (accelerating / decelerating). Further, how fast the fast forward happens depends on the distance as well. Once Amy is traveling at a constant speed again (inertial frame) Alan’s clock will run slower again from Amy’s perspective.

A somewhat halting but OK analogy for the 35 years of catching up that happens on Alan’s clock from Amy’s perspective is when you turn a boat around on a wavy sea. As you are moving in the direction of the waves the waves will hit you much less often (if at all) but after you turn around and move against them the waves will hit your boat very frequently. Alan’s clock will run faster for Amy whilst she is turning around.

Book Recommendations on Relativity

To see the other Super Facts click here

There is strong evidence for the Big Bang

Super fact 37: There is strong evidence for the Big Bang, and we know a lot about how the Universe evolved through time since the Big Bang.

Considering the evidence that has accumulated throughout the years for the Big Bang it is hard to deny it happened. In my experience very few people are aware of this evidence, and they are surprised to find out how much evidence there is and how many details we know about the evolution of the universe. It is easy to believe that scientists are guessing when you don’t know much about the evidence yourself. But they are not guessing. That is why I call this a super fact.

In addition, there’s a lot of misconceptions around the Big Bang as well surprising facts. A few additional things that might surprise people are that the Big Bang was not like an explosion, the Universe did not expand into something. In addition, there might be multiverses and multiple Big Bangs, and there are cyclic models, and so-called eternal inflation. There are things we know and things we don’t know.

The pictures show an expanding Universe starting with quantum fluctuations followed by inflation, then an afterglow light pattern 375,000 after the Big Bang and then the so-called dark ages, the creation of stars and galaxies | There is strong evidence for the Big Bang
This file is in the public domain in the United States because it was solely created by NASA. (from Wikimedia commons

The Expansion of the Universe

It used to be believed that the Universe was static. In 1929 the astronomer Edwin Hubble discovered that the universe was expanding. He made this observation by analyzing the light from distant galaxies and noticing that their light was redshifted. I am going to explain what that means next.

Light emitted from elements, atoms and molecules have light absorption patterns that are unique to the atom/element in question. This is called a light spectrum. This makes it possible to identify the elements in a star and their proportions. Red shifted means that the absorption lines have moved towards red because the frequency of the light has been shifted due to the motion. This is called the doppler effect.

You can notice this phenomenon for the case of sound when an ambulance is coming towards you and then speeding by you. The sound changes. Hubble was using the redshift to the determine that further away the galaxy was the faster it was moving away from us.

The top shows a colorful spectrum from blue to red with absorption lines in black. The bottom portion of the picture shows the same thing expect the black absorption lines have moved a bit to the right.
Visualization of redshifted absorption lines are redshifted due to velocity away from observer. Top lines are for an object at rest and in the bottom picture the object is moving away. Maxmath12, CC0, via Wikimedia Commons. This file is made available under the Creative Commons CC0 1.0 Universal Public Domain Dedication.

A natural explanation for this is that the universe is expanding, and that it once must have been much more compressed, but it is not the only explanation. However, there is more evidence.

The Cosmic Microwave Background Radiation

If you assume that the universe once was much more compact and much hotter than today, particles such as protons, neutrons and electrons would have been free and close together preventing light from freely moving around. However, as the universe kept expanding and cooling these particles eventually should have been able to form atoms allowing light or electromagnetic radiation to freely move around.

Some physicists, Alpher, Herman and Gamow predicted around 1950 that this should have left behind a detectable microwave background radiation. This radiation was detected by chance in 1964 by two physicists, Penzias and Wilson. This radiation had the expected properties and careful study of this Cosmic Microwave Background Radiation (CMBR or CMB) has given us a lot of information about our universe and may give us information about other universes (multiverses).

Its existence is strong evidence that the universe once was very compressed and much hotter, i.e., the Big Bang. An interesting fact is that in old TVs, between the channels (old people will remember this), you had this fuzz, or war of the ants as some people called it, and part of that TV fuzz is the CMBR.

A big sky map with varying colors, yellow, red, green and blue | There is strong evidence for the Big Bang
This is a sky map of the cosmic background radiation from when the universe was around 380,000 years old. It was created with the help of satellite (NASA) measurements. The colors are artificial and show tiny temperature variations. NASA / WMAP Science Team, Public domain, via Wikimedia Commons.

You can watch a 4-minute video about the discovery of the CMBR narrated by Neil DeGrass Tyson on this PBS web page by clicking here.

Abundances of Light Elements

Yet another piece of evidence is the relative abundance of hydrogen and helium compared to heavier elements. The physics at the beginning of the Universe under the Big Bang tells us that initially regular matter should have consisted of 75% hydrogen and 25% helium and hardly anything else, and that is composition the oldest stars had when they were new. In addition, the oldest stars we’ve found appear to have an age just under the 13.8 billion years that we get for our Universe assuming the Big Bang theory (that’s another piece of evidence).

The picture consists of two pie chart graphs representing stars. The left one is a first-generation star with one pie for the 75% hydrogen and one pie for the 25% helium.
The first-generation stars consisted of 75% hydrogen and 25% helium and trace amounts of Lithium. A second or third generation star like our sun is still mostly hydrogen and helium but also many other elements. The rocky planets circling the sun are mainly elements heavier than hydrogen and helium. Image credit NASA, ESA, CSA, STScI

A Very Brief History of Time

So, it all started with a quantum fluctuation. The first 0.000000000000000000000000000000001 seconds is called the inflationary period characterized by super-fast expansion, much faster than the speed of light, as we know it today. At this time the strong nuclear force becomes distinct from the weak nuclear force.

I should point out that during the first 0.0000000000001 seconds the physics laws may not have applied in a normal sense. I should also point out that this was not an explosion. An explosion explodes into something but there was nothing else outside of the universe, so this is more like superfast growth.

At a fraction of a second protons and neutrons form from quarks and after one second neutrinos came into existence and if primordial black holes exist, they were formed at this time too. After two minutes nucleus consisting of neutrons and protons are formed, and the first elements hydrogen and helium formed. After 20 minutes an opaque hot plasma forms, after 100,000 years neutral helium atoms form, and after 375,000 years CMBR is created, etc.

This is just a small sample of everything that we know happened after the Big Bang, based on the known laws of physics. You can read about all the details in books like The First Three Minutes by Steven Weinberg or A Brief History of Time by Stephen Hawking.

vector illustration of up and down quarks in proton and neutron on white background. The proton (left) is a red and blue up quark and a green down quark. The neutron is a red and green down quark and a blue up quark | There is strong evidence for the Big Bang
The proton and neutron each consist of three quarks. They are formed at a fraction of a second after the Big Bang. Asset id: 2333679305 by KRPD.

Pre–Big Bang Cosmology

So, what was there before the Big Bang, if anything? Well, that part is speculation, but there are many good ideas. A popular hypothesis speaks of quantum fluctuations setting off the Big Bang. There are models in which the whole of spacetime is finite, including the Hartle–Hawking no-boundary condition. This means that time itself came into existence with the Big Bang and therefore nothing could have preceded it. This means that the Big Bang could not have been caused or created by anything else, just like a universe that has existed eternally could not have been caused or created by anything else.

In a sense, despite being 13.8 billion years old, the universe in this scenario would have always existed. Because the concept of “always” stops at 13.8 billion years ago. Stephen Hawking used the analogy of the north pole. You can’t go further north from the north pole.

There are other models that include multiverses, for example, eternal inflation, in which universal inflation ends locally here and there in a random fashion, each endpoint leading to a bubble universe, expanding from its own big bang. You can view this model as inflation being the river of time with the various universes popping up like bubbles in the stream.

In another model inflation is due to the movement of branes in string theory and Big Bangs are the result of colliding branes. There are cyclical models, such as Nobel Prize winner Roger Penrose’s Conformal cyclic cosmology in which one universe gives rise to another universe as it dies.

Notice that Pre-Big Bang Cosmology is speculative, but the reality of the Big Bang is backed by strong evidence.

Thousands of universes represented as colorful balls | There is strong evidence for the Big Bang
The surface of a multiverse with a lot of universes 3d rendering Asset id: 2256998119 by Dr. Norbert Lange.

To see the other Super Facts click here