We are living in relatively peaceful times

Superfact 9 : We are living in relatively peaceful times

Despite all the wars going on, the world was filled with a lot more war and violence in the past. Despite the grim news reports we are living in relatively peaceful times.

If I asked you, what are the two biggest wars going on the world today (as of September 2024), you would probably say that it is the Russia / Ukraine war and the Israel / Gaza war. Well, unless you are really well informed, it would come as a surprise that there are more devastating wars going on in the world. For example, there is currently a big civil war going on in Sudan that began in April 2023.

According to the latest issue of the Economist perhaps 150,000 people have been slaughtered in this civil war, and 10 million people have fled their homes, and a famine is emerging that could kill 2.5 million people by the end of the year. This war is likely to destabilize neighboring countries and is sponsored by Russia and Middle Eastern states. It’s likely the biggest crisis in the world but most likely you’ve never heard of it.

Photo by Pixabay on Pexels.com

In the recent Tigray war in Ethiopia between 162,000 and 600,000 people were killed according to Wikipedia. The Tigray war is mostly over, but the point I am trying to make is that you probably have never heard of it. You cannot use the impressions given by the amount of media attention a conflict gets to decide on how severe it is. You’ve got to check the statistics and compare, and the statistics might be quite unintuitive if you have relied on media attention as a metric.

What was the most devastating war in the 19th century?

So, to the next question. What was the most devastating war in the 19th century? If you say the American civil war, you are not correct (estimated 650,000+ deaths). A somewhat better answer is the Napoleonic wars (and estimated 4 million deaths). But none of the answers are correct. The Taiping rebellion in China was the worst. Estimates of the conflict’s death toll range between 20 and 30 million people. Some estimates say 100 million, which would make it the most devastating war in human history.

But did you hear about it? Again, you’ve got to check the statistics, and not rely on your impressions. I am saying this because the claim that deaths from wars and violence have declined over the last few decades is a quite unintuitive claim and yet it is true. That’s why it is a super fact.

Illustration of Chinese warriors preparing outside a fortified city.
Taiping Rebels at Shanghai China in 1853-54. ‘Small Swords’ refers to daggers used by warriors or martial artists in close combat. 19th century print. Stock Illustration ID: 237232531 by Everett Collection.

As this article in the Our World In Data states “While every war is a tragedy, the data suggests that fewer people died in conflicts in recent decades than in most of the 20th century. Countries have also built more peaceful relations between and within them.”. It should be noted that even though killing has never been as efficient as it is in the present, in the past a lot of civilians died from famine and disease resulting from the wars.

For example, the Spanish flu following World War I killed between 25 to 50 million people. I should say those numbers are typically not included in the deaths from World War I. The number of deaths from World War I are estimated at 20 million. 10 million combatants and 10 million civilians.
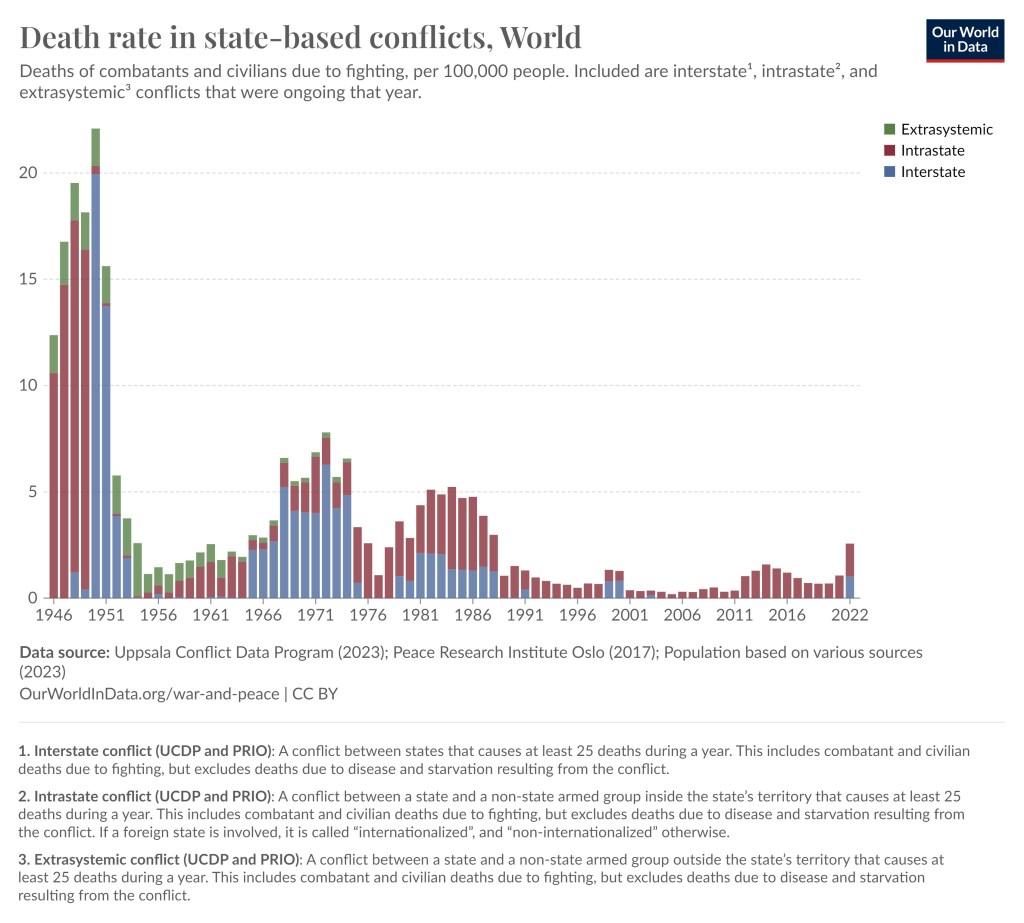
The graph is in histogram format with the biggest bins 1946 to 1952, then a couple of more upticks with smaller bins in more recent times.
Death rate from wars since 1946. The uptick in 2022 is largely due to the Ethiopian Tigray war with 162,000–600,000 killed and the invasion of Ukraine,  which US and BBC estimates at more than 200,000 deaths (but estimates from most other sources are less).

One problem with this kind of statistics is that the estimates vary, especially with respect to civilian causalities. In addition, very big wars lasting a few years create very bumpy graphs with large spikes making it harder to identify trends.

However, by listing estimated war deaths of the biggest wars, genocides and democides since the 1800’s you can see that deaths from this type of violence have overall been reduced over the last few decades. A note, democides are mass killings of civilians but are not necessarily directed at an ethnic group (democide include genocide).

The links below are mostly from Encyclopedia Britannica, but also from Wikipedia, the Census bureau, and a couple of other sources.

As I said, the numbers are estimates and not hard data, especially with respect to civilian casualties. However, you can see a trend going from several conflicts with numbers in the tens of millions before 1950, then numbers in millions until 2000/2007 and then during the last couple of decades the numbers have been less than a million. This does not cover homicide rates but even in that case we can see a reduction even though it is less distinct.
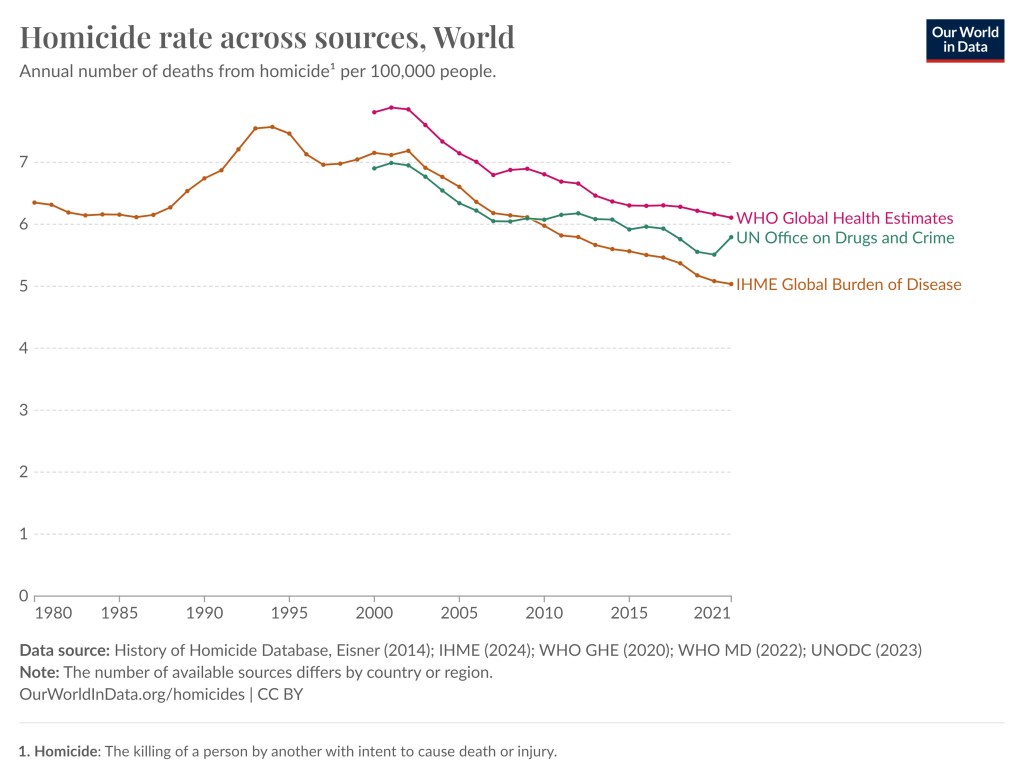
The graph features three curves (1) from WHO global health estimates (2) UN office on drugs and crime (3) IHME Global Burden of Disease.
In this graph we can see that homicide rate worldwide has been reduced somewhat since the mid 1990’s. This graph is also taken from the Our World in Data website and they in turn used various databases from UN, WHO, etc.

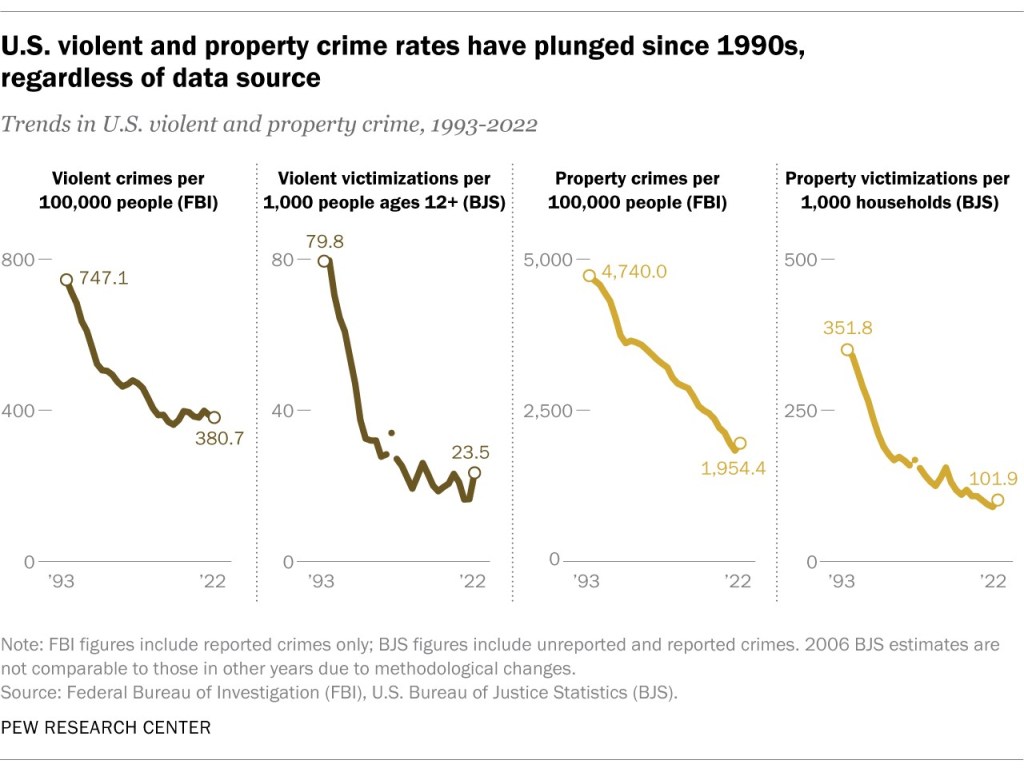
Finally, you can also take a look at this post “US Violent Crime Nearly Cut in Half Since 1990” and this article from pew research that includes a graph showing that the US violent crime rate has nearly halved since the 1990’s.

Also remember that in the past there were a lot less people on earth, so relatively speaking a million deaths was a lot bigger number back then. In summary, despite all the wars going on, our world is less violent than it used to be.


To see the other Super Facts click here


Super Facts on Facebook

I created a Facebook page for my super facts or Superfactful blog. The purpose of this post is partially to test if my posts here are showing up on my super fact Facebook page, but it is also to invite you all to follow my Superfactful Facebook page if you wish, or my Leonberger book Facebook page, or send me a friend request to my personal Facebook. I am putting the links to all three below.

The top of the photo feature the Grand Teton Mountains. The bottom has examples of super facts | Super Facts on Facebook
Cover photo for my new Facebook page. Click on the photo to visit my new Facebook page.

Note: I just checked and it is showing up on my new Facebook page


To see the Super Facts click here


A Tarantula Hawk Encounter

This is not one of my super facts posts but I think it is interesting information about a quite frightening insect that I had never heard of before I encountered it- a tarantula hawk encounter.

When my daughter was 5-7 years old, she was part of what you can perhaps call a pre-girl-scout organization. It was called Indian Princesses. It later changed its name to Adventure Princesses. They had meetings where they learned things, and they went camping as a group with their dads or moms. There were bonfires, grilling, nature, fishing, adventures, jumping in mud, riding horses, and staying up late at night.

My daughter Rachel had colorful native American looking face paint | A Tarantula Hawk Encounter
My daughter Rachel camping at Camp Classen in Oklahoma. We are standing around a bonfire at night.

One time the Indian Princesses went camping in Camp Classen in Oklahoma. Since we live in North Texas it was not far away. One morning, as we were standing there talking and preparing breakfast, we saw a big black insect landing on the ground.

As we looked closer, we saw that it had landed on a Tarantula. It stung the tarantula, which stopped moving. Then it dragged the Tarantula through the grass about 100-150 feet and then under the girls’ bathroom. As we stood around the Tarantula and the big black insect, we saw that the insect had reddish wings and the body shape of a wasp or an ant. We did not know what it was. This was the year 2005 or possibly 2006 and cellphones with internet were not common.

A black Tarantula Hawk Wasp holding onto a Tarantula Spider. They are sitting in the green grass.
This is a photo of the Tarantula Hawk that we saw. It is dragging a Tarantula that it had just stung. It is our photo and maybe not a great photo.

My daughter ran to get her jewelry box from her cabin. When she came back, she handed it to me and said, “Dad put them in here”. Another dad standing nearby started laughing and said, “yes Thomas I want to see you put them in the box.” It was quite lucky that I didn’t because the big black insect with reddish wings was what is called a Tarantula Hawk, a type of wasp, which allegedly has the most painful sting of any insect in the northern hemisphere. There is an insect with a worse sting in South America.

A big black Tarantula Hawk wasp sitting on a flower.
A Tarantula Hawk Wasp feeding on some flowers. Stock Photo ID: 2018945009 by Rix Pix Photography

The Tarantula Hawk is a wasp that feeds on nectar but the female Tarantula Hawk stings and kills Tarantulas to feed its larvae.  It stings the Tarantula between the legs, paralyzing it, and then drags the prey to a specially prepared burrow, where a single egg is laid on the spider’s abdomen, and the burrow entrance is covered.

According to this article one researcher described the tarantula hawk’s sting this way: “To me, the pain is like an electric wand that hits you, inducing an immediate, excruciating pain that simply shuts down one’s ability to do anything, except, perhaps, scream.

Below is a youTube video about the Tarantula Hawk.

Have you ever encountered a Tarantula Hawk or another scary wasp or insect?


To see the Super Facts click here

Electrification

This is not one of the super fact posts. It is just a post related to an interest of mine that is informational. I volunteer for an organization called Citizens Climate Lobby, or CCL. CCL is a bipartisan organization that works with both Democrats and Republicans to create the political will for climate solutions. During the month of August CCL is promoting what is called electrification. Clean energy is taking the world with storm, but energy / electric power is not the only source of carbon emissions / greenhouse gases.

Take for example, transportation. Most cars still use gasoline and to move towards a fossil fuel free future we must move towards using transportation that uses less fossil fuels such as EV cars. We need to electrify transportation. Another aspect of electrification is replacing gas stoves with induction stoves, installing solar panels, as well as lowering the energy use of your house.

A picture of houses by a lake | Electrification
Lowering the energy consumption of your house lowers your emissions. Photo by Frans van Heerden on Pexels.com

EV Cars

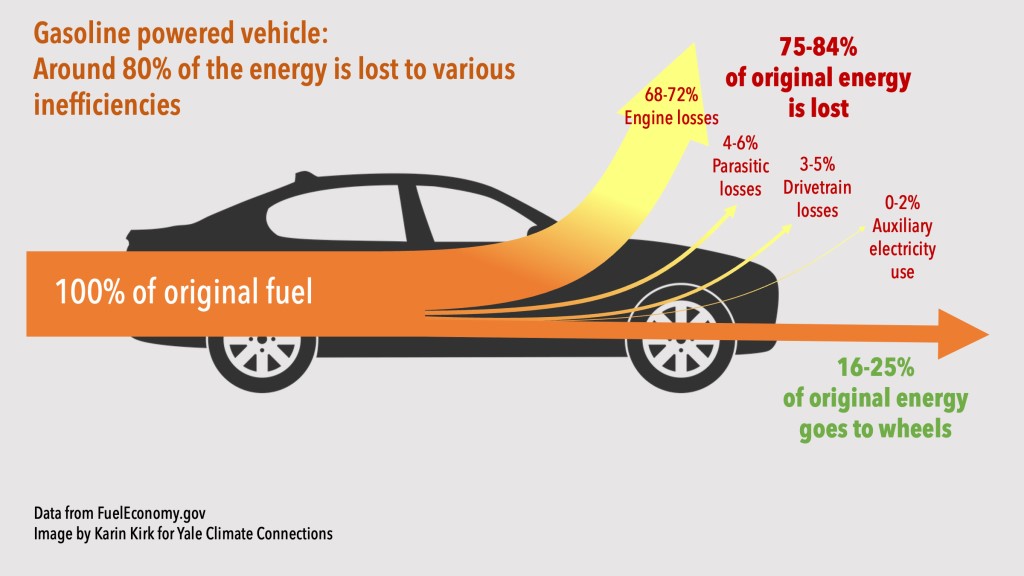
At least here in Texas it is quite common to believe that EV cars do not reduce emissions. After all EV cars use electricity from the dirty grid, right? Often this is said to environmentalists and people who care about fossil fuels emissions as if they don’t understand that the electricity for EV cars typically comes from the dirty grid. However, they do know that. In fact, they know a little bit more. EV cars are much more efficient than Internal Combustion Engine cars , or ICE, and therefore the emissions caused by EVs via the electrical grid, even a coal powered grid, is significantly less per mile. In fact, replacing gasoline-powered cars with EVs saves energy, regardless of the energy source used to recharge the EVs. For an ICE 16-25% of the original energy goes to the wheels whereas for an EV 87-91% of the original energy goes to the wheels.

Image showing an ICE car and its various losses | Electrification
16-25% of original energy goes to the wheels. Data from FuelEconomy.gov, Image by Karin Kirk for Yale Connections.
Image showing an EV car and its various losses | Electrification
87-91% of original energy goes to the wheels. Data from FuelEconomy.gov, Image by Karin Kirk for Yale Connections.

On the other hand, it takes more energy to manufacture an EV battery for an EV car than it does to produce a combustion engine. So, the production of an electric vehicle does emit more carbon than a petrol car. However, the lower emissions resulting from driving an EV means that an electric car quickly pays back its debt, so to speak. It is typically paid back within two years.

According to Hannah Richie at Our World in Data the statistics show that switching from an average ICE to an equally sized EV will save 1.2 tons of carbon emissions per person and year. That is a lot considering that the average carbon footprint per year is 4 tons worldwide and 14.4 tons per year for an American. Hannah Richie at Our World in Data also states that other environmental damages related to EVs such as mining for minerals are less than mining and extraction for fossil fuel cars, and she claims that the price of lithium-ion batteries has fallen by 98% over the last three decades.

Blonde woman pumping gas.
Photo by Andersen EV on Pexels.com

EVs are becoming increasingly common. According to Our World in Data in 2022, 88% of all cars sold in Norway were EVs and 54% of all cars in Sweden were EVs. The United States is lagging a bit at 7.5% but there is a tax credit $7,000.00 for new EVs and a $4,000.00 tax credit for buying used EVs. I should add that we have not yet bought an EV because after I took early retirement, I did not need a car. We just share my wife’s hybrid, which we hardly ever drive.

Induction Stoves

We bought an electric stove, an induction stove, a couple of years ago when our previous stove stopped working. They come with an $840.00 rebate. I’ve read that professional chefs prefer gas stoves. However, our induction stove provides everything we need for our cooking needs and my beer brewing needs and it is easier to clean. If you are a professional chef you may want to be able switch the high heat on and off quicker, but we are not professional chefs even though the food we cook is delicious.

Another downside of an induction stove is that if the power goes out you can’t cook, but that has not been a problem for us. Considering that we get our electricity from a power company, Green Mountain Energy, that utilizes renewable energy, wind and solar, you can claim that our stove is 100% fossil fuel free.

One cooking plate is red hot. The stove itself is made of granite.
Our induction stove with the lights in the kitchen turned off.

Heat Pumps

Air source heat pumps, which are the most common type of heat pumps, are a great, energy efficient choice for heating your home and water and as well as being low maintenance, they can help to cut your heating costs and lower your carbon footprint. An air source heat pump absorbs heat from the air outside a building and releases it inside. It uses the same vapor-compression refrigeration process and much the same equipment as an air conditioner, but in the opposite direction.

Air-to-air heat pumps provide hot or cold air directly to rooms. Heat pumps are the main way to phase furnaces but are also typically more efficient than other types of heaters and air conditioners and thus they reduce greenhouse gas emissions. There is an up to $8,000.00 upfront discount for heat pumps and a 30% tax credit up to $2,000.00. I should say we do not have a heat pump.

Grey heat pump standing towards the wall of an old red brick house.
Air heat pump installed on the exterior facade of the old house. Sustainable heating solutions for old construction. Stock Photo ID: 2349325553 by Snapshot freddy.

Rooftop solar

Another great thing that we have been thinking about but do not have yet is rooftop solar. Rooftop solar power system, or rooftop photo voltaic systems, consist of electricity-generating solar panels mounted on the rooftop of a residential or commercial building or structure. Residential rooftop solar power systems typically feature a capacity of about 5–20 kilowatts.

The average American household uses 1.2 kilowatts on average. Most rooftop solar systems are connected to the grid and can feed the extra power into the grid for compensation. I should add this is not entirely without difficulty. There are also hybrid systems which include any combination of wind turbines, diesel generators, and batteries for electricity on demand. There is a 30% tax credit for rooftop solar.

Solar panels being installed | Electrification
Photo by Kindel Media on Pexels.com

Miscellaneous Energy Savings

Saving energy is not exactly the same thing as electrification but it is a related topic. If you electrify your home and also reduce your energy needs, you are reducing emissions.

A few years ago, we changed the insulation in our house to reduce our energy needs and our electric bill. It made a difference. We also did weatherstripping, installed three pane windows and high security doors, that were well-insulated and reduced heat-loss. We received significant tax credits for doing this. I don’t remember how much, but it was several thousand dollars. I can add that you get a $150 tax credit for a home energy audit.

What do you think about electrification and energy savings?

Do you have additional ideas for electrification and energy savings?


To see the Super Facts click here


US Violent Crime Nearly Cut in Half Since 1990

Superfact 8 : US Violent Crime Nearly Cut in Half Since 1990

Despite all the news reports about rampant crime, the US violent crime rate has fallen to half of what it was in the early 1990’s.

I’ve known for a while that violent crime in the US has been going down substantially since 1990. However, quite often when I mention this people refuse to believe it. When I visit NextDoor, the hyperlocal social networking service for neighborhoods, I see people complaining about rising crime, and especially rising violent crime. The news media and the newspapers are filled with violent crime stories, murders, mass shootings, assaults, rape, and robberies. It seems to be getting worse and worse. We are living in scary times, aren’t we?

The Better Angels of our Nature

A couple of years ago I bought a book by Steven Pinker with the title The Better Angels of our Nature, why violence has declined, which contradicted the violence is getting worse narrative. In the book he claims that violence is trending down worldwide and that includes US violent crime.

In 1987 I received a Christmas present from the parents of a fellow student whom I had been tutoring. I was an exchange student to the United States from Sweden at the time. The Christmas present in question was the World Almanac of 1987. I loved it and ever since I’ve bought the World Almanac every year. If you open the pages for crime statistics in the United States in the World Almanac you see the same thing, violent crime in the US is declining.

The colorful front page of The World Almanac and Book of Facts 2023. It features photographs of events in 2023 as well as a picture of the northern hemisphere of Earth.
The World Almanac and Book of Facts 2023.

Statistics

Below is what the World Almanac 2023 says about the violent crime rate per 100,000 residents in the United States (page 114). The data sources were : Federal Bureau of Investigation, U.S. Department of Justice, Uniform Crime Reporting Program, Crime in the United States 2020. I also included property crimes in the last column to show that non-violent crimes have declined as well.

YearAll violent crimeMurder and nonnegligent manslaughterRapeRobberyAggravated assaultAll property crime (non-violent)
1990729.69.441.1256.3422.95,073.1
1995684.58.237.1220.9418.34,590.5
2000506.55.532.0145.0324.03,618.3
2005469.05.631.8140.8290.83,431.5
2008458.65.429.8145.9277.53,214.6
2011387.14.727.0113.9241.52,905.4
2014361.64.426.6101.3229.22,574.1
2016386.65.430.0102.9248.32,451.6
2017383.85.330.798.6249.22,362.9
2018370.45.031.086.1248.22,209.8
2019368.65.131.481.8250.42,130.6
2020387.86.527.673.9279.71,958.2

The graph below is taken from this article from the Pew Research Center tells the same story. The graph. It shows that the US violent crime rate has nearly halved since the 1990’s. There is a slight uptick in crime for the years 2020 and 2021 but according to this PBS article the downward trend has continued in 2022 and 2023.

The first graph shows that violent crime per 100,000 people (FBI) has gone from 747.1 in 1990 to 380.7 in 2022. The next three graphs show the same trends | US Violent Crime Nearly Cut in Half Since 1990
The four graphs show that both violent crime and property crime has declined since 1990. Click on the picture to see the Pew Research article it is taken from.

Since this is a surprising fact that some does not even want to acknowledge (in my experience) I consider this a super fact.

Do you feel it is hard to believe that violent crime in the US has been declining over the last few decades?


To see the other Super Facts click here