Millions of species have been documented

Super fact 139 : 2.17 million species have been described but it is possible that as many as 20% of those are duplicates. However, most species are likely undiscovered.
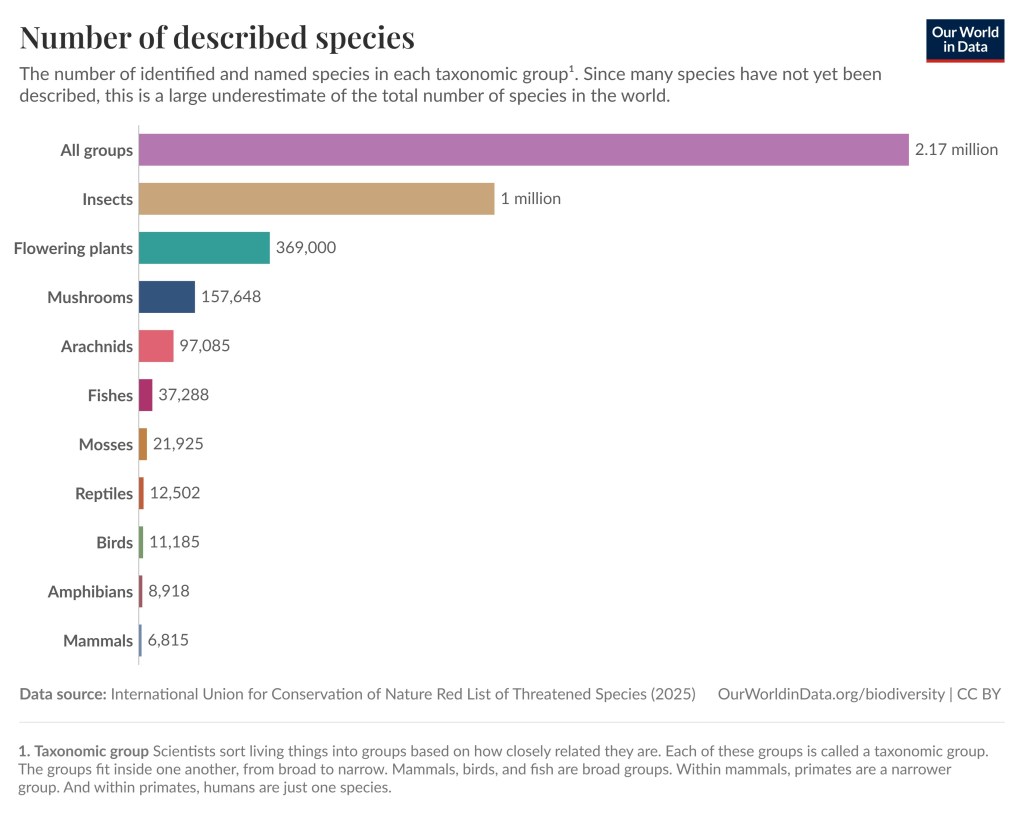
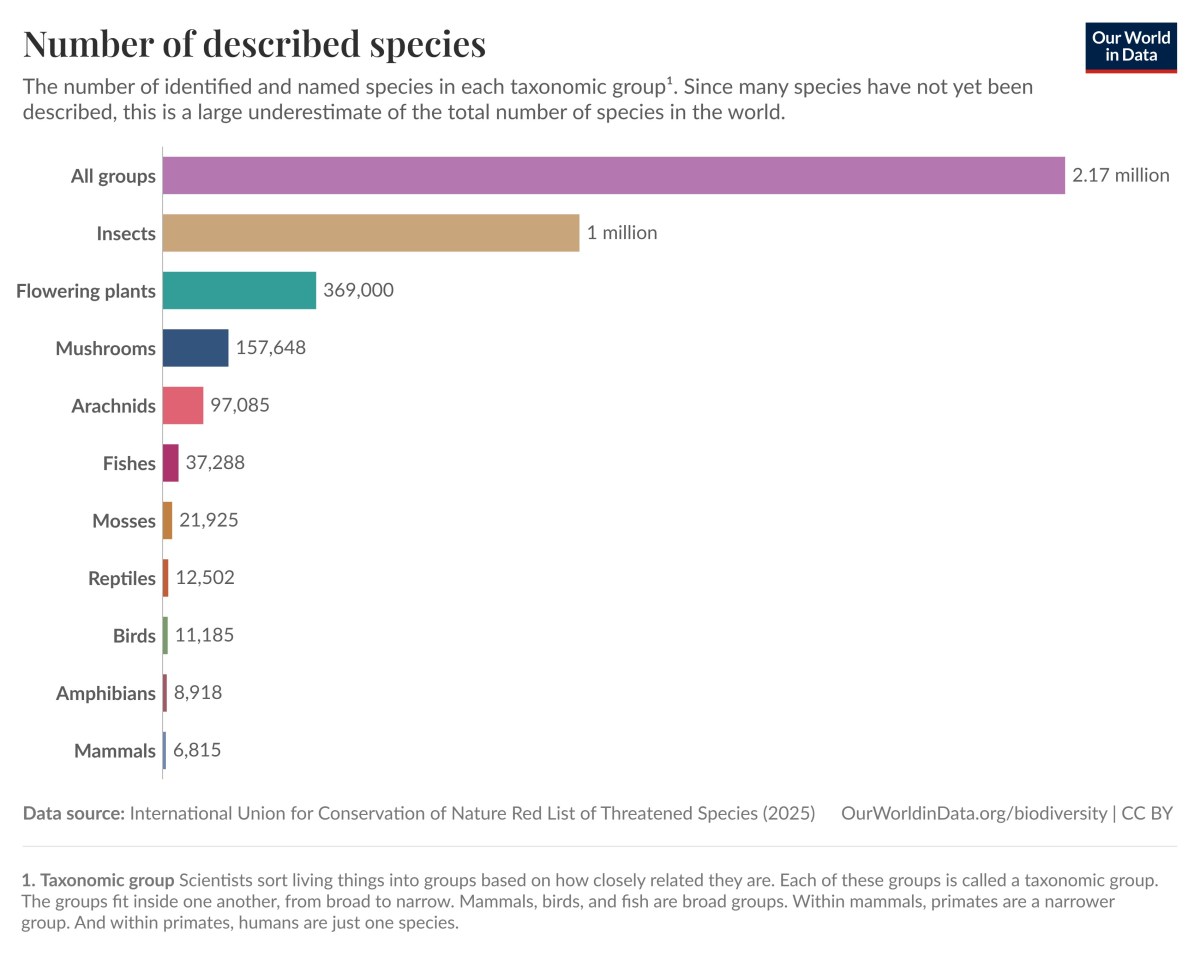
This bar graph feature ten taxonomic groups; Insects (1 million species), Flowering plants (369,000 species), Mushrooms (157,648 species), Arachnids (97,085 species), Fishes (37,288 species), Mosses (21,925 species), Reptiles (12,502 species), Birds (11,185 species), Amphibians (8,918 species), Mammals (6,815 species). | Millions of species have been documented
The number of identified and named species in each taxonomic group. Since many species have not yet been described, this is a large underestimate of the total number of species in the world. Note about Taxonomic group: Scientists sort living things into groups based on how closely related they are. Each of these groups is called a taxonomic group. The groups fit inside one another, from broad to narrow. Mammals, birds and fish are broad groups. Within mammals, primates are a narrower group. And within primates, humans are just one species. Data source: International Union for Conservation of Nature Red List of Threatened species (2025).  OurWorldinData.org/biodiversity | CC BY

As mentioned, a couple of million species have been named and identified. For a species to be formally described, it’s description must be published in a scientific journal or book. Considering this it is quite impressive that we’ve described millions of species, mostly insects and plants. However, according to science magazine the most likely number of species is in the range of 5 to 10 million eukaryotes. Eukaryotes are organisms consisting of complex cells with a membrane wrapped in nucleus and other internal compartments, which exclude viruses and bacteria.
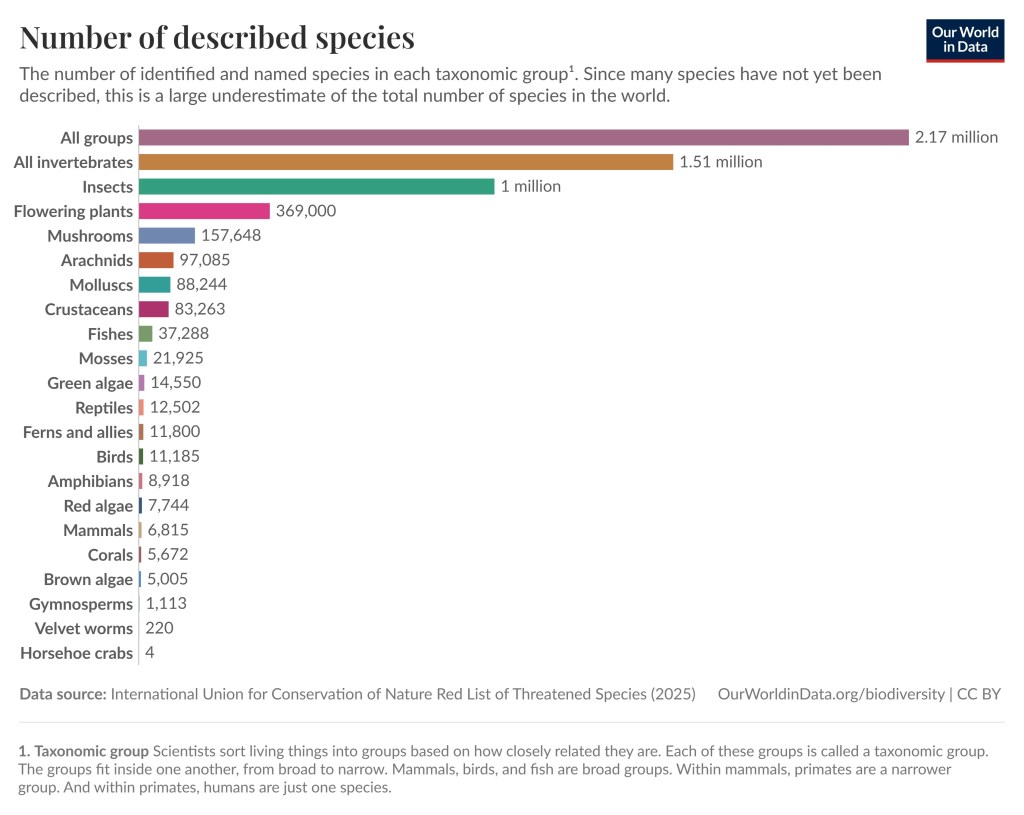
This bar graph feature ten taxonomic groups; Insects (1 million species), Flowering plants (369,000 species), Mushrooms (157,648 species), Arachnids (97,085 species), Molluscs (88,244 species), Crustaceans (83,263 species), Fishes (37,288 species), Mosses (21,925 species), Green algae (14,550 species), Reptiles (12,502 species), Ferns and allies (11,800 species), Birds (11,185 species), Amphibians (8,918 species), Red algae (7,744 species), Mammals (6,815 species), Corals (5,672 species), Brown algae (5,005 species), Gymnosperms (1,113 species), Velvet worms (220 species), Horshoe crabs (4 species), All invertebrates (1.51 million species), All groups (2.17 million species).
This graph includes a more complete set of taxonomic groups. Data source: International Union for Conservation of Nature Red List of Threatened species (2025).  OurWorldinData.org/biodiversity | CC BY

The fact that we have succeeded in describing two million species is impressive and surprising. That is a lot of work. The fact that there are likely millions of more species we haven’t found is equally surprising. There are surprisingly many species and unless you already knew this, this is surprising and perhaps mind-blowing information, and therefore a super fact.

Challenges in Defining a Species

Species is a unit of biological classification and it is the lowest taxonomic rank below genus. Species is often defined using the Biological Species Concept, which is defined as populations whose members can interbreed and produce fertile offspring, and are reproductively isolated from other groups. However, it is complicated. Asexual organisms, hybrids and ring species, and extinct species complicate things. Therefore, other ways of defining species exist.
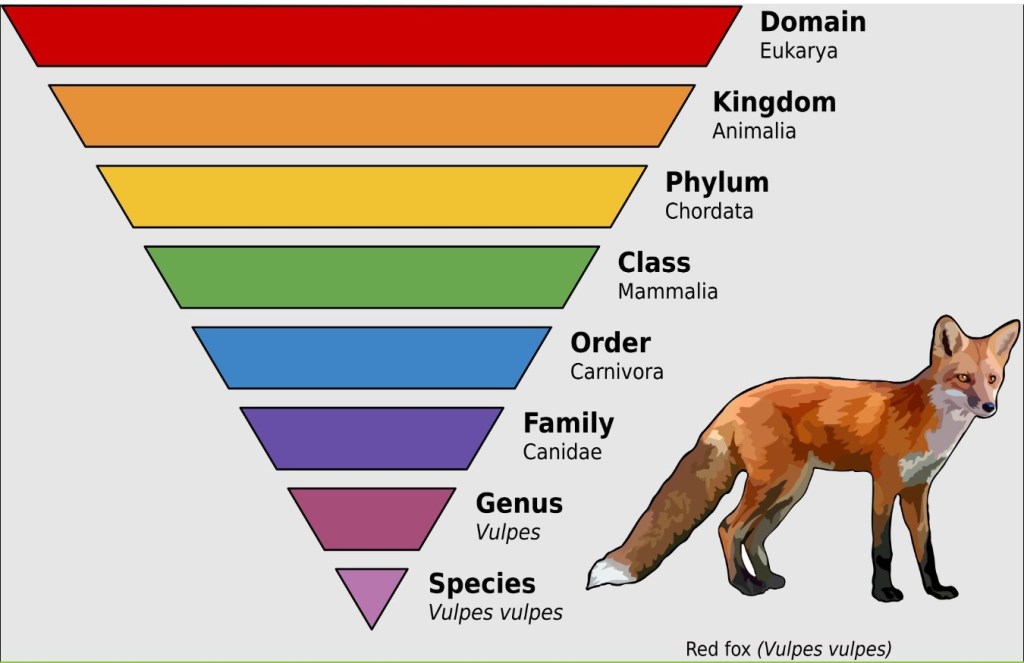
The picture shows a Red Fox with an upside down pyramid showing the different taxonomic ranks. Domain is at the top (Eukarya), Kingdom (Animalia), Phylym (Chordata), Class (Mammalia), Order (Carnivora), Family (Canidae), Genus (Vulpes), Species (Vulpes vulpes, which is the red fox). | Millions of species have been documented
The major ranks: domain, kingdom, phylum, class, order, family, genus, and species, applied to the red fox, Vulpes vulpes. Many classifications based on genetic analysis require more than these eight ranks, not all of which have distinct names. Annina Breen, CC BY-SA 4.0 <https://creativecommons.org/licenses/by-sa/4.0&gt;, via Wikimedia Commons.

To define a species, you can also use genetic similarity, unique ecological niches, unique common ancestors, distinct physical traits, size, shape, and structural features. In other words, species concept is not simple and defining a species requires expertise. This makes it even more impressive that we have identified and described two million species.

I should add that there are also subspecies. A subspecies is a distinct population within a species that lives in a specific geographic region and differs in physical traits from other populations of the same species, while still being able to interbreed with them. An example is the dog which is a subspecies of the gray wolf.

Ring Species

As mentioned, a common definition of species is that two animals belong to the same species if they can interbreed in nature and produce viable, fertile offspring. As I pointed out it is not always that simple. An animal A may be able to successfully interbreed with an animal B, and that animal B may be able to successfully interbreed with an animal C, but animal A and C cannot interbreed. Animal A could be said to be a different species relative to animal C, but animal B could be said to be the same species as both animal A & C using the definition above.

A great geography related example of this is ring species. In a ring species, gene flow occurs between neighboring populations of a species, but at the ends of the ring the populations don’t interbreed.
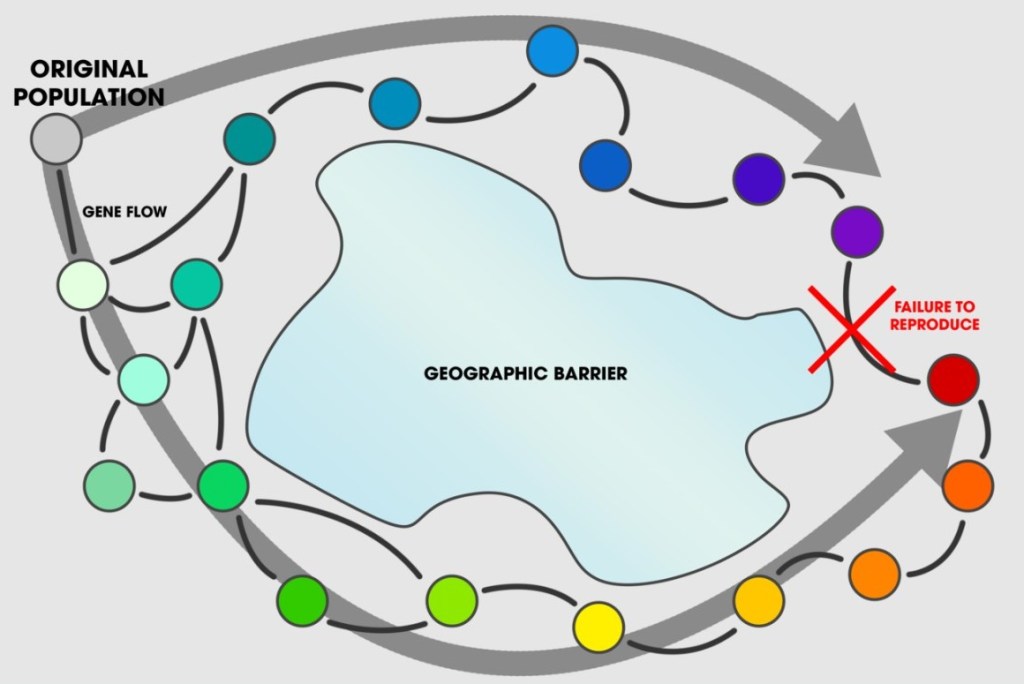
The picture depicts different subspecies as little colored circles centered around a big lake. The color changes a little bit at the time. All the circles next to each other can interbreed.
Illustration of ring species, an example of how speciation can be relative. All the circles next to each other can interbreed but at the end it no longer works. Andrew Z. Colvin, CC BY-SA 4.0 <https://creativecommons.org/licenses/by-sa/4.0&gt;, via Wikimedia Commons

Other Super Facts Related to Wildlife

A couple of interesting super facts related to species and wildlife are :

  • (70) The Wild Mammal Biomass Has Substantially Declined – click to visit
  • (71) The Extinction Rate is Much Higher Than the Natural Baseline Rate – click to visit

The first one is concerning the fact that we humans and our domesticated animals, cattle etc., have largely replaced wild animals and wild mammals. As the total biomass has increased the wild mammal biomass has decreased. The second super fact is about the current extinction rate being perhaps thousands of times higher than what is typical. A mass extinction event is often defined as when 75% of all species, or more, goes extinct within 2 million years. 200 years is only 0.01% of 2 million years so modern society has existed for an extremely short time. It is just a tiny blip on geological scales. So, even with an extinction rate thousands of times above normal, we haven’t gotten very far yet. Luckily, it looks like we might be turning things around, so perhaps we won’t be like the asteroid that exterminated the non-Avian dinosaurs.
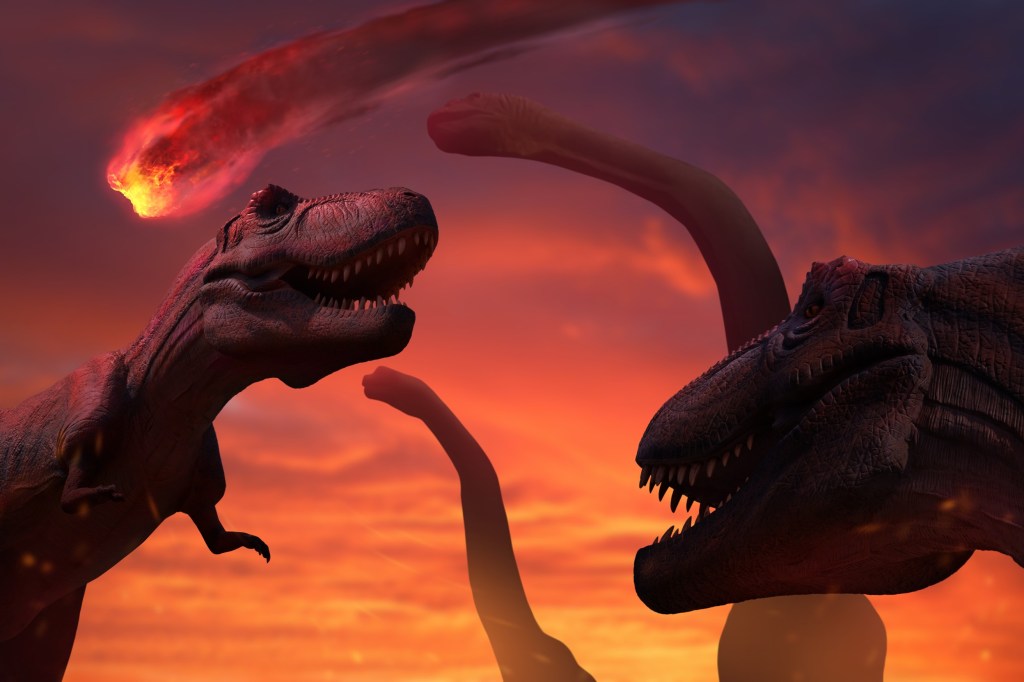
3D illustration showing two carnivorous dinosaurs and two large herbivores looking up at a burning asteroid. | Millions of species have been documented
Extinction of the dinosaurs when a large asteroid hits earth 66 million years ago. It was the last mass extinction event. Asset id: 2196200279 by funstarts33


To see the other Super Facts click here

Deforestation peaked back in the 1980s

Super fact 45 : Deforestation peaked back in the 1980s, meaning that is when it was worst. Deforestation has not stopped but the rate of deforestation has slowed as a result of government policies, corporate initiatives, and international agreements.

The rate of global deforestation has slowed significantly since the 1980s. Overall we are still losing forests. We had a 47-million-hectare loss of forest in the last decade, which is very bad, but that is better than the 151-million-hectare loss of forest in the 1980s. For temperate forests we have succeeded in reversing deforestation and temperate forests are now gaining forest. To read more about how government policies, corporate initiatives, and international agreements have slowed the rate of deforestation you can click here, or here, or here.

Aerial photo of a forest. The upper left side shows lot of green trees whilst the lower right side is brown
Amazon rainforest illegal deforestation landscape. Aerial view of trees cut and burned to make land for agriculture and cattle pasture in Amazonas, Brazil. Asset id: 2471967219 by PARALAXIS

This is a super fact because we get a lot of bad news about deforestation, and we should, it is still a big problem. However, we are making progress and because of our negativity bias as well as that of the media, we tend to miss the story about the progress. Therefore, the fact that we are making progress comes as a surprise to many people.

The graphs show that during the 1700’s and the first half of the 1800’s the loss of forests was 19 million acres per decade. From the mid-1800’s to 1920 it was roughly 30 million acres per decade and from the 1920 and on it was 115 million acres per decade until the 1980s and the first half of the 1990s when it was 151 million acres per decade. Since then, it has fallen and in the last decade forest loss was 47 million acres | Proof that deforestation peaked back in the 1980s
Decadal losses in global forest over the last three centuries. Decadal forest loss is measured as the average net loss every ten years, in hectares. This deforestation minus increases in forest area through afforestation. There is no single dataset that applies consistent or transparent methodology for deforestation over centuries. Two different datasets are therefore shown: these still shown the overall development and transition of forestation from temperate to tropical areas, but magnitudes should not be combined at the crossover point. Data sources: Pre-1995 data from Williams (2006). The second series is based on data from UN FAO Global Forest Resources Assessments. The graph comes from Our World in Data – Research and data to make progress against the world’s largest problems.

Peak Agricultural Land

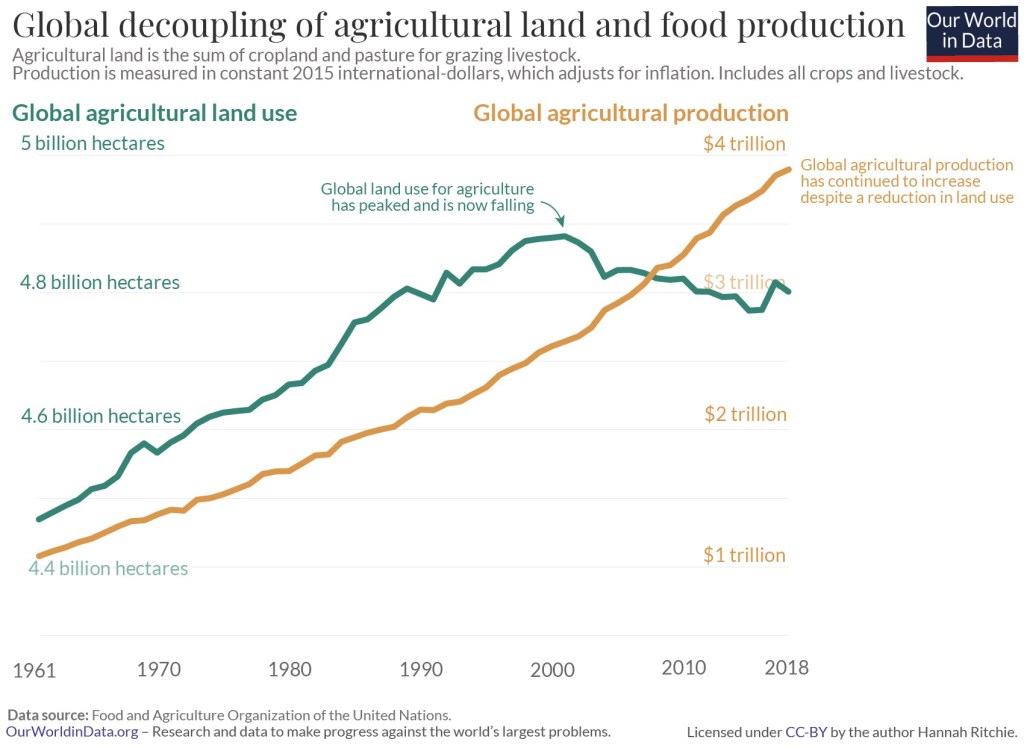
There is one aspect to this story which both explains part of the reduction in deforestation but also provides additional hope for the future and that is that even though the world produces more food than ever, the amount of land we use for doing that is falling. Global land use for agriculture has peaked and is now falling. There has been a global decoupling of agricultural land and food production. I should explain that agricultural land is the total amount of arable land that is used to grow crops, and pasture used to raise livestock. That global land use for agriculture has peaked is illustrated in the graph below.

The graph shows a green line chart representing global agricultural land use and an orange line chart representing global agricultural production. The orange line graph keeps rising but the green line chart peaks and then starts going down | Evidence that deforestation peaked back in the 1980s
Global decoupling of agricultural land and food production. Agricultural land is the sum of cropland and pasture for grazing livestock. Production is measured in constant 2015 international dollars, which adjusts for inflation. Includes all crops and livestock. Data source: Food and Agriculture Organization of the United Nations. Our World in Data – Research and data to make progress against the World’s largest problems.

There are more trees now than 35 years ago (there’s a catch)

Another related good news story is that there are more trees in the world today than there were 35 years ago. A lot of the losses of forest in tropical areas have been compensated for by gains in Europe, North America and Asia. For example, tree planting programs in places like China have added a lot of trees as well as forests. In addition to tree planting programs climate change resulting in northern latitudes warming has resulted in temperate forests expanding.

However, this story is not as good as it sounds. There is a huge catch and that is that there is an important distinction between tree cover and forest cover. Tree cover refers to the total area covered by trees, while forest cover specifically refers to areas where trees form a forest ecosystem. Tree cover has increased but as you can guess from the graph above depicting global deforestation, the forest cover continues to decrease.

In addition, a lot of trees were planted for industrial timber plantations, mature oil palm estates and other specifically planted forests. These add to the global tree cover but not necessarily to biodiversity. Not all tree planting is equal.

So even though having more trees compared to 35 years ago is a good thing, it may not be as great as it sounds and does not contradict the fact that deforestation continues. This is important to point out because there are those who attempt to use the fact that we now have more trees to make the case that the talk about deforestation is a hoax. Don’t fall for that.

Summary

The good news is that even though deforestation is still happening the rate of it has slowed down. It peaked in the 1980s. This slowdown is largely due to government policies, corporate initiatives, and international agreements. An additional circumstance that aids in slowing deforestation is that the amount of land we use for agriculture is falling and we have passed peak land use for agriculture. Another positive situation is that we now have more trees than 35 years ago.

However, it is important to point out that does not mean that deforestation has been reversed. Tree cover and forest cover are not the same thing. The benefit of this is limited even though it is still a good thing to have more trees.

Environmental Success Stories

Aside from the success in reducing the rate of deforestation there is additional surprising, as well as good news regarding the environment.


To see the other Super Facts click here