The Unfolding Solar Power Boom

Superfact 117: The share of electricity generated from Solar Power in the world has grown from essentially 0% in the year 2000, 0.15% in 2010, to 3.19% in 2020, and to 8.75% in 2025. Both wind and solar energy are expanding fast around the world, but solar energy is a strong latecomer to the energy scene.

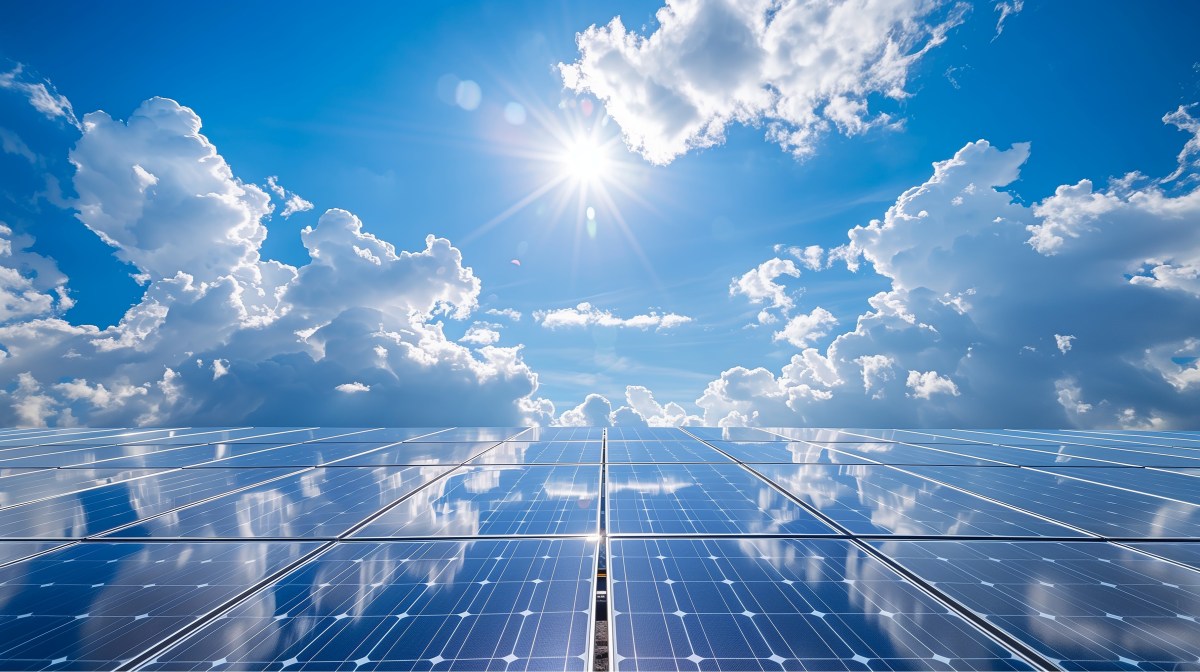
Solar energy panel harvesting in direct sunlight against a backdrop of clear blue skies capturing the essence of sustainable power generation and eco-friendly technology | The Unfolding Solar Power Boom
Solar energy panel. Shutterstock asset id: 2459435149 by Nordic Studio.

In the year 2000 less than 0.01% of the world’s electricity was generated by solar. In 2005 it was 0.02%, in 2010 it was 0.15%, in 2015 it was 1.07%, 2020 it was 3.19%, in 2025 it was 8.75%. Can you guess what will it will be in 2030? The United States may be behind the rest of the world with respect to wind power and EVs, but it closely follows the rest of world when it is about solar. You can play around with the graph below and select different countries by clicking here.
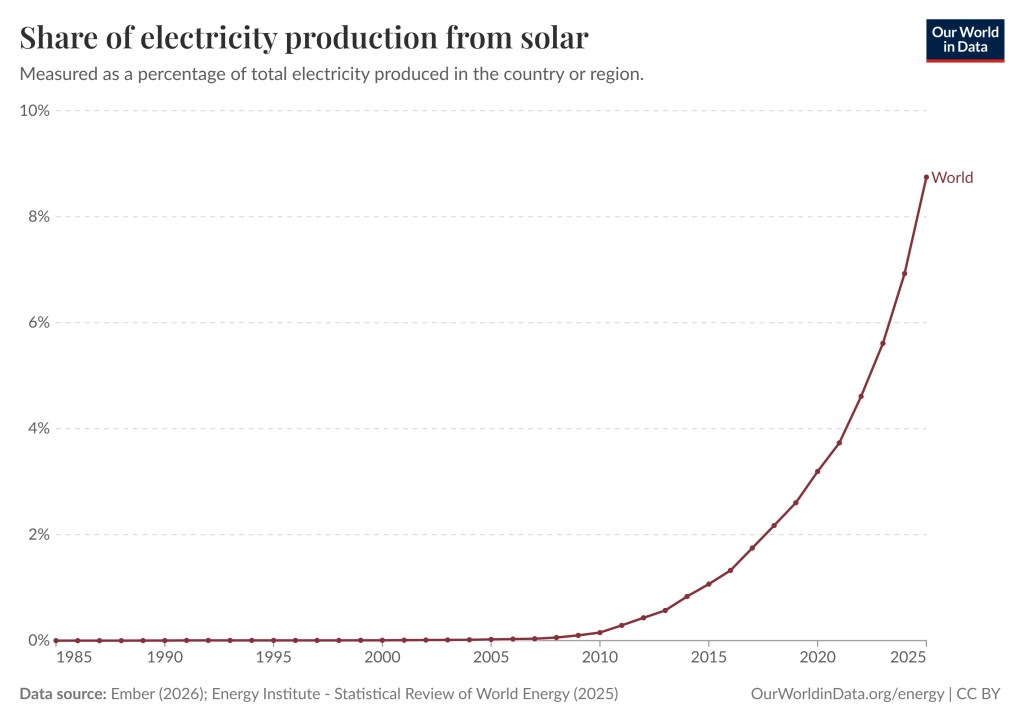
The graphs shows that the share of electricity from Solar remained nearly zero until the very recent sharp increase.
Share of electricity from Solar. Measured as a percentage of total electricity produced in the country or region. Data source: Ember (2026): Energy Institute – Statistical Review of World Energy (2025)    OurWorldinData.org/energy | CC BY
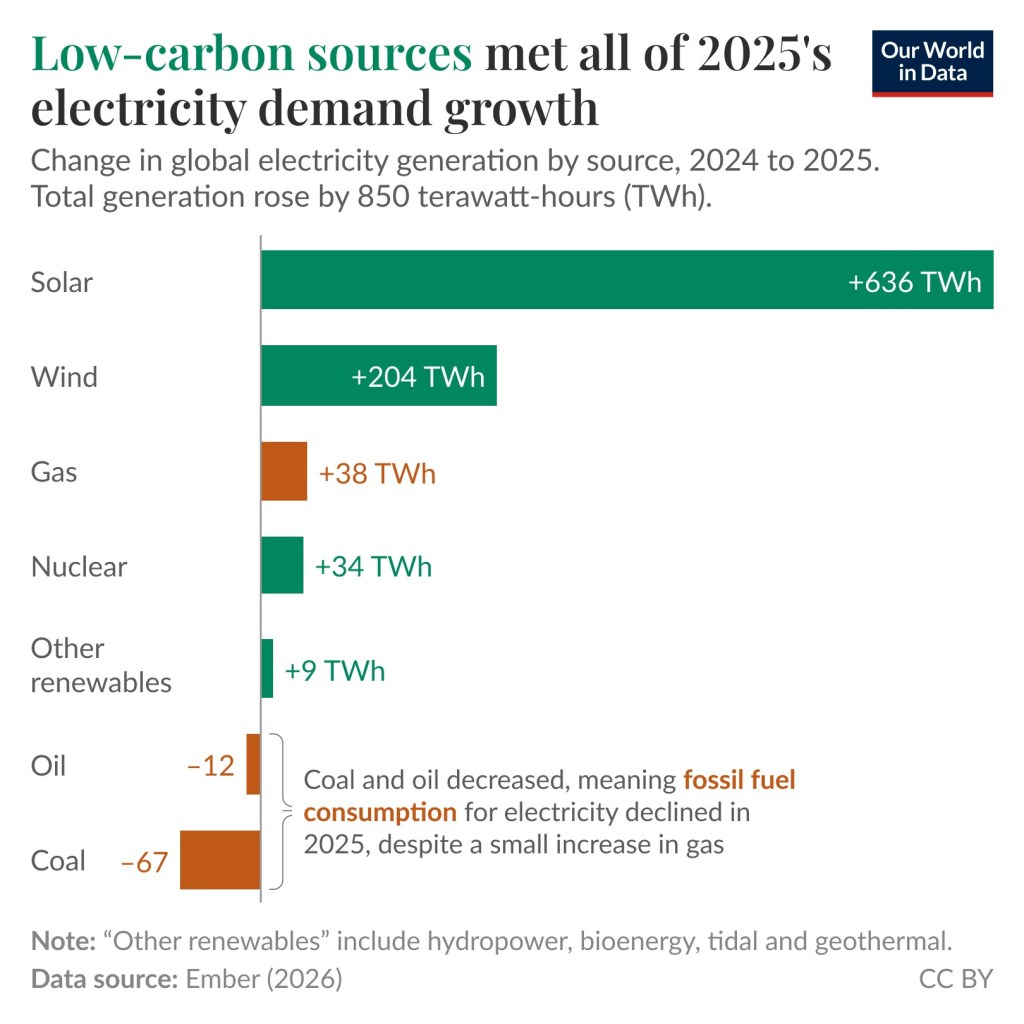
This is a bar graph showing an increase of 38TWh from gas, a decrease of 12TWh from oil, and a decrease of 67TWh from coal. The energy from wind, solar, nuclear, and other renewables increased by 850TWh.
Low carbon sources met all of 2025’s electricity demand growth. Change in global electricity generation by source, 2024 to 2025. Total generation rose by 850 terawatt-hours (TWh). Note: “Other renewables” include hydropower, bioenergy, tidal and geothermal. Data source: Ember (2026). This graph comes from this page.

New solar panel technology such as Perovskite Solar cells is being developed. The price of lithium-ion batteries has fallen by 99% since 1991 and by 82% in the last ten years. New battery technology such as sodium-ion batteries is being developed. One advantage of sodium-ion batteries is that they function exactly like a lithium-ion battery but replace lithium with abundant sodium ions to carry the electric charge. The evolving battery technology makes it easier to store power from solar during the night. SolarPower Europe project that the global solar fleet will more than double by 2030. In other words, the future looks bright for solar power, and that pun was intended.

The graph shows that solar contributed 2.2TW in 2024, and 2.9TW in 2025. Then follows bar graphs depicting three scenarios, low, medium, and high. The scenarios increase rapidly and by 2030 the low scenario is 5.8TW, the medium scenario is 6.6TW and the high scenario is 7.6TW | The Unfolding Solar Power Boom
Three different scenarios / projections by SolarPower Europe. The medium scenario predicts slightly more than a doubling of global solar fleet from 2026 to 2030.

Solar Power as a Share of Electricity Generation Around the World

For solar, the United States follows the rest of the world closely. Some countries have a higher percentage, such as the Cook Islands – 50%, Luxembourg – 30.52%, Chile – 25.06%. If you wish you can take a closer look here, or here, and you can play around with the different graphs. You can pick millions of combinations of countries and regions. For illustrative purposes I am showing some combinations below.
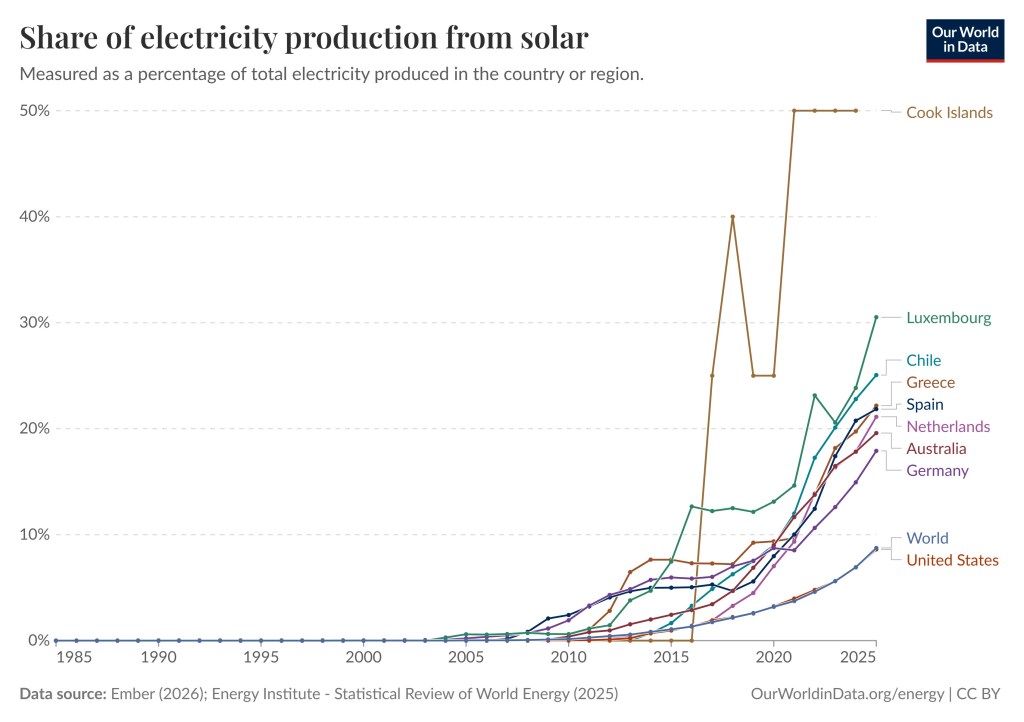
The graphs have different colors. Most graphs start out very low but increase significantly close to and after the year 2020. Cook Islands is an exception. The Cook Island graph shoot up sharply in 2016 from zero to more than 40%.
Share of electricity production from solar. Measured as a percentage of total electricity in the country or region. Some countries utilize solar more than other countries. These graphs include, Cook Islands, Luxembourg, Chile, Greece, Spain, Netherlands, Australia, Germany, the World and the United States. Data source: Ember (2026); Energy Institute – Statistical Review of World Energy (2025) OurWorldinData.org/energy | CC BY
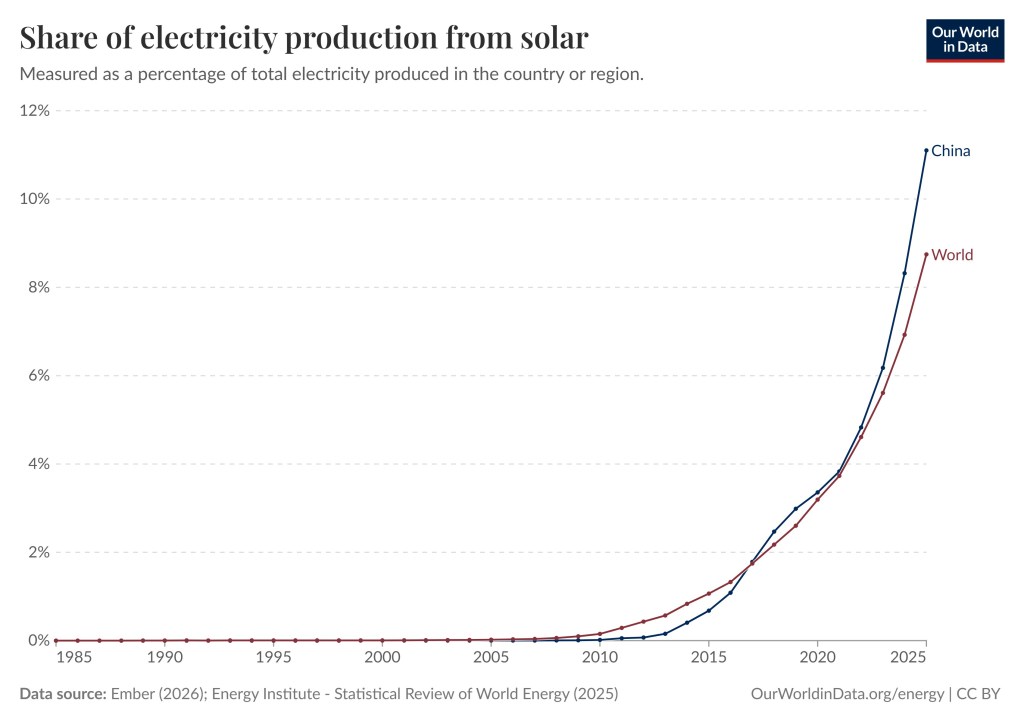
The graph for the world is brown and the graph for China is blue. The blue graphs reach a little bit higher than the brown graph. | The Unfolding Solar Power Boom
This graph shows that China has expanded their share of solar power a bit faster than the rest of the world. The share of electricity generated from Solar Power in the world was 8.75% in 2025 and in China 11.1%. Share of electricity production from solar. Measure as a percentage of total electricity in the country or region. Data source: Ember (2026); Energy Institute – Statistical Review of World Energy (2025) OurWorldinData.org/energy | CC BY
The graph for the EU is blue, for China it is red, for India it is green, for the World it is dark blue, and for the United States it is orange.
This graph shows the share of electricity generated from Solar Power in the largest countries and economic regions in the world. The share of electricity generated from Solar Power in the EU was 13.13% in 2025, in China 11.1%, in India 9.42%, in the World 8.75%, and in the US 8.6%. Data source: Ember (2026); Energy Institute – Statistical Review of World Energy (2025) OurWorldinData.org/energy | CC BY

How Clean and Safe is Solar Energy ?

You sometimes come across claims that renewable energy isn’t really clean energy. The truth is that renewable energy such as wind, solar, etc., is much cleaner than gas, oil, and coal. These energy sources are also much safer and using them saves a lot of lives. As you can see, among the eight energy sources depicted solar is the safest, and among the cleanest. Coal has 1,230 times higher death rate than solar. According to the Energy Policy Institute at the University of Chicago Chinese citizens can expect to live on average 2.2 years longer than they would have a decade ago, due to the sharp drop in pollution. This is thanks to the increased use of EVs and renewables such as solar.
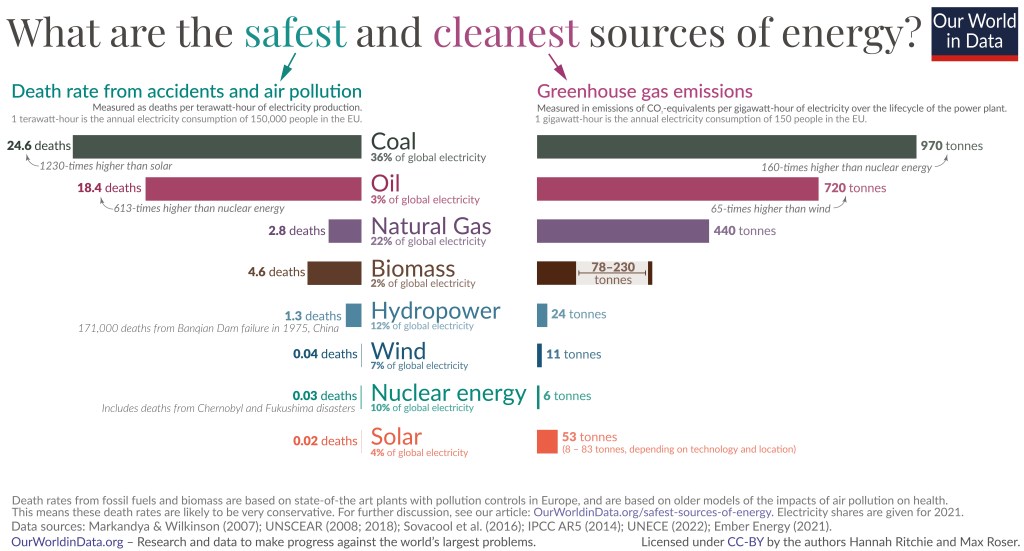
The graph depicts death rates and greenhouse gas emissions per unit for different energy sources including coal, oil, natural gas, biomass, hydropower, wind, nuclear power, and solar.
Greenhouse gas emissions and death rates from various sources of energy. Fossil fuels and biomass are based on state-of-the art plants with pollution control in Europe and are based on older models of the impacts of air pollution on health. This means that these death rates are likely to be very conservative. The graph shows that renewables and nuclear energy are the cleanest and safest forms of energy. For further discussion see the article: OurWorldinData.org/safest-sources-of-energy. Electricity shares are given for 2021. Data sources: Markandya & Wilkinson (2007); UNSCEAR (2008: 2018); Sovacol et al. (2016); IPCC AR5 (2014); UNECE (2022); Ember Energy (2001). OurWorldinData.org – Research and data to make progress against the world’s largest problems. Licensed under CC-BY by the authors Hannah Ritchie and Max Roser. Citation : Hannah Ritchie (2020) – “What are the safest and cleanest sources of energy?” Published online at OurWorldinData.org. Retrieved from: ‘https://archive.ourworldindata.org/20260202-100556/safest-sources-of-energy.html‘ [Online Resource] (archived on February 2, 2026).

Below are two pictures corresponding to zoom-in of the graph above.

The picture shows the death rates for the eight power sources in deaths per terawatt as horizontal bar graphs. Coal has a death rate of 24.6 death per terawatt and solar has a death rate of 0.02 deaths per terawatt. | The Unfolding Solar Power Boom
Death rates from accidents and air pollution. Measured as deaths per terawatt-hour of electricity production. 1 terawatt-hour is the annual electricity consumption of 150,000 people in the EU. The graph shows that coal, oil, gas, and biomass are a lot deadlier than hydropower, wind, nuclear power, and solar.
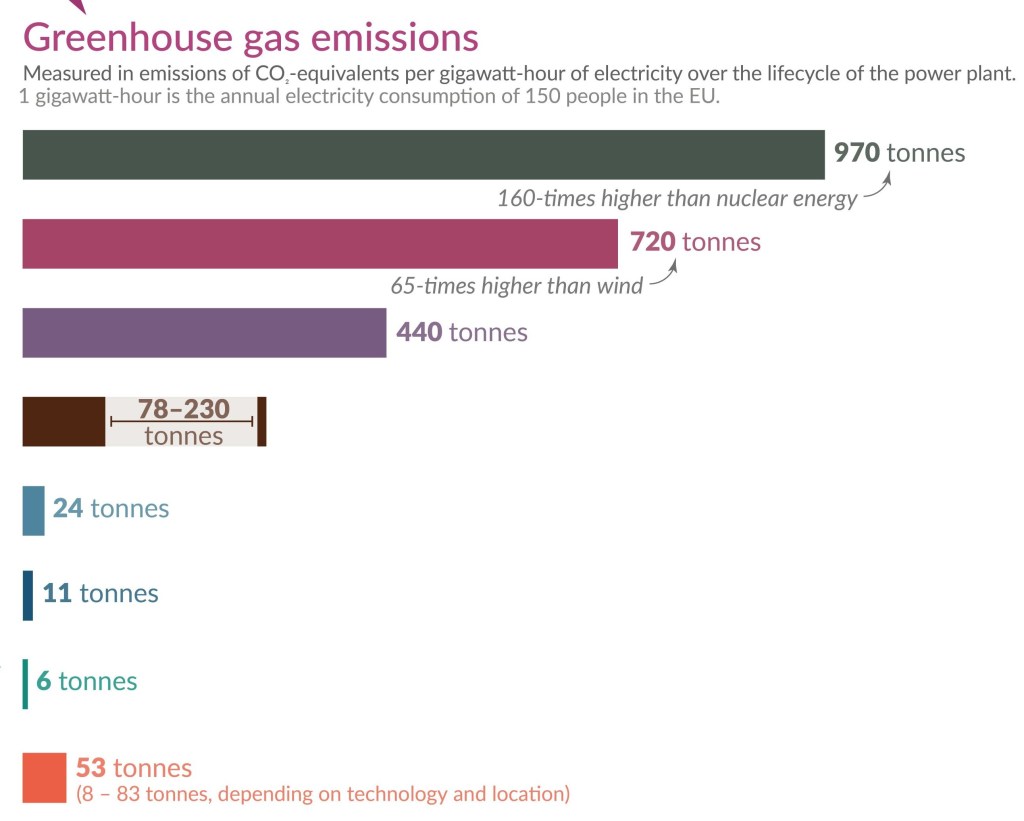
The picture shows the greenhouse gas emissions for the eight power sources in tonnes per gigawatt as horizontal bar graphs. Coal emits 970 tonnes per gigawatt and solar emits 53 tonnes per gigawatt. Wind emits the least 6 tonnes per gigawatt.
Greenhouse gas emissions. Measured in emissions of CO2 per gigawatt-hour of electricity over the lifecycle of the power plant. 1 gigawatt-hour is the annual electricity consumption of 150 people in the EU. The graph shows that coal, oil, gas, and biomass are responsible for a lot more greenhouse gas emissions than hydropower, wind, nuclear power, and solar.

Important Climate and Energy Facts

As I said, the misinformation about climate science has bamboozled a lot of people. We know that climate change / global warming is happening. We have also known for several decades that the current climate change / global warming is not natural. It is caused by us, chiefly due to the burning of fossil fuels. Yet many non-scientists dispute it.

The scientific evidence is conclusive, but a lot of people know very little about the evidence. It includes satellites directly measuring our greenhouse gases trapping heat, the upper troposphere is cooling whilst the lower atmosphere is warming, showing that the heating is from greenhouse gases, the unnatural speed of the warming is another piece of evidence, isotope studies, climate models, etc. Below are fourteen super facts related to climate science and clean energy.


To see the other Super Facts click here

The Unfolding Solar Energy Revolution

The goal of this blog is to create a list of what I call super facts. Super facts are important true facts that nevertheless are surprising to many, misunderstood, or disputed among the non-experts. They are special facts that we all can learn something important from. However, I also make posts that are not super facts but feature other interesting information, such as this book review and book recommendation. I should say that this book is not written by a scientist but an environmentalist, and he did not provide references for his hundreds of factual claims. However, I fact checked at least 20 claims and found only one that was not entirely correct, so I think his facts are for the part correct. The book is:

Here Comes the Sun: A Last Chance for the Climate and a Fresh Chance for Civilization by Bill McKibben

Below I am listing the four versions of this book. I bought the hardback version.

  • Hardback –  Publisher : W. W. Norton & Company (August 19, 2025), ISBN-10 : 1324106239, ISBN-13 : 978-1324106234, 224 pages, item weight : 12 ounces, dimensions : 5.8 x 0.9 x 8.6 inches. It costs $15.91on US Amazon. Click here to order it from Amazon.com.
  • Paperback –  Publisher : W. W. Norton & Company (August 11, 2026), ISBN-10 : 1324130628, ISBN-13 : 978-1324130628, 240 pages, item weight : 13 ounces, dimensions : 1 x 5.5 x 8.25 inches. It costs $19.99 on US Amazon. Click here to order it from Amazon.com.
  • Kindle –  Publisher : W. W. Norton & Company (August 19, 2025), ASIN : B0DXQGBM4Z, 220 pages, it costs $9.40 on US Amazon. Click here to order it from Amazon.com.
  • Audiobook – Publisher : Highbridge Audio (August 19, 2025), ASIN : B0F95QL1C2, Listening length : 7 hours and 36 minutes. $0.00 with membership. Click here to order it from Amazon.com.
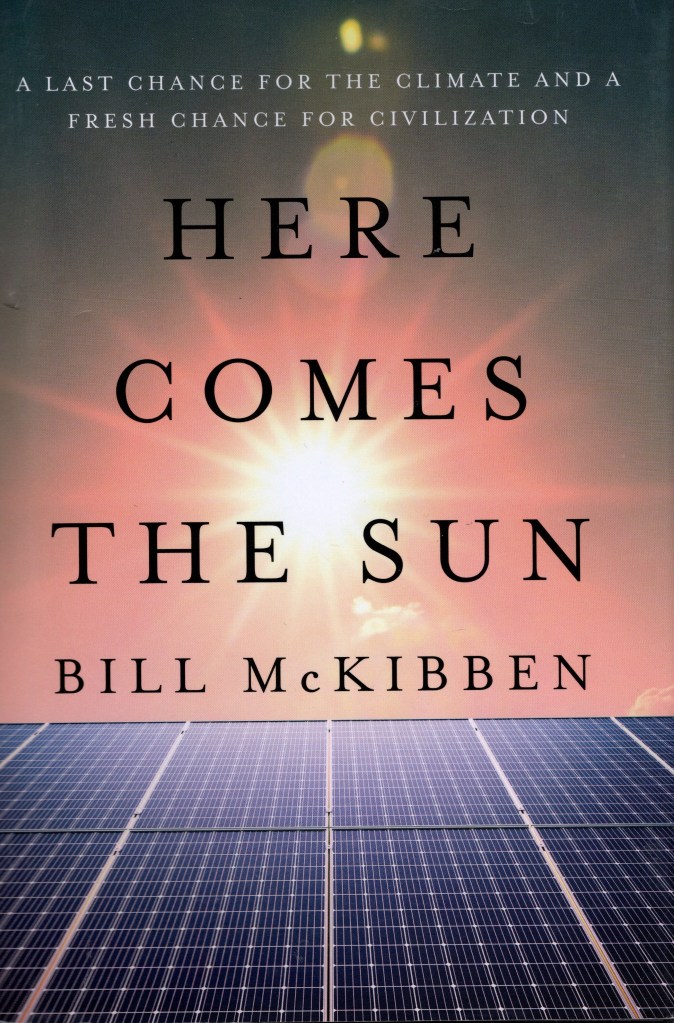
The front cover of Here Comes the Sun: A Last Chance for the Climate and a Fresh Chance for Civilization by Bill McKibben. | The Unfolding Solar Energy Revolution
The front cover of Here Comes the Sun: A Last Chance for the Climate and a Fresh Chance for Civilization by Bill McKibben. Click on the image to go to the Amazon page for the hardback version of the book.

Amazon’s Description of the Book

From the acclaimed environmentalist, a call to harness the power of the sun and rewrite our scientific, economic, and political future.

Our climate, and our democracy, are melting down. But Bill McKibben, one of the first to sound the alarm about the climate crisis, insists the moment is also full of possibility. Energy from the sun and wind is suddenly the cheapest power on the planet and growing faster than any energy source in history―if we can keep accelerating the pace, we have a chance.

Here Comes the Sun tells the story of the sudden spike in power from the sun and wind―and the desperate fight of the fossil fuel industry and their politicians to hold this new power at bay. From the everyday citizens who installed solar panels equal to a third of Pakistan’s electric grid in a year to the world’s sixth-largest economy―California―nearly halving its use of natural gas in the last two years, Bill McKibben traces the arrival of plentiful, inexpensive solar energy. And he shows how solar power is more than just a path out of the climate crisis: it is a chance to reorder the world on saner and more humane grounds. You can’t hoard solar energy or hold it in reserves―it’s available to all.

There’s no guarantee we can make this change in time, but there is a hope―in McKibben’s eyes, our best hope for a new civilization: one that looks up to the sun, every day, as the star that fuels our world.

This is my five-star review for Here Comes the Sun

The Spectacular Success of Renewables

Here comes the sun tells the story of the spectacular success of renewables around the world, especially the success of solar power and wind power, with a special emphasis on solar power. The success of renewables was one reason that the IPCC will likely retire the RCP8.5 emissions scenario. The RCP8.5 emissions scenario, which was the extremely bad emissions scenario, was never very likely to begin with, but the fact that the world, including China, is turning away from coal and fossil fuels made this scenario implausible as they stated. I am not sure whether Bill McKibben could have predicted this when he wrote this book, but I think this recent event makes this book very relevant now in 2026.

The book describes a very interesting situation for our world and contains interesting personal anecdotes and is written in a positive and optimistic way. However, I was delighted that the book was full of interesting facts, for example, in 2024 92.5% of all new electricity bought online around the world came from renewables. Other facts are, Chinese emissions are dropping. He tells us that forty percent of the world’s ship traffic consists of moving coal and gas back and forth across the ocean to be burned. He states that the entire continent of Africa has barely produced 3% of the greenhouse gases warming the atmosphere, whilst they are likely to bear the brunt of the effects of global warming.

Other interesting facts are; Chinese citizens can expect to live on average 2.2 years longer than they would have a decade ago, due to the sharp drop in pollution (thanks to renewables and EVs). Dealing with cleantech waste is a small problem compared to fossil fuels, and we have enough minerals, especially considering recycling. He tells us about various physics facts related to the sun, how our health is effected by the sun, the history of the day “Sunday”, sun worship in the ancient world, and other sun related facts.

He reviews the history of fossil fuels and renewables, particularly solar power, and the how the fossil fuel industry and certain politicians are fighting against renewables with disinformation and bad faith arguments. He explains the problems with fossil fuels and the dangers they pose, which is not just limited to climate change. He also explains a little bit about why we know that fossil fuels are causing global warming / climate change, why we need to keep pushing for renewables despite their success. He states that because fossil fuels themselves are easy to concentrate, they often yield authoritarian outcomes.

In the past renewables were an expensive alternative and fossil fuels cheap, but that situation has been reversed. He explains why EVs are in general cleaner and better for the environment than cars with internal combustion engines. He explains how we get around the intermittence issue with wind and solar and that batteries are getting much cheaper and environmentally friendlier, and why a lot of negative information you hear about batteries is not true anymore. Salt batteries is an example of an emerging technology.

My only concern with the book is that Bill McKibben is not a scientist. He is an activist. Because of that it is extra important that he provides references to reputable sources for all his claims. Typically, scientists provide references to their claims even though you in general can trust scientists more than activists. However, Bill McKibben provided no references to any of his several hundred facts and claims, except for some general and vague information in the back about where he got his information from.

I should say that I fact checked about two dozen of his claims and found only one that was not entirely accurate, so overall I trust this book. The book is easy, lighthearted and positive reading. It is not a heavy science book, the book was well organized, and he is a good author. Therefore, I highly recommend this book.

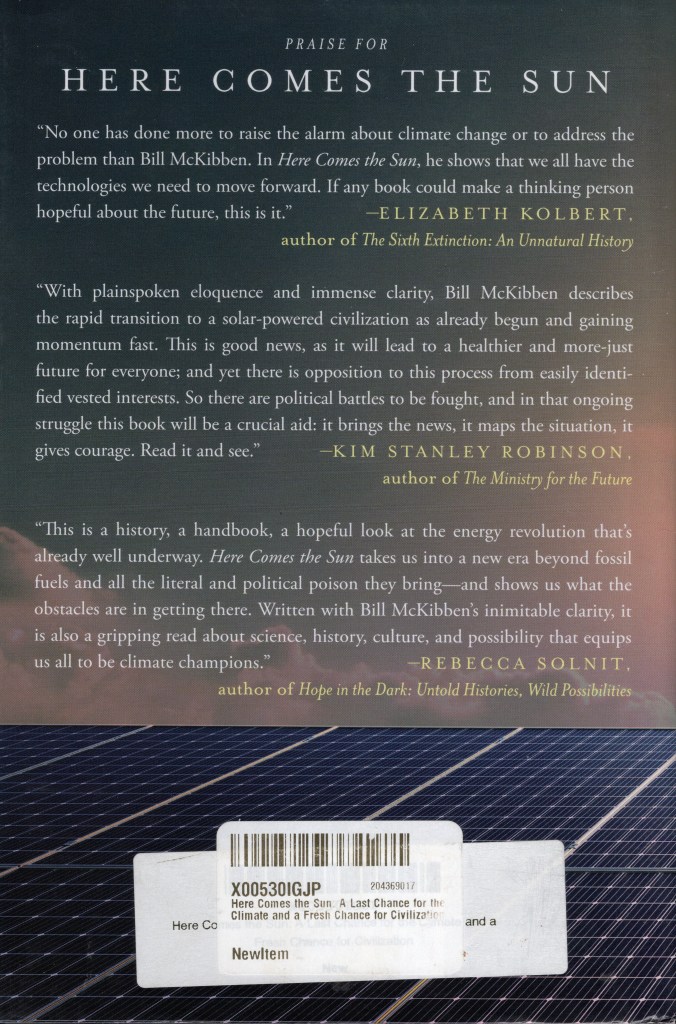
The back cover of Here Comes the Sun: A Last Chance for the Climate and a Fresh Chance for Civilization by Bill McKibben.
The back cover of Here Comes the Sun: A Last Chance for the Climate and a Fresh Chance for Civilization by Bill McKibben. Click on the image to go to the Amazon page for the paperback version of the book.

A related super fact is “The Unfolding Clean Energy Revolution


To see the Super Facts click here