Infinite Series Magic

Super fact 112 : Adding infinitely many numbers may result in a finite number. In addition, adding infinitely many numbers may result in an irrational important constant such as Pi. The same holds true for infinitely nested radicals (square roots).
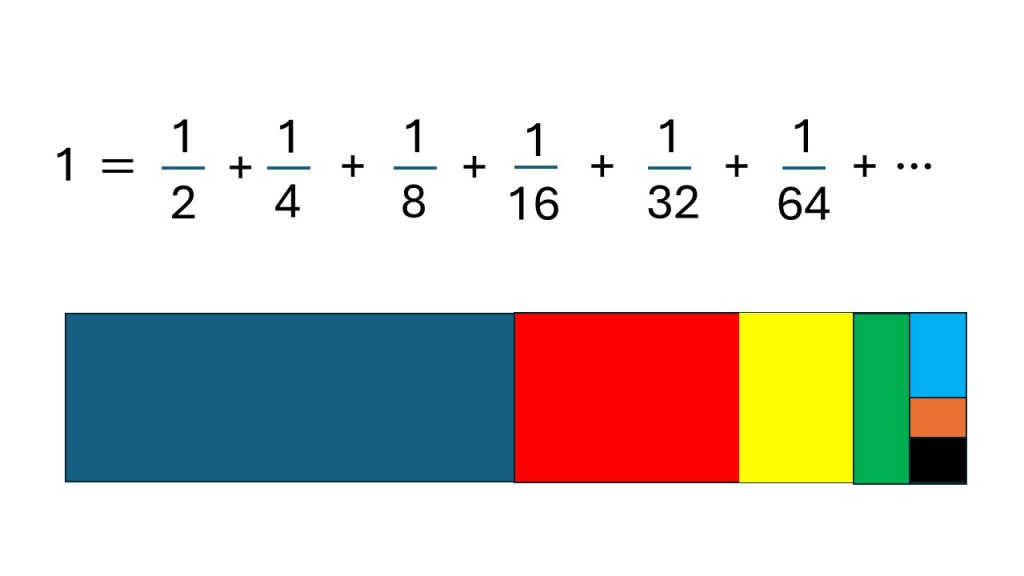
The picture features an infinite series and a rectangle divided into differently colored smaller and smaller rectangles. | Infinite Series Magic
The differently colored rectangles represent the fractions in the equation. Each subsequent addend is the half of the previous. Despite having an infinite number of addends, the total sum is just 1.

That you can add infinitely many numbers and get a finite number as the result is possible to understand if you imagine cutting a rectangle into smaller and smaller pieces and then adding them to get the rectangle back. If you start with half the rectangle and then you add the half of the remaining half and then the half of that remaining half, etc., you can keep doing that forever without exceeding the size of the rectangle. This is illustrated in the picture above. Note all these pictures are drawn by me.

If you’ve never seen an infinite series before this may come as a surprise. However, what is even more surprising is that you can add an infinite number of addends that are constructed from simple patterns and get all kinds of surprising results including irrational numbers with special meaning such as pi. You can easily find thousands of examples in mathematical handbooks and online. This reality is important in mathematics and our understanding of the world, as well as surprising, and therefore a super fact in my opinion.
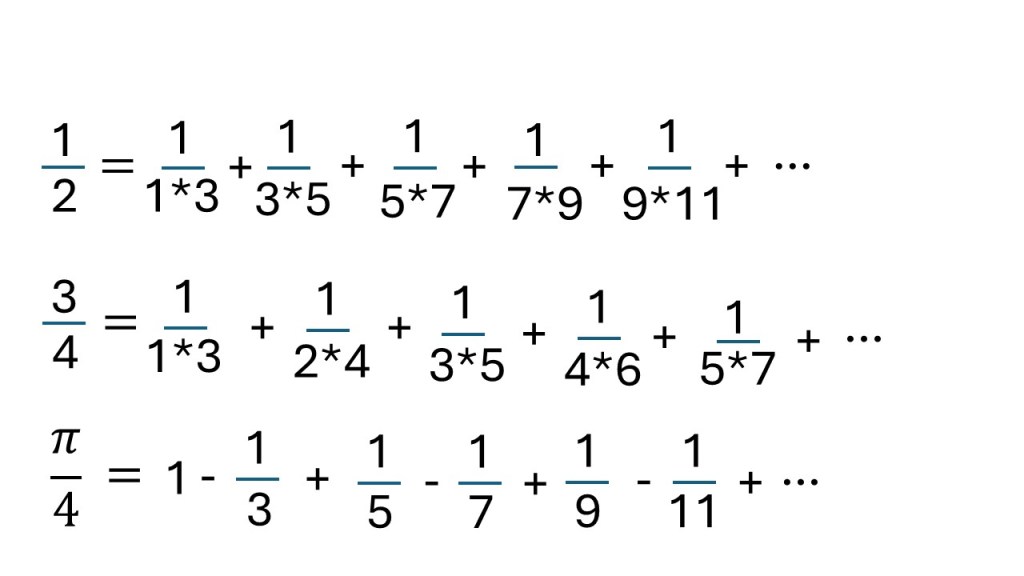
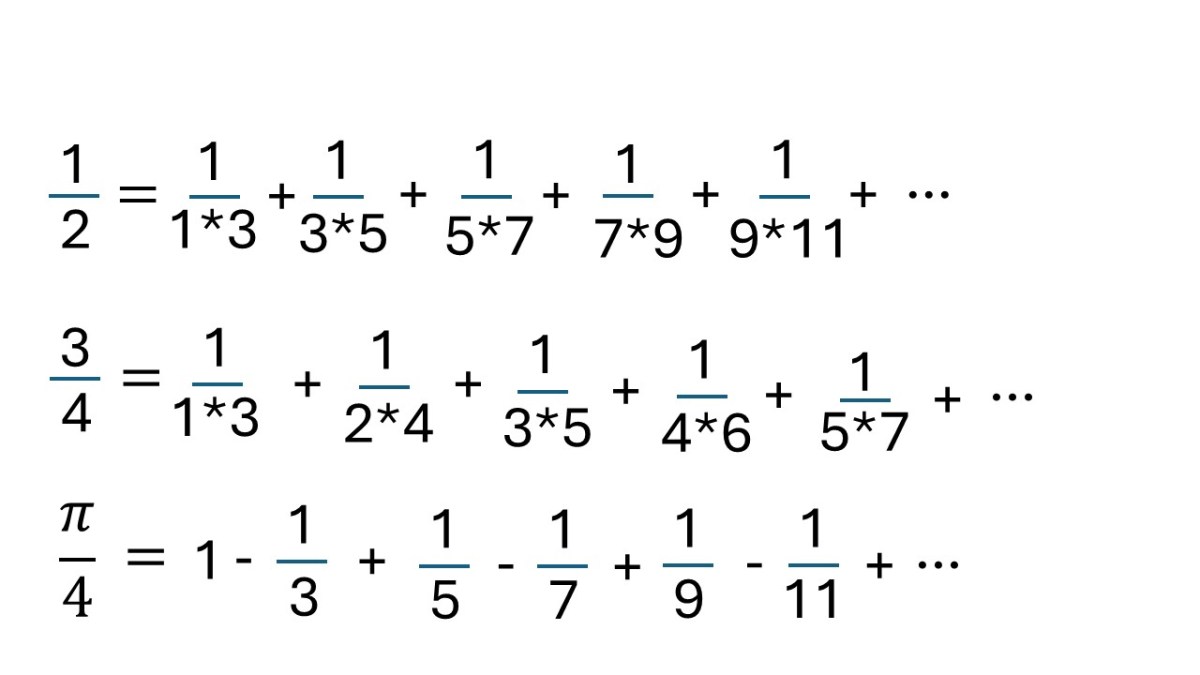
Three infinite series following very simple patterns. Two results in a simple fraction and the third yields the constant pi.
Three fascinating examples of infinite series. Note that I indicate multiplication using a star *.

Infinitely Nested Radicals

In addition, to adding an infinite number of addends you multiply an infinite number of factors and end up with a non-infinite (finite) result. You can even have an infinite number of nested radicals. To explain what a radical is. A square is a number multiplied by itself. For example, the square of 5 is five times five, which is twenty five. A cube is a number multiplied by itself three times. The cube of five is five times five times five, which is one hundred and twenty five. The square is denoted by adding a superscript of 2 (5 with a superscript 2). The cube is denoted by adding a superscript of 3 (5 with a superscript 3).

The square root is the opposite of the square. The square root of twenty five is five. The cube root is the opposite of the cube. The cube root of one hundred and twenty five is five. The square root and the cube root are examples of radicals. Radicals are indicated by using a little house on top of the number as shown in the pictures below. For radicals that are not square roots you add a number indicating what type of radical you have. The cube root has the number three above the house. All the examples below are square roots and in those cases the number two is left out.

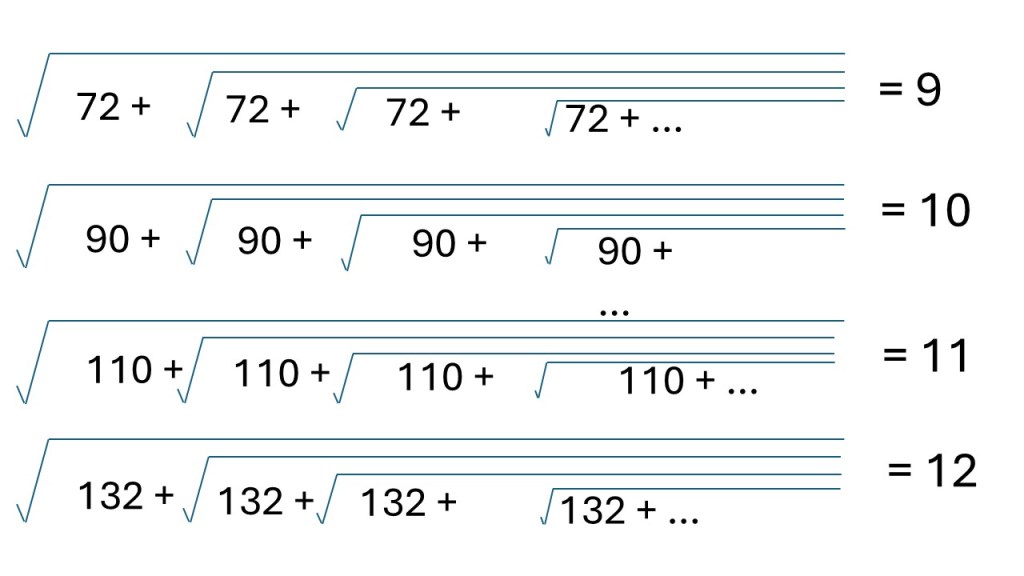
The three pictures below show one example of infinitely nested radicals (square root) using numbers n(n-1) repeatedly in the square roots. When n = 2 then n(n-1) is 2*1 = 2. When n = 3 then n(n-1) is 3*2 = 6, etc.
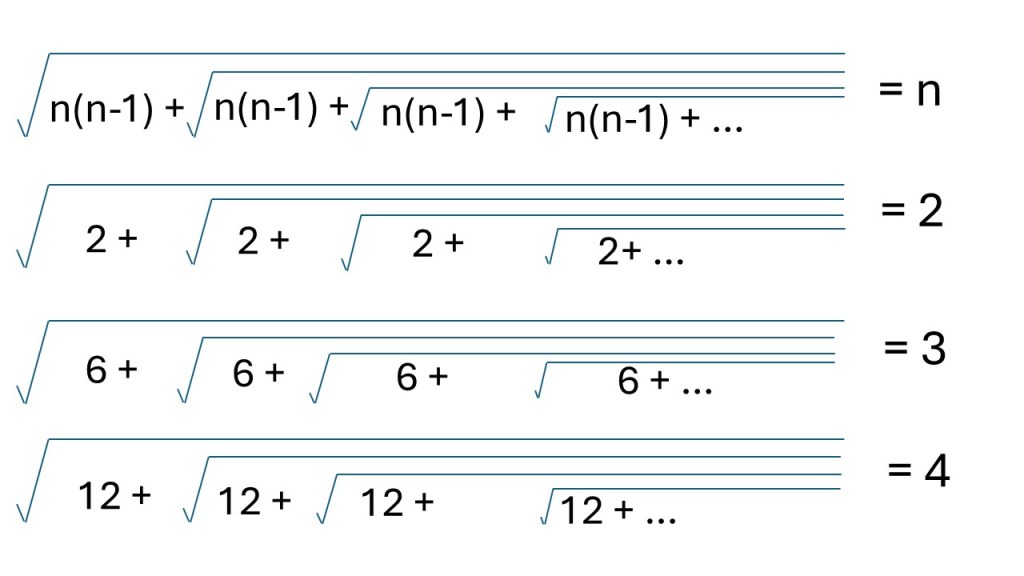
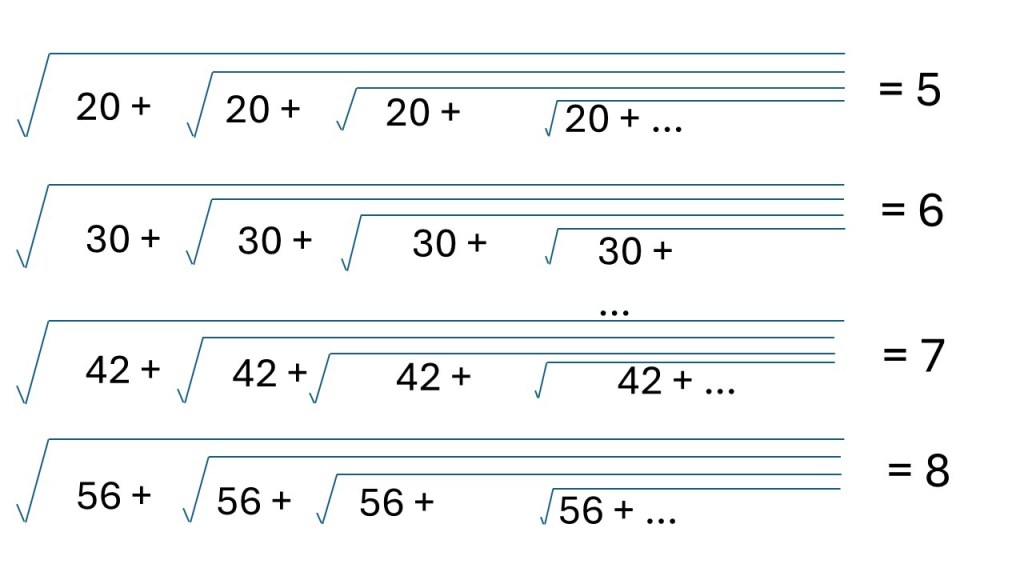
The picture displays the generic formula for this infinitely nested square root and three examples. | Infinite Series Magic
Infinitely nested square roots using n = 2 is the same as 2. Infinitely nested square roots using n = 3 is the same as 3, etc.
Infinitely nested square root for n = 5,6,7,8
Infinite Series Magic
Infinitely nested square root for n = 9,10,11,12

Infinite Series and Pi

The constant pi is a special mathematical number that tells you exactly how the distance around the edge of any circle compares to the distance straight across the middle (diameter). Pi is an irrational number, meaning it cannot be expressed as a fraction and when written as a decimal it has an infinite number of decimals that have no repeating patterns. Despite pi being irrational, it shows up as the result of a very large number of infinite series that follow surprisingly simple patterns.
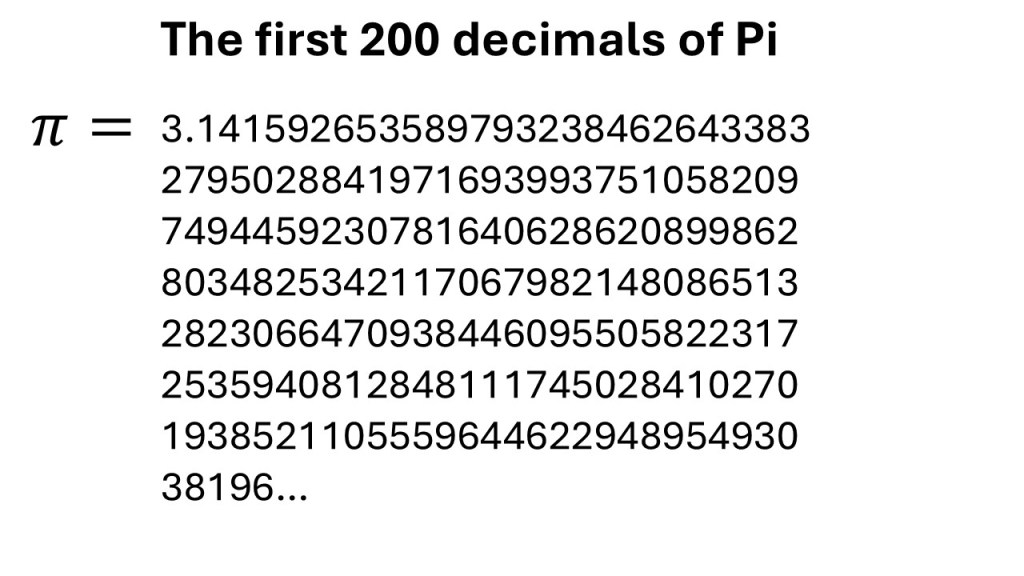
pi = 3.14159265358979323846264338327950288419716939937510582097494459230781640628620899862803482534211706798214808651328230664709384460955058223172535940812848111745028410270193852110555964462294895493038196…
The first 200 decimals of pi.
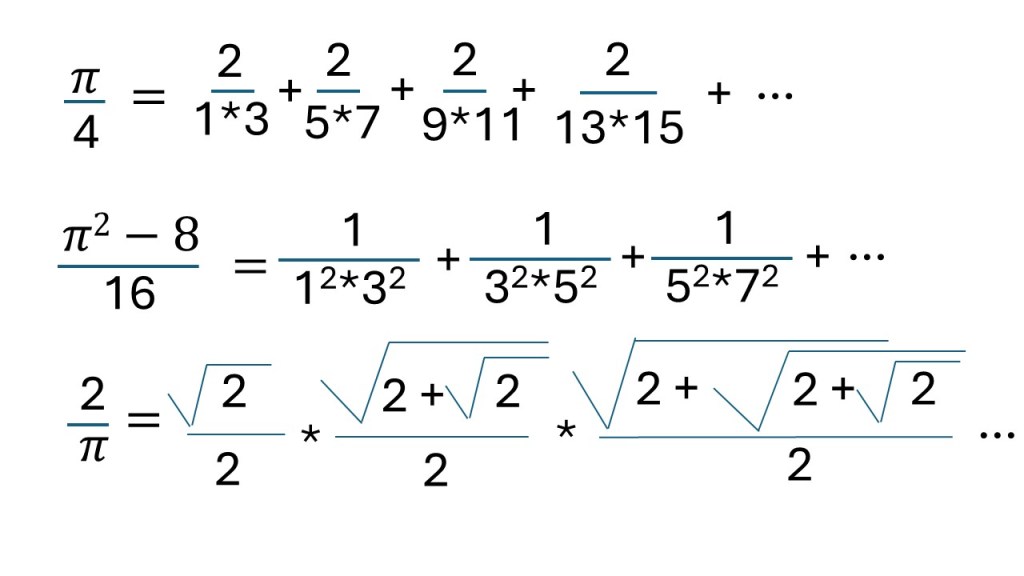
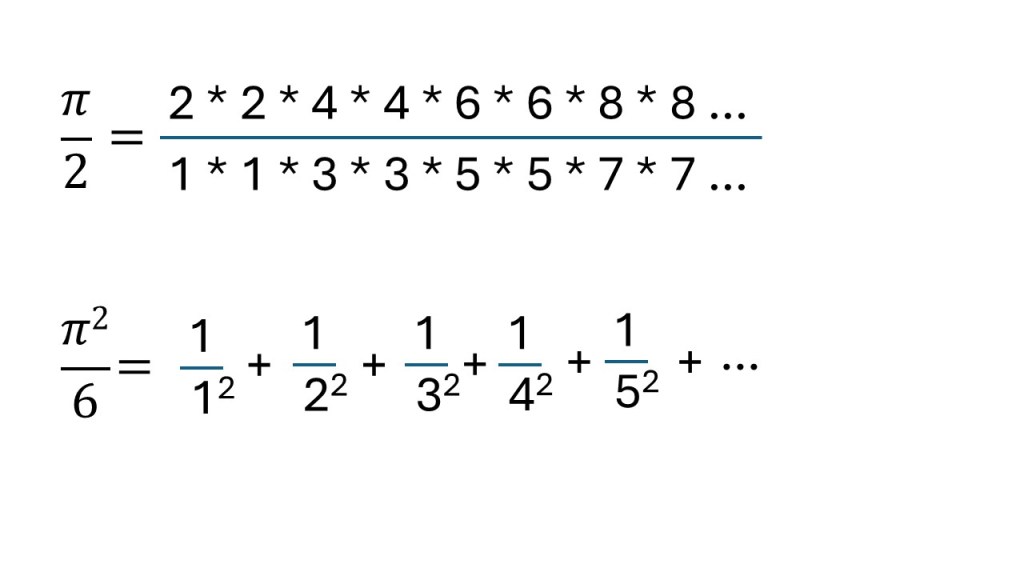
Two different infinite series, the first being a numerator with infinitely many factors multiplied and a denominator with infinitely many factors multiplied. The second an infinite number of fractions as addends. | Infinite Series Magic
Infinite multiplication and infinite number of addends.
Two infinite series and one infinitely nested radical.
Infinite series and infinitely nested square roots (radicals) resulting in pi.

Other Mathematics Superfacts


To see the other Super Facts click here

Russels Paradox

Super fact 111 : Russel’s Paradox is a logical contradiction discovered in 1901 that showed that the mathematical discipline of “Set Theory” was fundamentally flawed. Mathematicians had naively assumed that any definable property can be used to form a collection (or set) of items, but that is not true. An example of the Paradox is “A male barber shaves all men who do not shave themselves and only men who do not shave themselves. Does he shave himself?” Both “yes” and “no” are impossible answers. That is an example of an impossible set. Set theory needed an exclusion of such impossible sets.

Bearded client visiting barber shop. Barber scissors and straight razor, barber shop, suit. Vintage barber shop, shaving. Portrait bearded man. Mustache men. Brutal guy, scissors, straight razor. | Russels Paradox
Bearded client visiting barber shop. Shutterstock asset id: asset id: 1821348236 by Body Stock.

Russell’s paradox is a famous logical contradiction discovered by the philosopher and mathematician Bertrand Russell in 1901. To solve the contradiction, you need to remove the assumption that any property can form a set. In other words, not every set is possible. Basically, self-reference cannot be allowed.

To take the example above “A male barber who shaves all men who do not shave themselves and only men who do not shave themselves.” Is something that cannot exist. If the barber shaves himself then he is shaving someone who shaves himself, which was not allowed. If the barber does not shave himself, then he is not shaving all the men who do not shave themselves. Either way, it does not work. Such a barber cannot exist. In general, you cannot define a set anyway you like.

I consider this a super fact because it shows that contractions can be hidden even in mathematical disciplines, and it is important because you certainly don’t want contradictions hidden in a mathematical or scientific discipline. Contradictions lead to more contradictions and lots of problems.

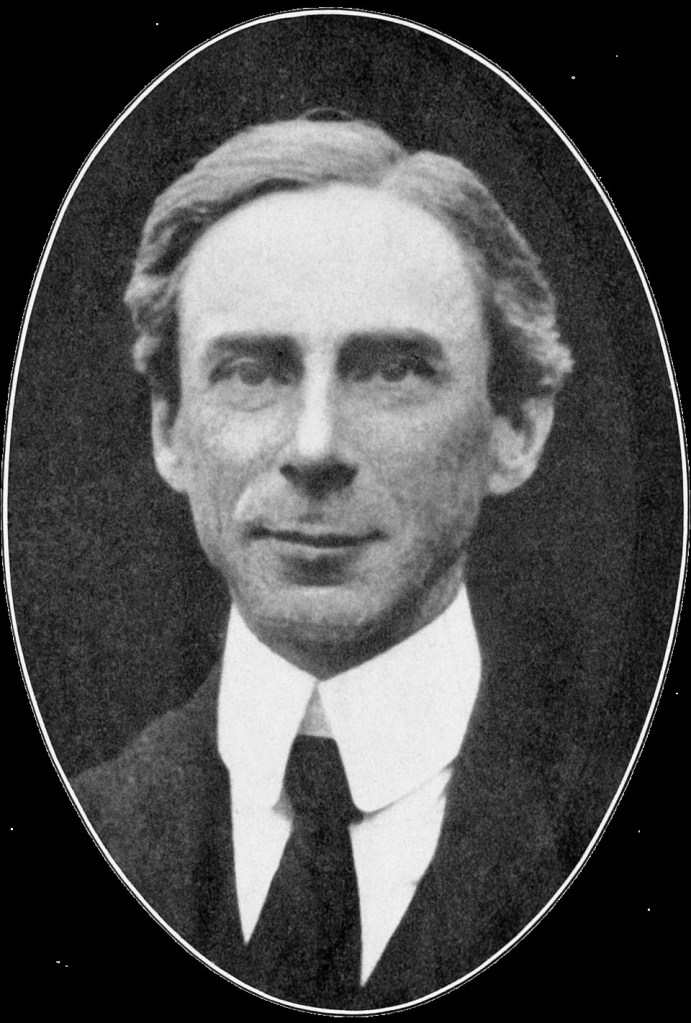
It is a black and white photo of the mathematician Bertrand Russel.
Bertrand Russell portrait. Honourable Bertrand Russell.jpg: Photographer not identifiedderivative work: Conquistador, Public domain, via Wikimedia Commons

A Crazy Barber Story Involving Our Children

This happened soon after the September 11 attacks in 2001. In addition to planes crashing into buildings, there were attempts at biological warfare by spreading anthrax through the postal service. This is something we paid special attention to at my work because we were making postal sorting machines. It is also the reason I do not like people who write addresses in cursive.

Anyway, my wife called me at work, and she was very upset because our daughter’s hair was falling out. She touched her hair and it just fell off. She did not know what could be causing her hair to suddenly fall out, but she thought that it might have been biological warfare. I told her to call our doctor who had the good sense of suggesting that perhaps the kids had been playing barbershop. As it turned out they had. Our son confessed to cutting off our daughter’s hair. He had realized that this was bad, so he tried to put her hair back as well as he could. Afterwards, she was walking around with loose hair on top and that’s when my wife found her.

Was our son the barber who cut everyone’s hair and only those who did not cut their own hair? No because that barber can’t exist. Some sets can’t exist and you need to include that in the definition of what a set is, or in this case what kind of groups of barbers you can have.
Our son is cutting his sisters hair. The picture is generated with the help of ChatGPT.


To see the other Super Facts click here

30-60 million Bison used to roam the plains

Super fact 110 : At the end of the 18th century there were 30-60 million North American Bison (buffalo) roaming the plains. The mass destruction of the bison began in 1830 and was intentional and by the end of the 19th century there were only a few hundred left. Since then, they have recovered and today there are 500,000 Bison including 30,000 wild Bison.

The picture shows a male plains bison standing on a plain and looking into the camera.
Scientists are helping users of American rangelands meet the challenge of managing multiple uses and sustainably. This picture is in the public domain because it contains materials that originally came from the Agricultural Research Service, the research agency of the United States Department of Agriculture. From Wikimedia commons author Jack Dykinga.

In the past there were at least 30-60 million bison, roaming North America. As mentioned by the end of the 19th century there were only a few hundred left. They have recovered since then and now there are 500,000 Bison including 30,000 wild Bison. For comparison there are 86.2 million cattle in the US  and another 11.8 million in Canada. This is just one of many reasons that the wild mammal biomass has substantially declined around the world. Wild mammals have declined by 85% since the rise of humans even as the total mammal biomass has nearly tripled.

The reason for the extremely sharp decline of the Bison in the 19th century was because the U.S. government intentionally drove the bison to the brink of extinction. The American bison was a major resource for the traditional way of life of the native Americans and therefore the extermination of the Bison became an important tool in the efforts to subjugate Native Americans.

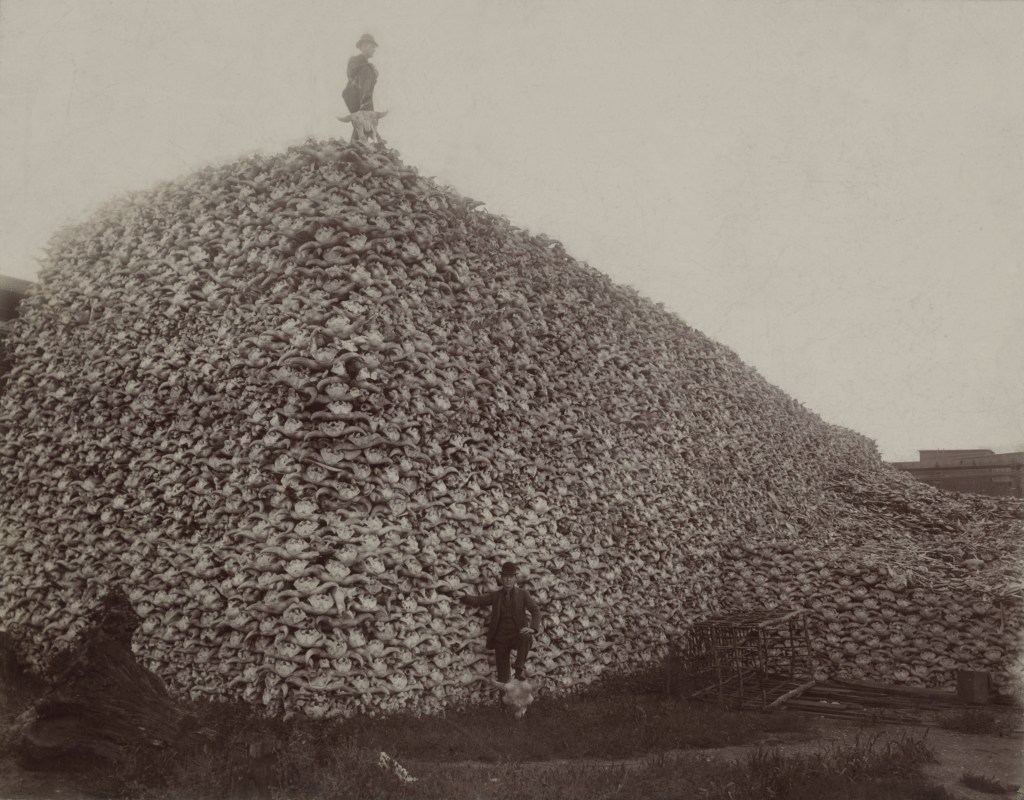
30-60 million Bison used to roam the plains | 1892: bison skulls await industrial processing at Michigan Carbon Works in Rougeville (a suburb of Detroit). Bones were processed to be used for glue, fertilizer, dye/tint/ink, or were burned to create "bone char" which was an important component for sugar refining. In the 16th century, North America contained 25–30 million buffalo.
1892: bison skulls await industrial processing at Michigan Carbon Works in Rougeville (a suburb of Detroit). Bones were processed to be used for glue, fertilizer, dye/tint/ink, or were burned to create “bone char” which was an important component for sugar refining. In the 16th century, North America contained 25–30 million buffalo. This picture is in the public domain and taken from this Wikipedia.

I consider this a super fact because it is a shocking historical event that it seems many are unaware of. I was certainly surprised the first time I read about it.

How Did the Bison Population Recover ?

At the end of the 19th century indigenous groups used the Flathead Indian Reservation to quietly protect small captive herds, keeping bison alive while they vanished from the wild. In addition, a few individuals as well as Native American families captured stray calves and started private breeding programs.


A herd of grazing bison on a field in Yellowstone. In the background are geysers and hills.
Herd of American bison grazing in a green meadow at Yellowstone National Park, with geysers and mountains in the background under a bright blue sky. Shutterstock asset id: asset id: 2688666937 by NicoleHFlores


To see the other Super Facts click here

The Number of people in the World without Electricity has halved since 2000

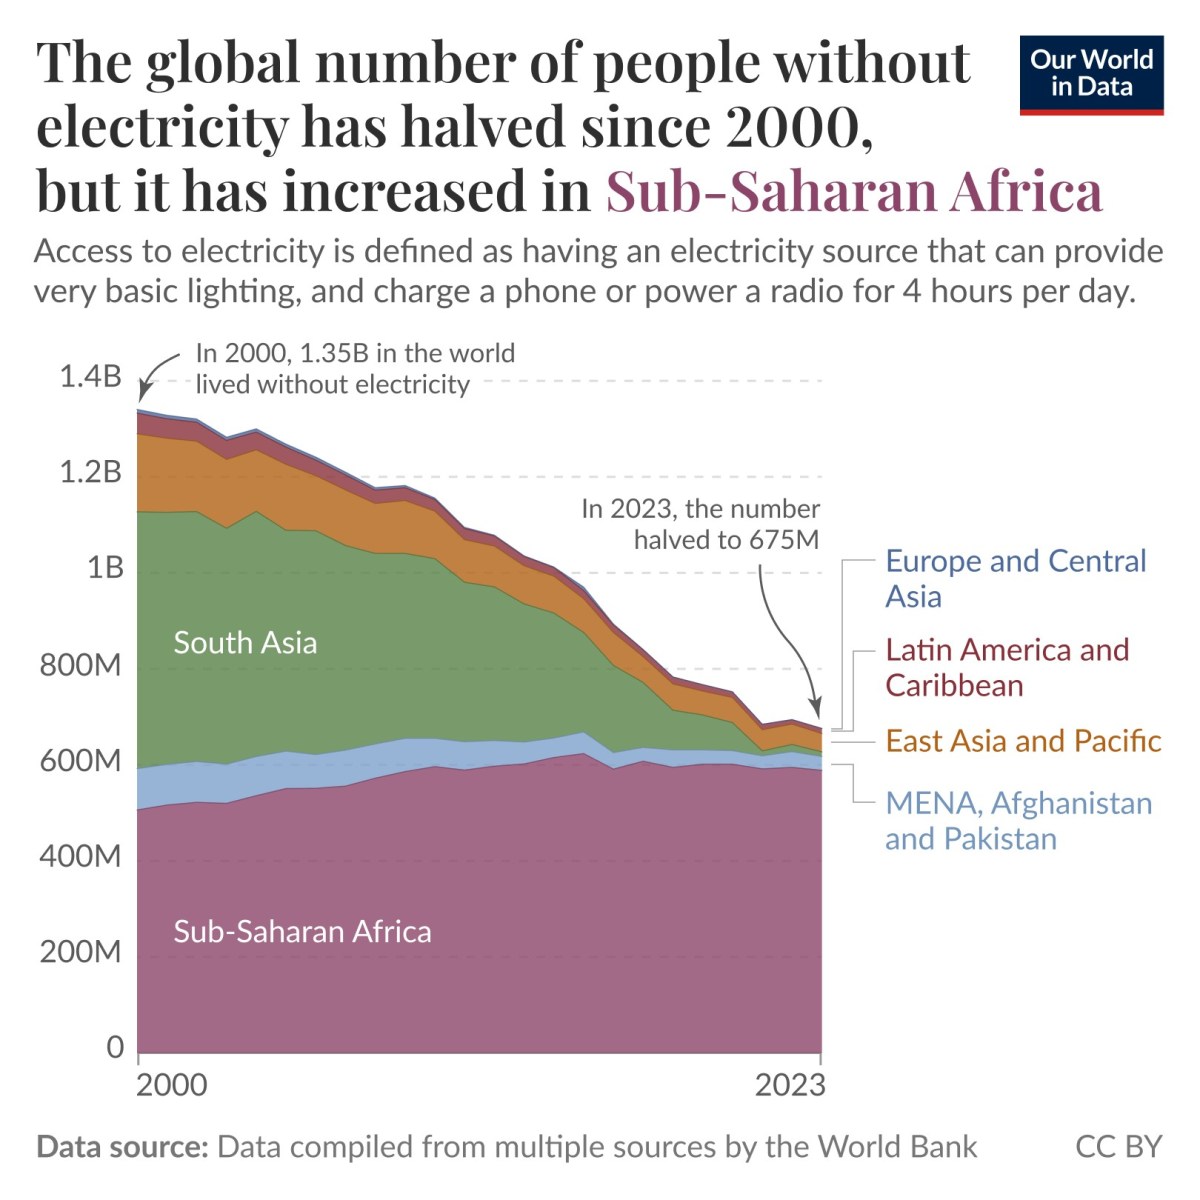
Super fact 109 : The global number of people without electricity has halved since 2000, but it has increased in Sub-Saharan Africa. In the year 2000 1.35 billion people in the world was without electricity and in the year 2023 it was 675 million people according to Our World in Data. The dark aspect of the statistics is that the number of people without electricity in Sub-Saharan Africa has increased from 500 million people to more than 600 million people.

The graph shows the number of people without electricity in five regions of the world, Europe and Central Asia, Latin America and the Caribbean, East Asia and the Pacific, MENA, Afghanistan, and Pakistan and Sub-Saharan Africa. The graph shows that the number of people in the world without electricity has gone from 1.35 billion to 675 million, and that all regions except Sub-Saharan Africa show a dramatic improvement. As a result, Africa now has the vast majority of people in the world without electricity. | The Number of people in the World without Electricity has halved since 2000
The global number of people without electricity has halved since 2000, but it has increased in Sub-Saharan Africa. Access to electricity is defined as having an electricity source that can provide very basic lightning and charge a phone or power a radio for 4 hours per day. Data source: Data compiled from multiple sources by the World Bank. CC BY. The graphs come from this page from Our World in Data.

This also means that the share of people without electricity living in Sub-Saharan Africa increased from 37% in the year 2000 to 80% now. However, it is also true that the share of people in Sub-Saharan Africa with electricity has doubled, rising from 26% to 53%. What is going on is that population growth has outpaced this expansion, meaning the number of people without electricity has still risen.

For the rest of the world, it is unequivocally good news. For example, in South Asia more than 500 million people lacked electricity in the year 2000, 414 million lacked electricity in 2010, and only 27 million people lacked electricity in 2023. Another way to look at the access to energy gap is by considering how long it is possible to run an air conditioner in different countries. Click here for data and analysis. In summary, the news for Sub-Saharan Africa is complicated but for the rest of the World, it is very good news. To read more about this topic click here.

I consider this a super fact because I believe it is an important but surprising fact in two parts. First the great news for the world and secondly the mixed news for Sub-Saharan Africa.

No Relief for the Heat Down in Africa

As mentioned, four of the five regions of the world, Europe and Central Asia, Latin America and the Caribbean, East Asia and the Pacific, MENA, Afghanistan, and Pakistan have made substantial progress. However, Sub-Saharan Africa is a complicated case. Note that MENA stand for Middle East and North Africa.

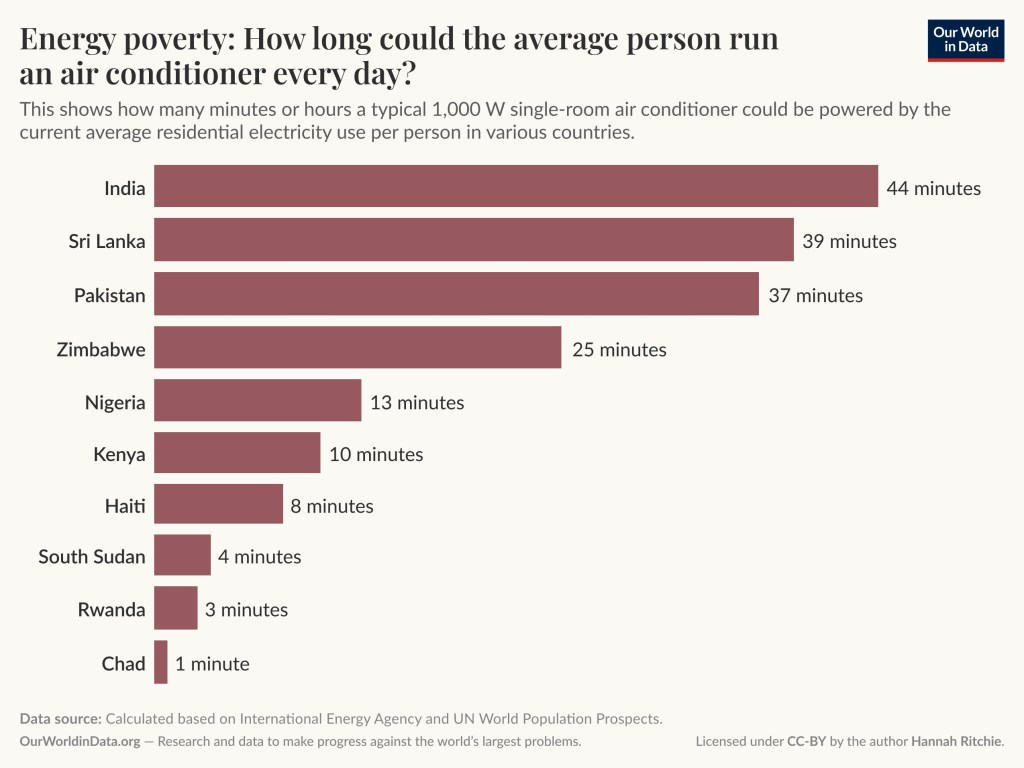
An alternative way of looking at access to electricity is to consider how much electricity is being used in each country and how that translates into the number of hours or minutes that an air conditioner could be running. Note it doesn’t mean that an air conditioner will be shut off after, let say 25 minutes, just that is much electricity one person use. What should be noted from the graph below is how dire the situation still looks like in Sub-Saharan countries. Sub-Saharan Africa is still very behind in this regard, and the fact that global warming is likely to hit Africa very hard that is not good news.

The bar graph includes India 44 minutes, Sri Lanka 37 minutes, Pakistan 37 minutes, Zimbabwe 25 minutes, Nigeria 13 minutes, Kenya 10 minutes, Haiti 8 minutes, South Sudan 4 minutes, Rwanda 3 minutes, Chad 1 minute.
Energy Poverty: How long could the average person run an air conditioner every day? This is how many hours a typical 1000 W single-room air conditioner could be powered by the current average residential electricity use per person in various countries. Data source: Calculated based on International Energy Agency and UN World Population Prospects. OurWorldinData.org – Research and data to make progress against the world’s largest problems. Licensed under CC BY by the author Hannah Ritchie. The graph is coming from this page from Our World in Data.


To see the other Super Facts click here

EVs are Replacing the Internal Combustion Engine

Superfact 107: Electric vehicles are rapidly replacing the internal combustion engine (ICE cars) and are becoming commonplace around the world. It is analogous to how cars once replaced the horse and buggy.

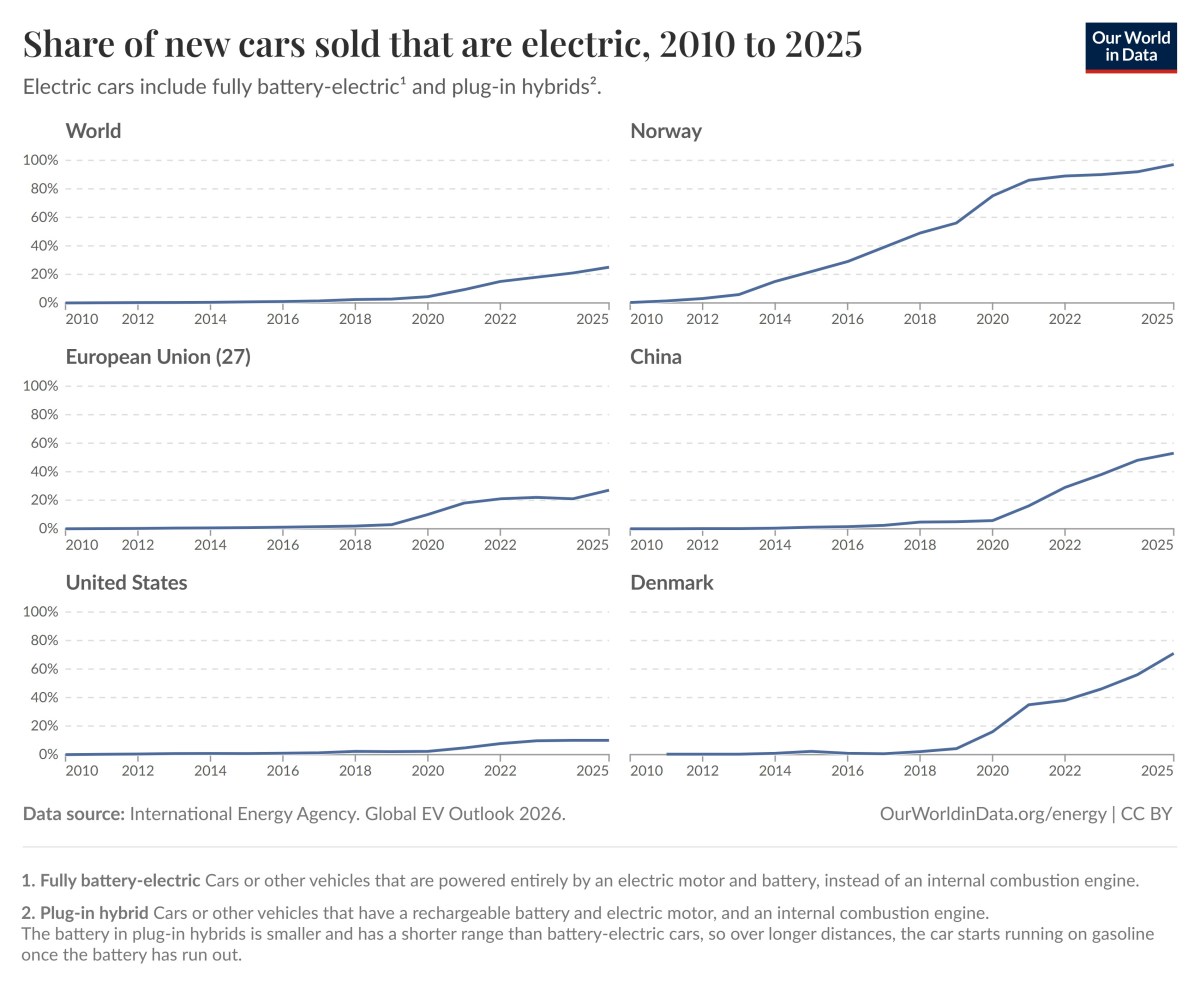
In Norway close to 100% of all new cars sold in 2025 were electric vehicles. Around the world a substantial percentage of new cars sold in 2025 were electric vehicles. This phenomenon is not as visible here in the US, where I live, but if you travel, you’ll notice.

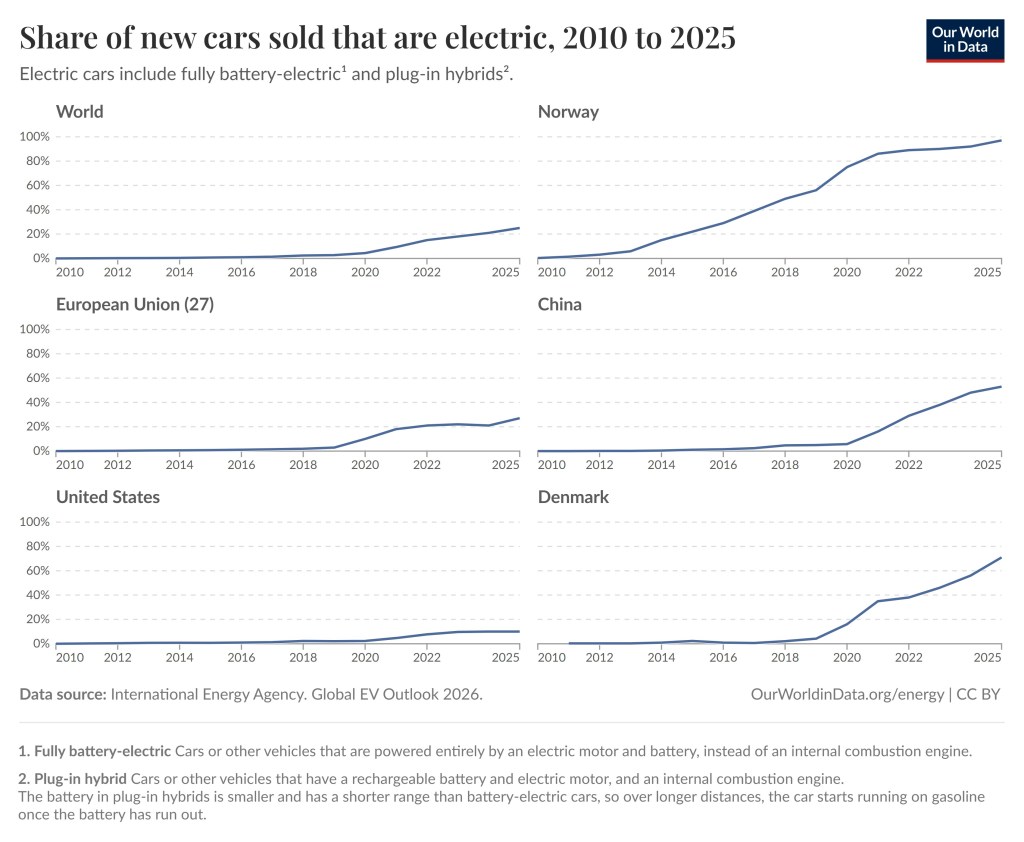
The graphs below show that the share of new cars that were sold in 2025 that were EVs was substantial, but more importantly there is a sharp upward slope of the curve(s). The share of new cars sold in 2025 that were electric was in respective region or country: Norway 97%, Denmark 71%, China 53%, European Union 27%, World 25%, the United States 10%. The graphs are taken from this page on the Our World in Data web page. I encourage you to play around with the interactive graphs. You can read more about new cars sales in Norway here.

EVs are Replacing the Internal Combustion Engine

It should be noted that electric cars include fully battery-electric and plug-in hybrids. With battery-electric cars is meant cars or other vehicles that are powered entirely by an electric motor and battery, instead of an internal combustion engine. With plug-in hybrid is meant cars or other vehicles that have a rechargeable battery and electric motor, and an internal combustion engine. The battery in plug-in hybrids is smaller and has a shorter range than battery-electric cars, so over longer distances, the car starts running on gasoline once the battery has run out.

This is a fact that is important, and that likely comes as a surprise to people living in countries that are lagging in this transition, such as the United States. Therefore, I consider it a super fact.

The Share of EVs

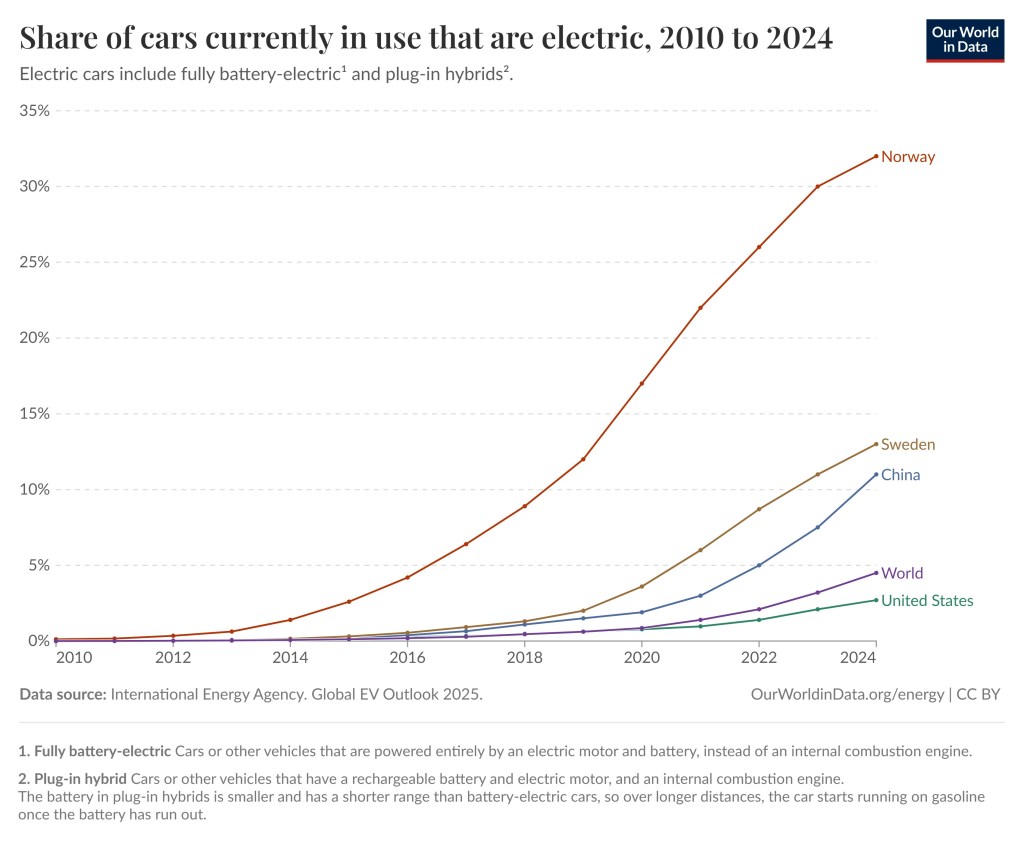
The sharp increase in the sale of electric cars is a recent phenomenon and therefore there are still a lot of ICE cars on the roads. Therefore, there is a significant difference between the share of electric vehicles on the road and the share of new cars sales being EVs. The share of electric cars on the roads in 2024 was in the United States 2.7%, in the world 4.5%, in China 11%, in Sweden 13% and in Norway 32%. See the graph below.

The graph shows the share of cars currently in use that are electric for the world, the United States, China, Sweden and Norway.
Share of cars currently in use that are electric, 2010 to 2024. Data source: International Energy Agency Global EV Outlook 2025.   OurWorldinData.org/energy | CC BY

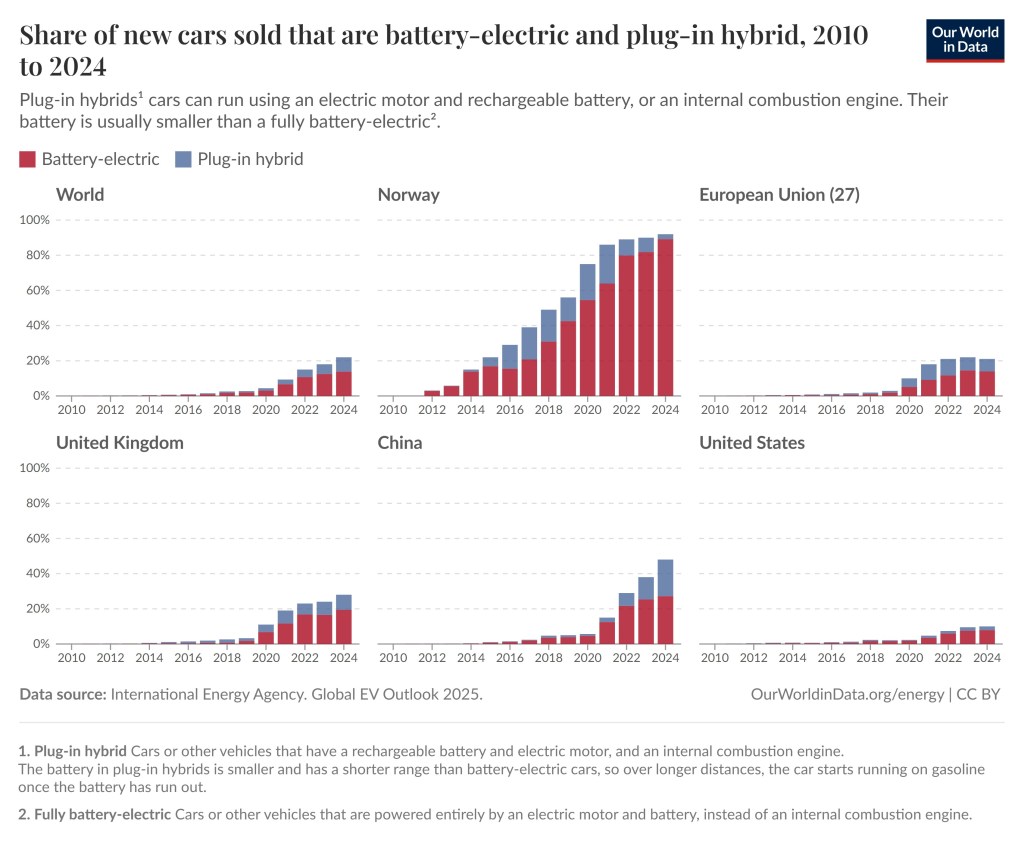
The graph below illustrates the sales of fully battery-electric cars versus plug-in hybrids.

EVs are Replacing the Internal Combustion Engine

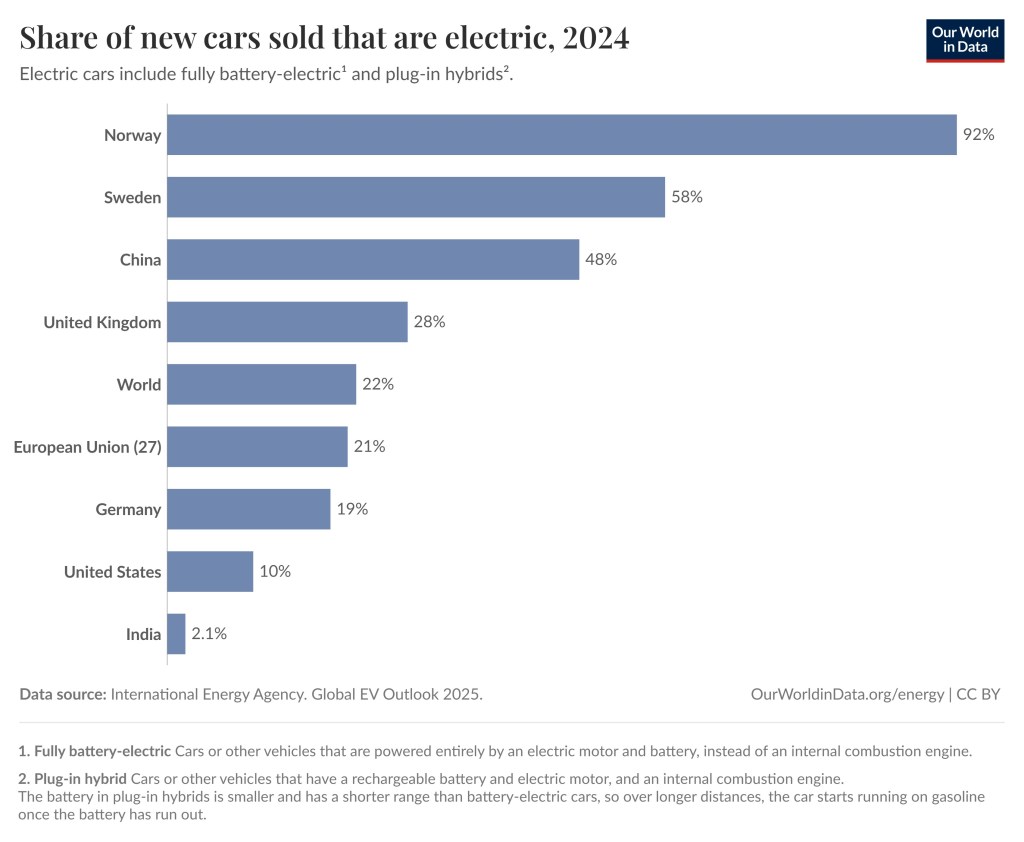
The bar graph below is an alternative illustration showing the share of  new cars sold that are electric in 2024 for the world and 8 countries.

The bar graph shows the share of new cars sold that are electric in 2024 for the world and 8 countries. The numbers are India 2.1%, the United States 10%, Germany 19%, European Union 21%, United Kingdom 28%, China 48%. Sweden 58%, Norway 92%, and the World 22%
Share of new cars sold that are electric, 2024. Electric cars include fully battery-electric and plug-in hybrids. Data source: International Energy Agency  Global EV Outlook 2025.  OurWorldinData.org | CC BY

This article states that there are now more new electric cars sold in the EU than ICEs. However, it should be noted that they include hybrids (non-plug-in) in this number.

Are EVs cleaner than ICE cars ?

Yes, they are, for the most part. EV Cars emit less pollution than Internal Combustion Engine Cars, even considering manufacturing, disposal and EV Cars being charged by dirty grids. Basically, this is because burning oil to move a vehicle creates significantly more heat than motion.

It all depends on how dirty the grid is. This map shows the average EV as a gasoline MPG equivalent for the different grid networks in the United States in 2020. As you can see an average EV corresponds to a 76 mpg gas car in Texas (with the ERCOT) grid, which is much cleaner than almost any gasoline car. Also, the ERCOT grid has become cleaner since 2020. The average for the United States is 91 mpg. There are a couple of grids for which owning an EV may not be cleaner. I created another super fact post that explains the details called: super fact (29) EV Cars Indeed Emit Less Carbon Pollution. You can read more here.

There are concerns about the mining of minerals for EV cars, such as cobalt and lithium, which has an environmental impact. However, this environmental impact should be compared to the environmental impact caused by the drilling and transport of oil (and the burning of gas/oil). In general, the environmental impact of EVs is considered much less. In addition, EV batteries last a long time, and 95% to 98% of the valuable materials in EV batteries (lithium, cobalt, nickel, and copper.) can be recycled/recovered. You can read about other EV myths here. However, this is probably a topic for a future super-fact.


Craigavad a scientist and fellow blogger, wrote a very well balanced and insightful article on the issue of the carbon cost of electric vehicles. I encourage you to read it : “The Carbon Cost of Electric Cars: are they worth it?


To see the other Super Facts click here