The goal of this blog is to create a list of super facts. Important facts that are true with very high certainty and yet surprising, misunderstood, or disputed by many. This blog aims to be challenging, educational, and fun, without it being clickbait. I determine veracity using evidence, data from reputable sources and longstanding scientific consensus. Prepare to be challenged (I am). Intentionally seek the truth not confirmation of your belief.
Superfact 117: The share of electricity generated from Solar Power in the world has grown from essentially 0% in the year 2000, 0.15% in 2010, to 3.19% in 2020, and to 8.75% in 2025. Both wind and solar energy are expanding fast around the world, but solar energy is a strong latecomer to the energy scene.
Solar energy panel. Shutterstock asset id: 2459435149 by Nordic Studio.
In the year 2000 less than 0.01% of the world’s electricity was generated by solar. In 2005 it was 0.02%, in 2010 it was 0.15%, in 2015 it was 1.07%, 2020 it was 3.19%, in 2025 it was 8.75%. Can you guess what will it will be in 2030? The United States may be behind the rest of the world with respect to wind power and EVs, but it closely follows the rest of world when it is about solar. You can play around with the graph below and select different countries by clicking here.
Share of electricity from Solar. Measured as a percentage of total electricity produced in the country or region. Data source: Ember (2026): Energy Institute – Statistical Review of World Energy (2025) OurWorldinData.org/energy | CC BYLow carbon sources met all of 2025’s electricity demand growth. Change in global electricity generation by source, 2024 to 2025. Total generation rose by 850 terawatt-hours (TWh). Note: “Other renewables” include hydropower, bioenergy, tidal and geothermal. Data source: Ember (2026). This graph comes from this page.
New solar panel technology such as Perovskite Solar cells is being developed. The price of lithium-ion batteries has fallen by 99% since 1991 and by 82% in the last ten years. New battery technology such as sodium-ion batteries is being developed. One advantage of sodium-ion batteries is that they function exactly like a lithium-ion battery but replace lithium with abundant sodium ions to carry the electric charge. The evolving battery technology makes it easier to store power from solar during the night. SolarPower Europe project that the global solar fleet will more than double by 2030. In other words, the future looks bright for solar power, and that pun was intended.
Three different scenarios / projections by SolarPower Europe. The medium scenario predicts slightly more than a doubling of global solar fleet from 2026 to 2030.
Solar Power as a Share of Electricity Generation Around the World
For solar, the United States follows the rest of the world closely. Some countries have a higher percentage, such as the Cook Islands – 50%, Luxembourg – 30.52%, Chile – 25.06%. If you wish you can take a closer look here, or here, and you can play around with the different graphs. You can pick millions of combinations of countries and regions. For illustrative purposes I am showing some combinations below.
Share of electricity production from solar. Measured as a percentage of total electricity in the country or region. Some countries utilize solar more than other countries. These graphs include, Cook Islands, Luxembourg, Chile, Greece, Spain, Netherlands, Australia, Germany, the World and the United States. Data source: Ember (2026); Energy Institute – Statistical Review of World Energy (2025) OurWorldinData.org/energy | CC BYThis graph shows that China has expanded their share of solar power a bit faster than the rest of the world. The share of electricity generated from Solar Power in the world was 8.75% in 2025 and in China 11.1%. Share of electricity production from solar. Measure as a percentage of total electricity in the country or region. Data source: Ember (2026); Energy Institute – Statistical Review of World Energy (2025) OurWorldinData.org/energy | CC BYThis graph shows the share of electricity generated from Solar Power in the largest countries and economic regions in the world. The share of electricity generated from Solar Power in the EU was 13.13% in 2025, in China 11.1%, in India 9.42%, in the World 8.75%, and in the US 8.6%. Data source: Ember (2026); Energy Institute – Statistical Review of World Energy (2025) OurWorldinData.org/energy | CC BY
How Clean and Safe is Solar Energy ?
You sometimes come across claims that renewable energy isn’t really clean energy. The truth is that renewable energy such as wind, solar, etc., is much cleaner than gas, oil, and coal. These energy sources are also much safer and using them saves a lot of lives. As you can see, among the eight energy sources depicted solar is the safest, and among the cleanest. Coal has 1,230 times higher death rate than solar. According to the Energy Policy Institute at the University of Chicago Chinese citizens can expect to live on average 2.2 years longer than they would have a decade ago, due to the sharp drop in pollution. This is thanks to the increased use of EVs and renewables such as solar.
Greenhouse gas emissions and death rates from various sources of energy. Fossil fuels and biomass are based on state-of-the art plants with pollution control in Europe and are based on older models of the impacts of air pollution on health. This means that these death rates are likely to be very conservative. The graph shows that renewables and nuclear energy are the cleanest and safest forms of energy. For further discussion see the article: OurWorldinData.org/safest-sources-of-energy. Electricity shares are given for 2021. Data sources: Markandya & Wilkinson (2007); UNSCEAR (2008: 2018); Sovacol et al. (2016); IPCC AR5 (2014); UNECE (2022); Ember Energy (2001). OurWorldinData.org – Research and data to make progress against the world’s largest problems. Licensed under CC-BY by the authors Hannah Ritchie and Max Roser. Citation : Hannah Ritchie (2020) – “What are the safest and cleanest sources of energy?” Published online at OurWorldinData.org. Retrieved from: ‘https://archive.ourworldindata.org/20260202-100556/safest-sources-of-energy.html‘ [Online Resource] (archived on February 2, 2026).
Below are two pictures corresponding to zoom-in of the graph above.
Death rates from accidents and air pollution. Measured as deaths per terawatt-hour of electricity production. 1 terawatt-hour is the annual electricity consumption of 150,000 people in the EU. The graph shows that coal, oil, gas, and biomass are a lot deadlier than hydropower, wind, nuclear power, and solar.Greenhouse gas emissions. Measured in emissions of CO2 per gigawatt-hour of electricity over the lifecycle of the power plant. 1 gigawatt-hour is the annual electricity consumption of 150 people in the EU. The graph shows that coal, oil, gas, and biomass are responsible for a lot more greenhouse gas emissions than hydropower, wind, nuclear power, and solar.
Important Climate and Energy Facts
As I said, the misinformation about climate science has bamboozled a lot of people. We know that climate change / global warming is happening. We have also known for several decades that the current climate change / global warming is not natural. It is caused by us, chiefly due to the burning of fossil fuels. Yet many non-scientists dispute it.
The scientific evidence is conclusive, but a lot of people know very little about the evidence. It includes satellites directly measuring our greenhouse gases trapping heat, the upper troposphere is cooling whilst the lower atmosphere is warming, showing that the heating is from greenhouse gases, the unnatural speed of the warming is another piece of evidence, isotope studies, climate models, etc. Below are fourteen super facts related to climate science and clean energy.
Superfact 116: Time and space do not exist for light particles (called photons) and not for other particles without mass either. All massless particles travel at the speed c = 299,792,458 meters per second compared to all other objects regardless of how fast those other objects are moving. Objects / particles that have mass will always travel slower than c = 299,792,458 meters per second. The speed of light, c, is not really a speed. It is a conversion factor between space and time. It is therefore a universal constant.
Billions of photons coming into the eye. Shutterstock asset id: 2629068895 by muratart.
Light does not travel through a medium, like a sound wave, or a water wave does. There is no medium for light to travel in. Photons are massless, which means that an extremely tiny force, an infinitesimal smallest possible force, could send a photon off at infinite speed. There is no mass to hold the photon back.
However, the conversion factor between space and time c = 299,792,458 meters per second will prevent that and the photon will travel at this “speed”. Since c is a conversion factor, a physical constant describing time and space, this is not motion, or movement, in a normal sense. Space and time won’t allow any physical event to have any effect faster, and no information of any kind can travel faster than c = 299,792,458 meters per second.
This means that from the photon’s perspective there will be no time at all. A photon, or a light beam, will travel from Earth to a distant galaxy a billion light years away in an instant. It will not take a billion years. It will not take one year. It will not take one second. It will not take one microsecond. It will not take a nanosecond, or a picosecond, or a trillionth of a picosecond. It will take zero seconds. The Big Bang and the end of the Universe (if there is one) happen at the same exact moment to a photon. Time does not exist for a photon (or a gluon, or any other mass-less particle).
This is a mind-blowing fact, and it is true and important to our understanding of the Universe. Therefore, I consider it a super fact.
What does the Speed of Light Being a Universal Constant Mean ?
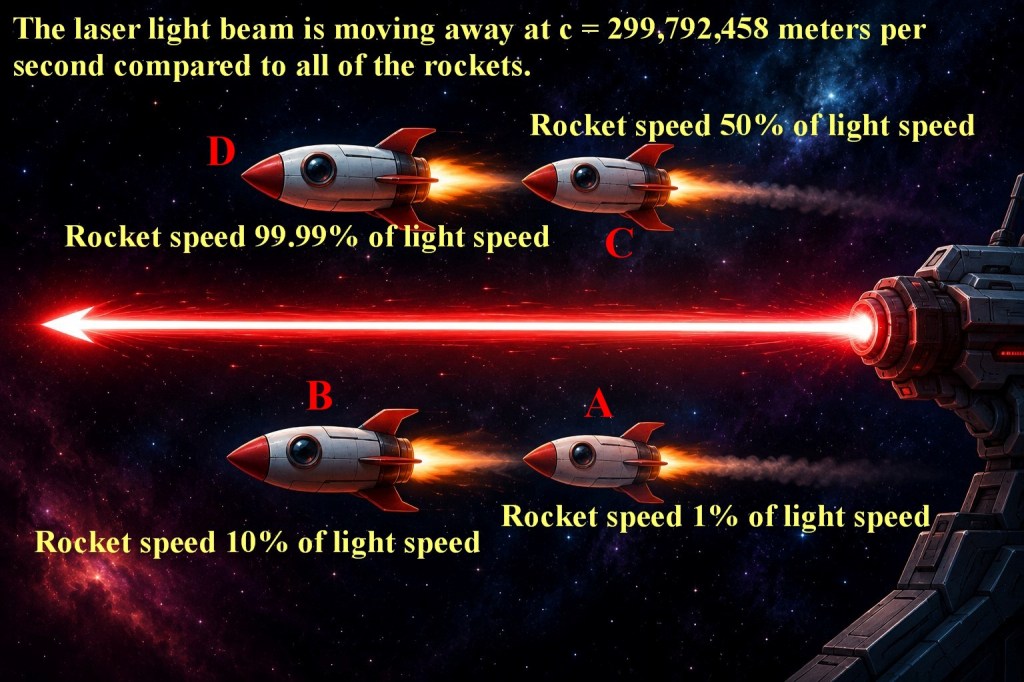
Four rockets, A, B, C, and D, are traveling along a light (laser) beam. No matter how fast they travel along the light beam, the light beam will always travel c = 299,792,458 meters per second faster than they do. I generated this picture with the help of ChatGPT.
The first thing to acknowledge about the speed of light (in vacuum) is that it is a universal constant as explained in my post “The Speed of Light in Vacuum Is a Universal Constant”. However, I am explaining this fact slightly differently in the next few paragraphs with the help of the picture above.
In the picture above we are emitting a light beam from our spaceship using our super laser. There are also four rockets that travel along the light beam. The rocket on the lower right (rocket A) travel at 1% of the speed of light v = 2,997,924.5 meters per second (or 2,998 miles per second). That is extremely fast, but much slower than light. You would think that the light beam would travel a little bit slower compared to this rocket at the relative speed c – v = 299,792,458 – 2,997,924.5 = 296,794,533.5 meters per second. But it doesn’t. The light beam is still speeding ahead of rocket A at exactly c = 299,792,458 meters per second.
What happens if you compare the beam with the rocket in the lower left (rocket B)? That rocket travels at 10% the speed of the light beam. Shouldn’t the light beam move 10% slower compared to that rocket? No, the light beam speeds ahead at exactly c = 299,792,458 meters per second compared to rocket B, once again.
Now take rocket C in the upper right corner. It also travels along the light beam but at half the speed of light. Shouldn’t the light beam travel at half of the speed of light compared to rocket C? No, it will stubbornly travel at exactly c = 299,792,458 meters per second compared to rocket C. Not less and not more.
The same is true for the rocket in the upper left, rocket D. It travels at 99.99% of the light speed compared to us in the spaceship, and yet the light beam will stubbornly travel at exactly c = 299,792,458 meters per second compared to rocket D. Not less and not more.
The universal speed c = 299,792,458 meters per second is not so much about light. As mentioned, it is a conversion factor between space and time. You take this conversion factor with you everywhere you go and regardless of how fast you move. That’s the way time and space works.
The fact that the speed of light is a universal constant that is exactly the same for all observers, no matter how fast they move, should tell you that it is not a speed in a normal sense. It is not really a “speed” at all. As mentioned, it is a conversion factor between space and time. Light isn’t really travelling super-fast. It is just conforming to the geometric reality of time and space, and to us it looks like it is travelling at the speed c = 299,792,458 meters per second.
The Space-Time Interval for Light is Zero
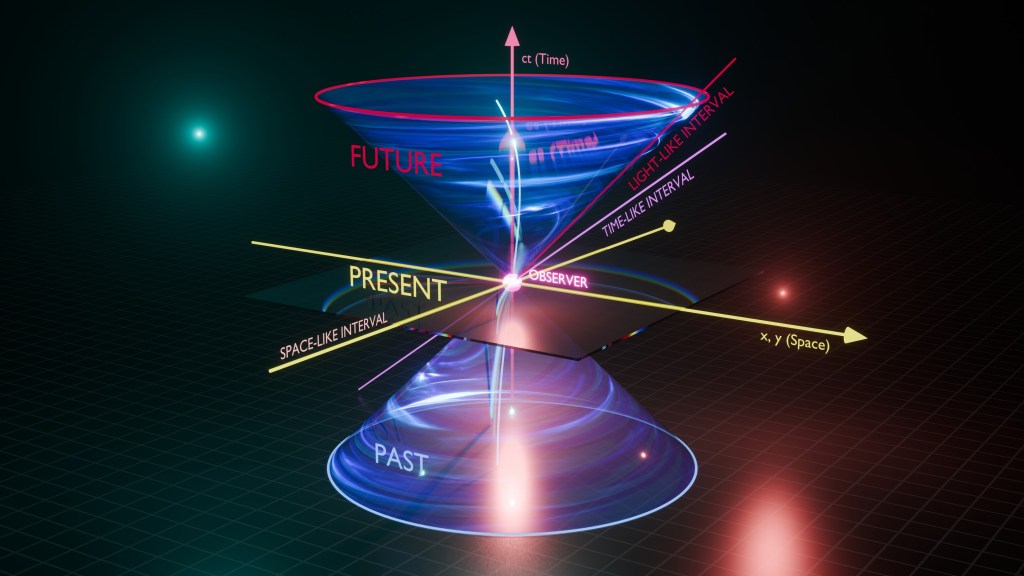
I mentioned that from the photons perspective time does not exist but that from our perspective light travel through space or seem to travel through space and that takes time. However, for us space and time are separate things. If you combine them and measure space-time intervals instead you get a more complete picture. In 3D space you get the distance between two points by adding the differences between the coordinates using Pythagoras theorem, s^{2}=x^{2}+y^{2}+z^{2}. (x, y, and z, are differences in the coordinates) As long as you are consistent with the units you will always get the same distance regardless of position and orientation of your coordinate system. You can read more here.
If you add time to Pythagoras theorem you will get the space-time interval, which interestingly enough is the same for all observers. There is no time dilation or length contraction in the interval. s^{2}=x^{2}+y^{2}+z^{2}+(it)^{2} As you might suspect, intervals involving light travelling from one event to another will always be zero for all observers, and not just from the photons perspective. And again, the same applies to all massless particles. Below are the Pythagoras formulas for different versions of the interval. In the top picture it is assumed that the conversion factor c = 299,792,458 meters per second has already been baked into to the time variable and in the bottom it has not. This is not any stranger than converting feet to meters.
The three formulas for the spacetime interval above all assume that the unit used for time is the time it takes light in vacuum to travel the distance unit used. If that is meters, it would be the time it takes light to travel one meter. The top formula is the Euclidian form of spacetime. It contains only the ‘+’ operator at the expense of adding the imaginary number (square root of -1) in front of the time coordinate. The second form is typically used with time like intervals and considered the standard form. The third form is used when the distance between two events is larger than the time distance, or distance like intervals.If you measure the space coordinates in meters and the time in seconds you must adjust the units to match by inserting the speed of light in vacuum c = 299,792,458. The three forms of the space interval now have the constant c attached to the time coordinate.
What about the speed of light in water ?
It is well known that the speed of light in transparent materials such as water and glass is slower than the speed of light in vacuum. The speed of light it water is about 75% of the speed in vacuum and about 70% or less in glass (depending of the type of glass) compared to the speed in vacuum. In some materials the speed of light can be much less than that. This seems to violate what I said above about the speed of light always moving at c = 299,792,458 meters per second for all observers regardless of their speed.
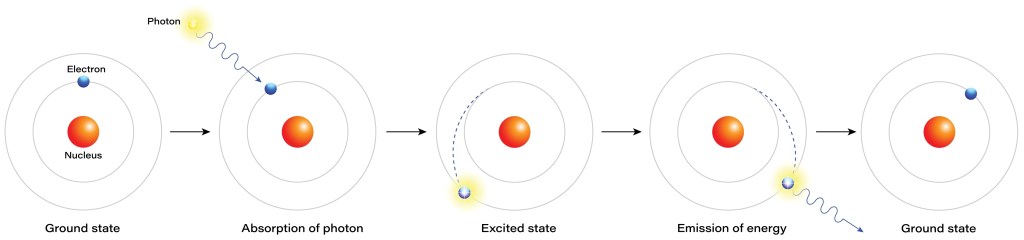
What is going on is that when light moves through matter it is being absorbed and emitted as it “travels” between the atoms in the material, and this absorption and emittance process takes time. This time is extremely short but long enough to be measurable. As the photons move in between the atoms they travel at the “speed” c = 299,792,458 meters per second, the time to space conversion factor I’ve been talking about. See the illustration below.
From ground state to excited state, absorption and emission of a photon in an atom. Shutterstock asset id: 2180385419 by rktz.
More about the mass of a Photon
I’ve said photons have no mass. According to Einstein’s theory of special relativity, time does not pass (or effectively “exist”) from the perspective of a massless particle. However, this is the intrinsic mass or so called proper mass or invariant mass. It is the mass of an object as measured by an observer who is completely at rest relative to it. This intrinsic mass is the mass that a photon does not have.
The mass of an electron is 511 Kilo Electron Volts, which is 0.0000000000000000000000000009109 grams. That is the intrinsic mass of the electron. If an electron is sped up to close the speed of light its mass increases and goes toward infinity. If its speed is very close to the speed of light its mass could be much bigger than that of the entire Universe. That’s because as you are increasing the speed of the electron, you are increasing its kinetic energy and as you increase the total energy of the electron you also increase its total mass according to E = mc2.
As the electron’s speed approaches the speed of light the kinetic energy goes toward infinity. That is one reason why it is impossible to travel at exactly the speed of light for anything but massless particles. Infinite energy and infinite mass are not realistic. We, the objects that have mass, can move closer and closer to light speed but never get there.
However, the intrinsic mass for photons is zero and therefore the photon is travelling at exactly the speed of light, c = 299,792,458 meters per second. E = mc2 still applies to light but the mass is not the intrinsic mass, which is zero, but the total mass, and the total mass can pretty much take on any number.
What about Warp Drives ?
So, nothing with mass can travel at the speed of light, and nothing can exceed it. What about the warp drive in Star Trek? As I said, the speed of light is not really a speed but the conversion factor between time and space. It is a geometric fact of space-time. That is a pretty difficult reality to get around, just like it is pretty difficult to push Earth out of its orbit by pushing on the floor. However, there is a way to cheat and that is to stretch space-time itself. This is theoretically possible, but it requires colossal amounts of mass-energy and enormous amounts of negative energy. We don’t even know if negative energy exists on a macroscopic scale.
So, no one knows if a warp drive is possible, and if it isn’t, then we are stuck moving slower than the speed of light, which would make interstellar travel very difficult and inconvenient.
Richard Feyman’s Lecture on Why Light Is NOT Moving Through Space?
The YouTube video below is very long, 48 minutes. However, Richard Feyman, Nobel prize winner in physics, has a knack for explaining extremely abstract concepts so that they are easy to understand. If you are very interested in this topic and have some extra time, this is a fascinating lecture. He certainly explains this topic better than I can.
Superfact 115: Transitional Fossils are not rare. Fossilization itself is a rare event and despite that paleontologists have discovered numerous transitional fossils that illustrate the gradual evolution of, for example, humans, whales, horses, rhinos, other mammals, birds, fish to amphibians (fishapods), etc.
Shutterstock asset id: 2500328883 by Rebel Red Runner
As mentioned, fossilization is an extremely rare event and therefore the fossil record is expected to be incomplete and to contain “gaps”. Additionally, many transitional species had smaller populations or lived in environments where preservation was difficult. Another thing to keep in mind is that evolution is not a linear chain. There are no perfect halfway points. Species evolve and diversify in a branching tree. A transitional fossil is any fossilized remain of a life form that exhibits traits common to both an ancestral group and its later descendant group, meaning every organism is technically transitional.
Microevolution is small changes resulting in large changes over time. Macroevolution are multiple microevolutionary steps turning into “macroevolution”.
What people tend to focus on is transitional fossils between ancestral groups and descendant groups that are far part, and feature interesting differences, and are far back in time, such as the land living ancestors of whales and modern whales, which before such transitional fossils were found represented a large “gap”. What may come as a surprise to many people is that many so called “gaps” have been filled out by new fossil discoveries. You can of course always add new “gaps” as old ones are filled in. You can always imagine as many gaps as you’d like.
However, gaps, or “missing links”, or the quantity of transitional fossils, etc., does not represent a problem for the theory of evolution as often claimed. In other words, Transitional Fossils are not rare.
The picture above shows the famous Lucy skeleton. She belonged to a species called Australopithecus afarensis, which is a famous transitional species in human evolution, bridging the gap between more primitive, quadrupedal ancestors and the later Homo genus.
Below is a simplified cladogram showing hominin ancestry including Australopithecus afarensis. Notice that we did not descend from chimpanzees, but we have a common ancestor with chimpanzees. This was discovered from DNA analysis.
Simple cladogram showing evolution of modern man from Hominid Ancestor Shutterstock Asset id: 2093535535 by CLOUD-WALKER.
The creationist talking point about “missing links”, or the supposed lack of transitional fossils is misguided (see point 13) but very common in popular culture. Not too long ago I read a book “Darwin on trial” by Phillip E. Johnson, which is often considered to be a scientific and powerful creationist rebuttal of the theory of evolution. This book featured many erroneous assertions including this talking point and, in addition, it misrepresented the fossil record with respect to transitional fossils.
Pretty much all of the around 300 Amazon reviewers for this book bought his arguments and gave the book five stars. Only a few well informed individuals saw the problems. I have also come across this argument many times in my personal life and on social media, and I know a lot of people around the world accept it. Millions, if not hundreds of millions of people believe something that is false on this important topic. That is why I consider “Transitional Fossils are not rare” a super fact.
Some Famous Transitional Fossils
Technically all fossils can be considered transitional fossils and there are hundreds that have been recognized to have clear and interesting transitional features. Below I am mentioning just a few of those. I’ve already mentioned, “Lucy”, the hominid Australopithecus afarensis which represents an evolutionary transition between modern bipedal humans and their quadrupedal ape ancestors. We have found a few hundred Homo erectus fossils, and naturally Homo Erectus is considered another transitional fossil(s) that is crucial to human evolution. It bridges the gap between more primitive, ape-like hominins (like Australopithecus) and modern humans (Homo sapiens).
H. e. georgicus (above) is an early subspecies of Homo Erectus. It represents one of the earliest dispersals out of Africa about 1.8 million years ago. Gerbil, CC BY-SA 4.0 https://creativecommons.org/licenses/by-sa/4.0, via Wikimedia Commons.
As a side note, according to this article, Homo Erectus genetic material was recently sequenced for the first time, and it shows ‘deep genetic links’ with modern humans. Since DNA material degrade by time and Homo Erectus lived hundreds of thousands of years ago, that is quite remarkable.
Another famous transitional fossil is Tiktaalik roseae. Tiktaalik roseae is a link in evolution from swimming fish to four-legged vertebrates. Tiktaalik lived 375 million years ago, and its skeletal structure shows that it could prop itself up in shallow water and use its limbs for support as most four-legged animals do, and its head resembled that of a crocodile. It also had other characteristics that were like both fish and four legged animals.
Archaeopteryx is a birdlike dinosaur that retained reptilian features such as teeth and a bony tail while having advanced flight feathers. 14 Archaeopteryx fossils have been found. Partially because of transitional fossils found Birds are now reclassified as Avian Dinosaurs.
Archaeopteryx lithographica, specimen displayed at the Museum für Naturkunde in Berlin. (This image shows the original fossil – not a cast.) H. Raab (User: Vesta), CC BY-SA 3.0 <https://creativecommons.org/licenses/by-sa/3.0>, via Wikimedia Commons.Another Archaeopteryx fossil. Shutterstock Asset id: 1913076019 by Natalia van D.
Caudipteryx was a small oviraptorosaurian dinosaur that lived 125 million years ago. It had teeth but was otherwise very birdlike. It was likely a swift runner. You can read about another dozen interesting dinosaur to bird transitional species in my post “Birds are Avian Dinosaurs”.
Caudipteryx zoui, Skelett – Untere Kreide – Liaoning/China – aufgenommen im Museum am Löwentor, Stuttgart. Ra’ike (see also: de:Benutzer:Ra’ike), CC BY-SA 3.0 <https://creativecommons.org/licenses/by-sa/3.0>, via Wikimedia Commons.
Thrinaxodon is a 230-million-year-old cynodont, in other words, a mammal-like reptile. Its posture was something between a reptile and a mammal, it had mammal like teeth, it was likely warm blooded, and mammal like ear drums. However, it laid eggs, its spine and jaw were like that of a reptile, and it had a light sensor on its forehead typical for reptiles.
Eohippus was Also known as Hyracotherium, this 50-million-year-old ancestor of the horse was dog-sized and had four toes on its front feet and three on its back.
Eohippus illustration. Charles Robert Knight, Public domain, via Wikimedia Commons.
Cooksonia lived 425 million years ago and is considered the oldest known vascular plant (have specialized tissue to transport water). It is therefore a crucial evolutionary transition between primitive, non-vascular bryophytes (like mosses and liverworts) and the first true vascular plants (like ferns and advanced tracheophytes).
A cartoon of Cooksonia, reconstructed with non-photosynthetic axes, dependent on its gametophyte. Smith609Ground texture from Image:Mud closeup.jpg, CC BY 3.0 <https://creativecommons.org/licenses/by/3.0>, via Wikimedia Commons.
The case of the whales did present a bit of a mystery for a while. Scientists recognized that whales descended from land animals already in the 19th century. However, it was not until the 1980’s that intermediate fossils for whale evolution were found.
In addition, molecular and genetic / DNA studies showed that Hippopotamus and whales were closely related. Until then the evolution of whales was a bit of a mystery and creationists frequently mocked the lack of intermediate fossils for whale evolution. However, as you can see in my super fact post “The Evolution of Whales is No Longer a Mystery” we’ve found dozens of intermediate (transitional) fossils between land mammals such as Pakicetus and modern whales. Below is an Ambulocetus skeleton. To see the other transitional species (with illustrations) check my link.
I said that there were hundreds of transitional fossils that have been recognized to have clear and interesting transitional features. Well, that might be many thousands. In any case, transitional fossils are not lacking and are not rare. The mystery of the missing links is a myth.
Superfact 114: Early humans (early Homo sapiens) lived at the same time as many other homo species including Neanderthals (Homo Neanderthalensis) and Humans and Neanderthals Interbred.
Neanderthals Archaic Extinct Human Skull Vs Modern Human Skull Comparison. Shutterstock Asset id: 2238778267 by Winters860
It’s been known for more than a decade that ancient members of our species, Homo sapiens, met and mated with our evolutionary cousins, Neanderthals. If you have read the Savage Land trilogy by Jacqui Murray, or you have taken a DNA test from, for example, 23AndMe, then you already knew that. Today, up to 2% of the genomes of people outside sub-Saharan Africa originated from Neanderthals. The Neanderthal genome was successfully sequenced in 2010. You can read more about it here. More recently, an analysis of Neanderthal X chromosomes found that most cross-species couplings involved Neanderthal males and modern human females.
My wife and I took a DNA test with 23AndMe to find out about inherited diseases as well as our ancestry. I found out that my ancestry was 99.8% Northwestern European, 85.3% Scandinavian/Sweden/Norway, 14.4% Finnish, 0.1% other Northwestern European, and 0.2% Siberian. I also found out that I had strong Neanderthal ancestry. The report said that I have more Neanderthal variants than 99% of customers. Even though this kind of information is fun, it is risky to have some of this information exposed, so I deleted it.
Geneticist sequencing human genome Asset id: 2479929725 by FOTOGRIN
Anyway, I consider this a super fact because it comes as a surprise to many that humans and Neanderthals interbred, and that many of us therefore have traces of neanderthal DNA. It is also an important fact that we know is true.
Known Neanderthal range in Europe (blue), Southwest Asia (orange), Uzbekistan (green), and the Altai mountains (violet), as inferred by their skeletal remains (not stone tools). There were 165 such places by 2017. Nilenbert, N. Perrault, auteur du guide complet du canotageI, CC BY-SA 3.0 <http://creativecommons.org/licenses/by-sa/3.0/>, via Wikimedia Commons
Early Homo Sapiens lived at the same time as many other human species
Early humans, early homo sapiens, lived at the same time as many other human species, not just Neanderthals. Early Homo sapiens lived at the same time as Denisovans, Homo floresiensis, Homo naledi, Homo luzonensis. Homo heidelbergensis, Homo erectus, and maybe other species as well. Neanderthals interbred with homo sapiens and died out around 40,000 years ago. The Denisovans also interbred with homo sapiens and died out around 30,000 to 50,000 years ago. Moreover, Homo Neanderthalensis interbred with Homo Denisova. You can read more here and here.
The evolution and geographic spread of Denisovans as compared with Neanderthals, Homo heidelbergensis and Homo erectus. John D. Croft at English Wikipedia, CC BY-SA 3.0 https://creativecommons.org/licenses/by-sa/3.0, via Wikimedia Commons.
Speciation is considered relative
Homo Neanderthalensis and Homo Sapiens were different species, so it may seem strange that they could interbreed. However, species is a complex non-static concept, and it is considered relative.
It is often said that two animals belong to the same species if they can interbreed in nature and produce viable, fertile offspring. However, it is not that simple. An animal A may be able to successfully interbreed with an animal B, and that animal B may be able to successfully interbreed with an animal C, but animal A and C cannot interbreed. Animal A could be said to be a different species relative to animal C, but animal B could be said to be the same species as both animal A & C using the definition above. A great geography related example of this is ring species. In a ring species, gene flow occurs between neighboring populations of a species, but at the ends of the ring the populations don’t interbreed.
Illustration of ring species, an example of how speciation can be relative. All the circles next to each other can interbreed but at the end it no longer works. Andrew Z. Colvin, CC BY-SA 4.0 <https://creativecommons.org/licenses/by-sa/4.0>, via Wikimedia Commons
For the case of Neanderthals and Homo sapiens (and Denisovans); at certain points in history, you could consider Homo Neanderthalensis and Homo Sapiens to be different subspecies rather than different species. That is why you sometimes hear the terms Homo Sapiens Neanderthalensis and Homo Sapiens Sapiens. I can add that Homo sapiens certainly got around, as you can see on the map below.
The spread of Homo Erectus (yellow), Homo Sapiens (red) and Homo Neanderthalensis (dark yellow). NordNordWest, Public domain, via Wikimedia Commons
Super fact 113 : There are shapes that have a limited volume but an infinite surface area. Two examples are Gabriel’s Horn and the Menger Sponge.
3D illustration of Gabriel’s horn. RokerHRO, Public domain, via Wikimedia Commons.
You get Gabriel’s horn by rotating the curve y = 1/x around the x-axis in a coordinate system with the horn starting at x = 1, and y = 1, as in the picture below. Well, you can choose other start values too. A Gabriel’s horn with a beginning radius 1, or widest radius 1, (as in this example) will have a volume equal to pi. Pi is a popular constant. However, it will have an infinite surface area.
This seems like a paradox. The amount of paint you need to fill up Gabriel’s Horn (with widest radius = 1) is pi. However, the surface area of the outside and inside is infinite. So, wouldn’t you need an infinite amount of paint to paint the inside of Gabriel’s Horn? The amount of paint you need to fill up the horn should be more than if you just paint the inside, shouldn’t it? What’s going on? The solution to the paradox is to realize that the radius of Gabriel’s Horn will become increasingly small as it stretches out to the right, and for a coat of paint to take up volume it must have thickness. This is explained well here.
If you rotate this curve around the x-axis, you get a trumpet shape. That is Gabriel’s Horn. I was lazy and drew this using ChatGPT instead of drawing it myself.
To understand why it is possible for the surface area of Gabriel’s Horn to become infinite you can imagine two cylinders of equal volume, one short (and thick), and one long (and thin). The longer and thinner cylinder will have a larger surface area as shown in the picture below. As Gabriel’s Horn is stretched out and getting thinner and thinner you get an infinite surface area, as you go towards infinity, while the volume does not become infinite. This is analogous to the infinite series in my previous post where adding an infinite number of subsequently smaller addends results in a finite number (corresponding to the volume being finite in this case).
This picture (drawn by me) shows that when you elongate a cylinder but keep the volume the same the dark blue surface area gets larger.
The way you construct a Menger sponge or a Menger cube is by starting with a cube.
Then divide every face of the cube into nine squares in a similar manner to a Rubik’s Cube, dividing the cube into 27 smaller cubes.
Then remove the smaller cube in the middle of each face and remove the smaller cube in the center of the larger cube, leaving 20 smaller cubes. This is a level 1 Menger sponge.
Repeat steps two and three for each of the remaining smaller cubes and continue to iterate infinitely many times.
As you are repeating this process over and over the volume of the Menger sponge will decrease a little bit in every step whilst the area will grow towards infinity.
An illustration of the iterative construction of a Menger sponge up to M3, the third iteration.
The Jerusalem Cube is like the Menger sponge/cube but instead of removing cubes you remove cross or plus looking 3D shapes from the larger cubes.